5232
Microscopic diffusion anisotropy imaging in the kidneys1Developmental Imaging and Biophysics Section, UCL Great Ormond Street Institute of Child Health, London, United Kingdom, 2UCL Institute of Neurology, Department of Brain Repair and Rehabilitation, London, United Kingdom, 3Centre for Medical Image Computing, Department of Computer Science, University College London, London, United Kingdom, 4Clinical Sciences, Lund, Lund University, Lund, Sweden, 5Random Walk Imaging AB, Lund, Sweden
Synopsis
Diffusion tensor imaging (DTI) is a widely used diffusion weighted imaging (DWI) approach, successful owing to its sensitivity to changes in tissue microstructure. Recent advances in diffusion MRI acquisition using arbitrary b-tensor shapes allow the in-vivo estimation of tissue microscopic fractional anisotropy (μFA), which unlike conventional fractional anisotropy (FA) is not confounded by orientation dispersion. The aim of this work is to investigate, for the first time, the feasibility of μFA quantification in the kidneys of healthy volunteers.
Introduction
Diffusion tensor imaging (DTI) is a widely used diffusion weighted imaging (DWI) approach, successful owing to its sensitivity to changes in tissue microstructure. However, at a microscopic level, heterogeneous tissue can be seen as a distribution of diffusion tensors (diffusion tensor distribution; DTD), which in DTI are averaged into a single voxel-scale tensor. If an experiment is limited to a single diffusion encoding b-tensor shape, such as conventional linear encoding, situations arise where vastly different tissues may yield virtually identical signal [Mitra1995, Lasič2014, Szczepankiewicz2015]. This causes ambiguities in the interpretation of tissue fractional anisotropy (FA). To obtain more specific information on the underlying DTD compared to what is possible using LTE alone, spherical tensor encoding (STE) using optimised gradient waveforms [Sjolund2015] has been proposed and demonstrated in the brain [Szczepankiewicz2015] and prostate [Nilsson2017]. A joint analysis of LTE and STE allows the quantification of tissue microscopic anisotropy (μFA), analogous to conventional FA but without the confounding effect of orientation dispersion [Lasič2014]. The aim of this work is to investigate, for the first time, the feasibility of μFA quantification in the kidneys of healthy volunteers.Methods
Five adult healthy volunteers were scanned on a 3T Siemens Prisma system using a prototype spin-echo sequence with EPI readout that facilitates diffusion encoding with variable b-tensor shapes. Data was acquired with LTE and STE using FOV=400x300mm2, voxel size=3.1x3.1.x5.0mm3, 14 coronal oblique slices, TR/TE=3200/87ms; 3/4 Partial Fourier and GRAPPA R=2 undersampling; b-values / averages=[0, 250, 500, 750, 1000] s/mm2 / [4, 2, 2, 2, 2]; 12 directions. The nominal scan time was 5min 30s for each encoding scheme (LTE+STE) and respiratory triggering on end-expiration was used. Encoding waveforms were optimized numerically [Sjölund2015]. Retrospective motion correction (image registration) and model fitting were performed using an open source library (github.com/markus-nilsson/md-dmri), implemented in MATLAB (The Mathworks, Natick, MA). Image registration (using elastix [Klein2010]) including extrapolation-based registration for high b-value data [Nilsson2015] was performed separately for the left and right kidneys. A gamma model was used for quantification of μFA [Lasič2014]. Cortical and medullary regions of interest (ROIs) were manually segmented in the reference mean b-zero image.Results
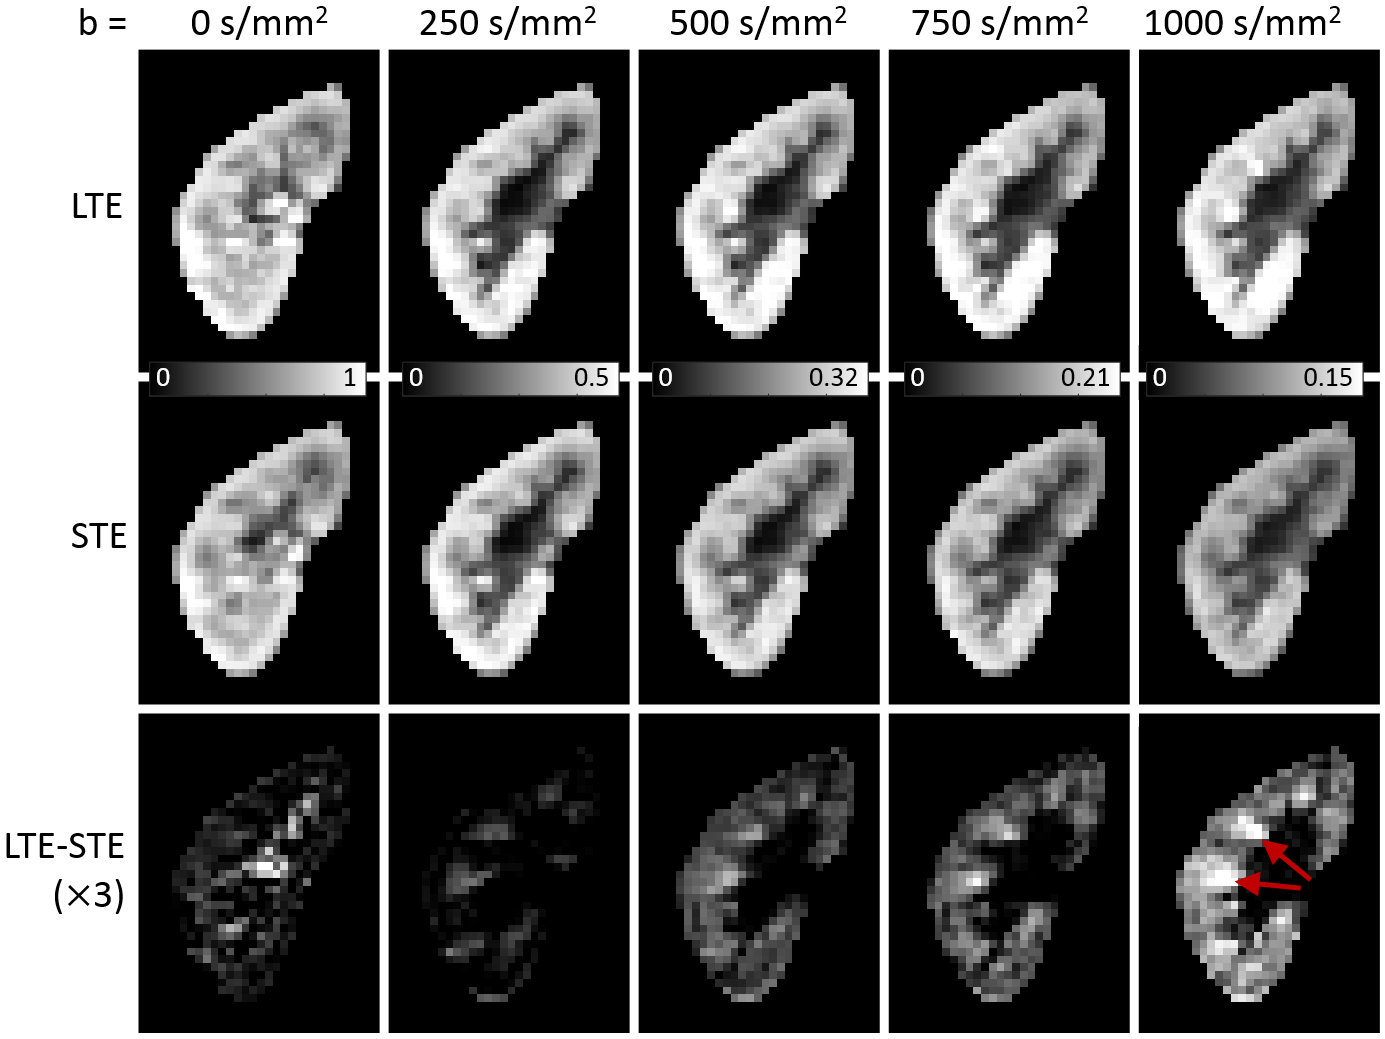
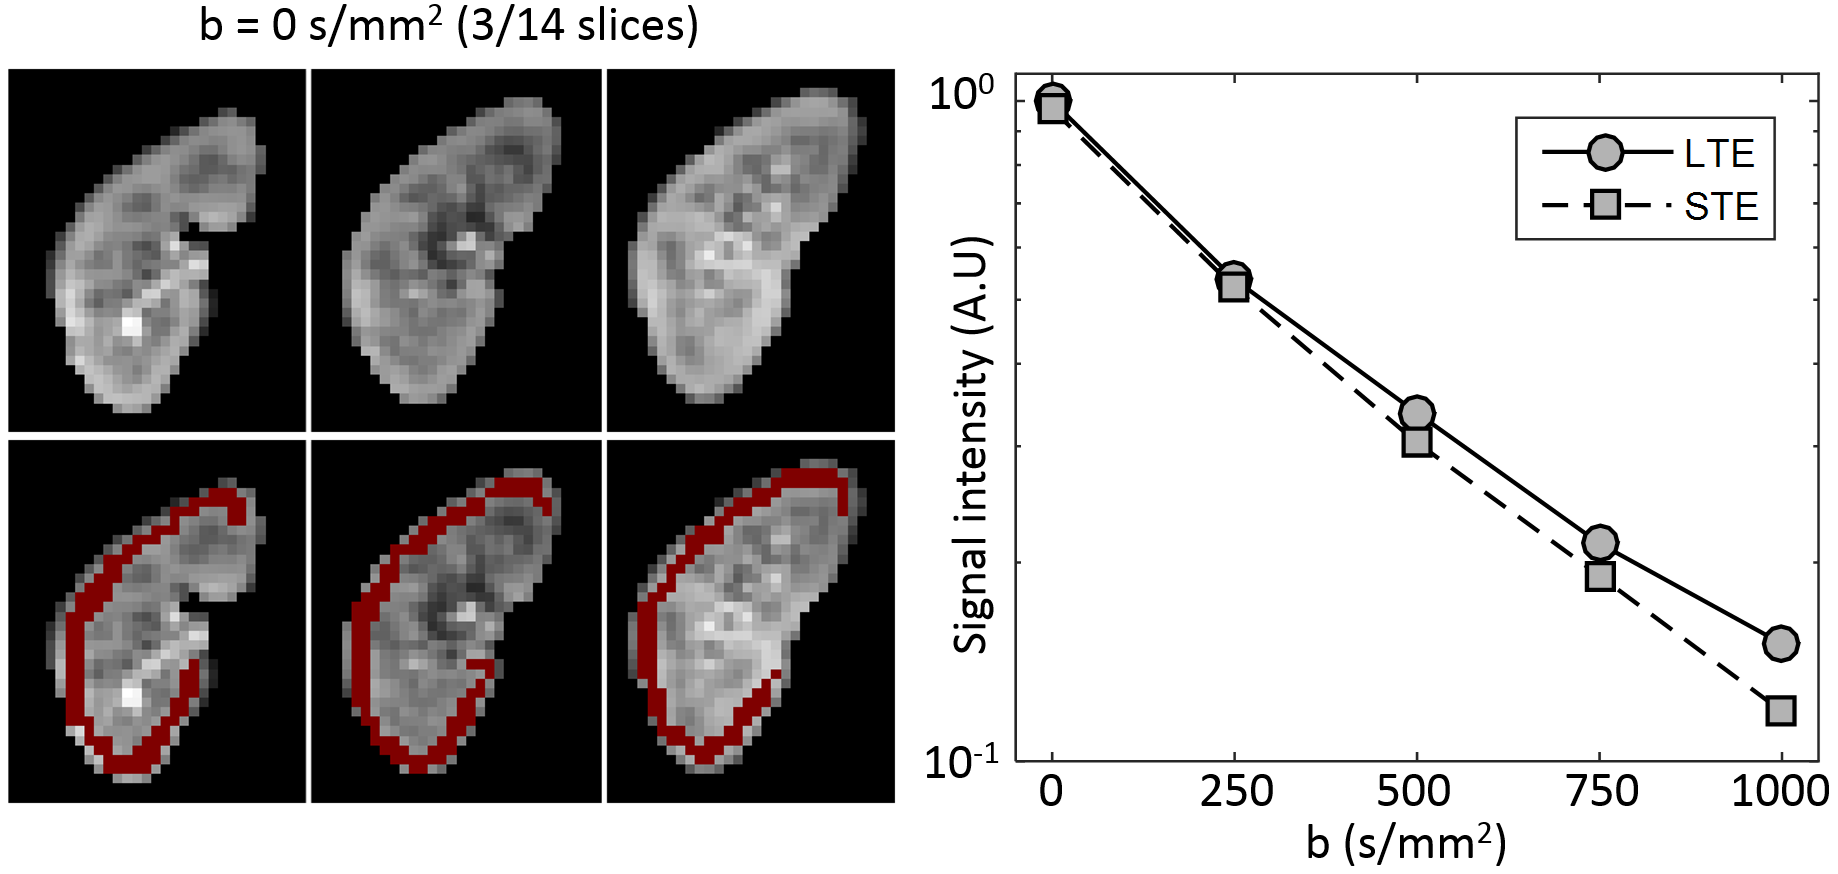
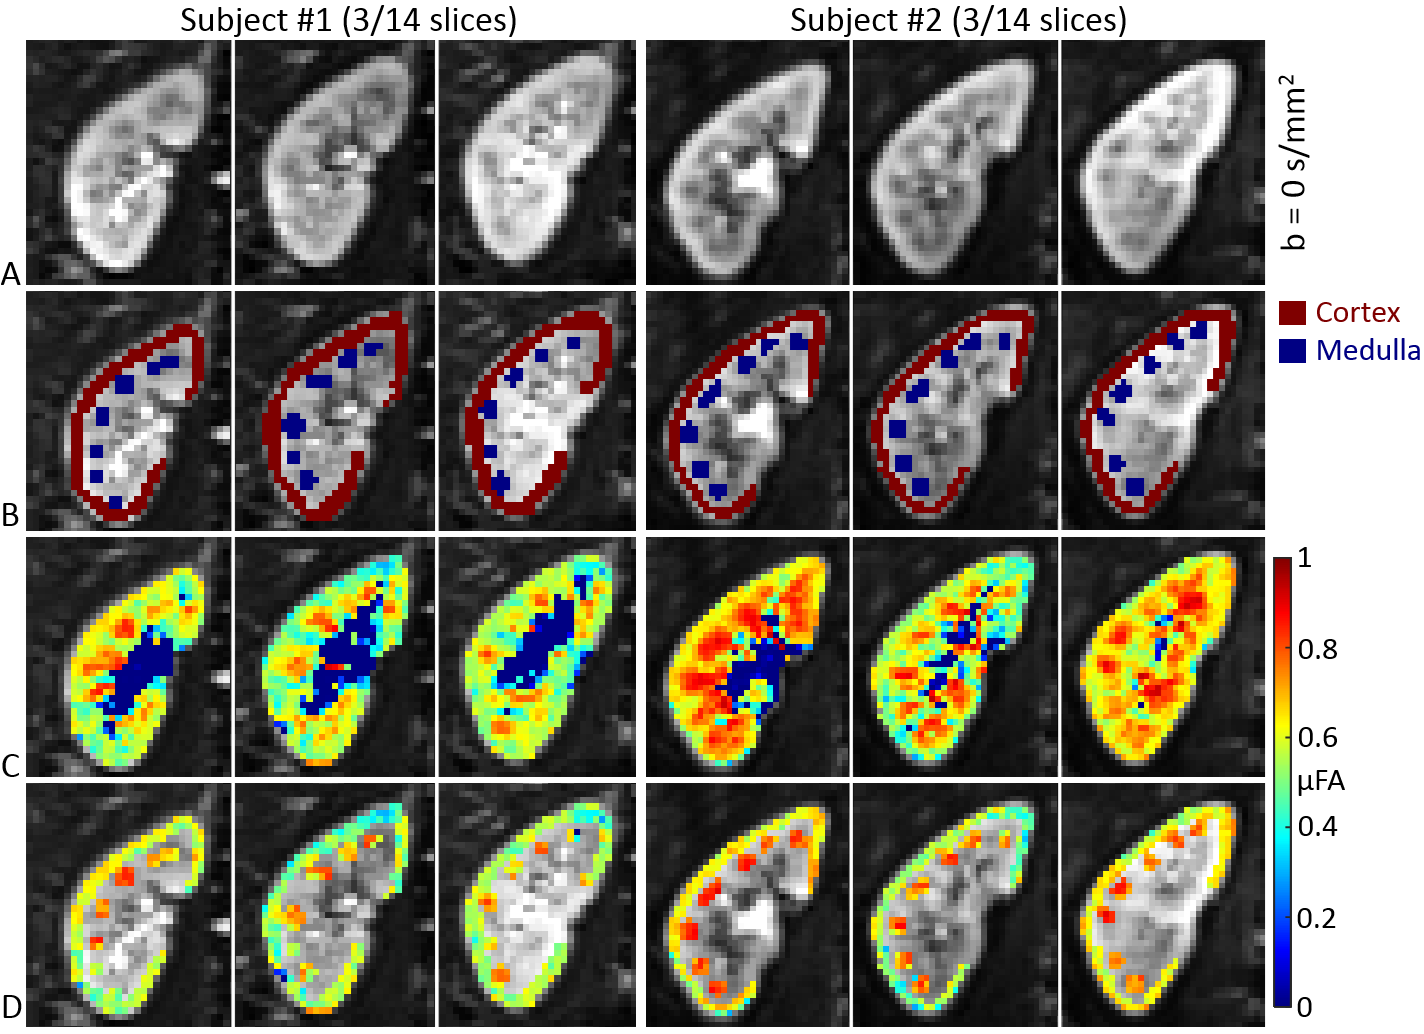
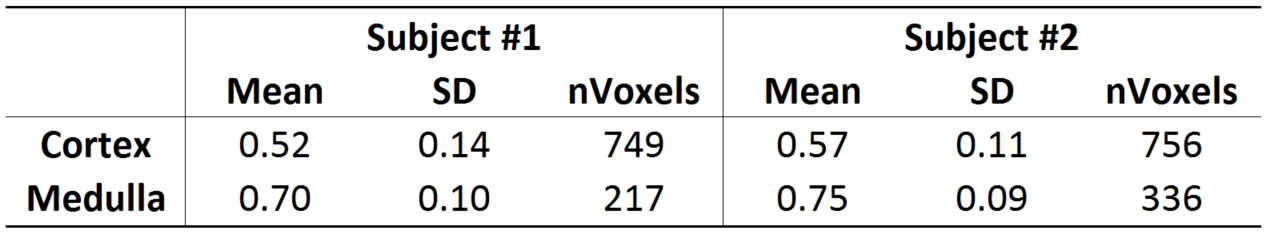
Image registration was not successful in correcting for kidney movement in three out of the five subjects. Therefore, all reported results were obtained from data where motion correction was successful (two subjects). An increase in the difference of signal intensity between conventional LTE and STE acquisitions is seen with increasing b-value (Fig. 1) demonstrating the existence of microscopic anisotropy throughout the renal parenchyma. Fig. 2 highlights this effect in the cortical region. Fig. 3 shows the calculated μFA maps in the right kidney of two subjects, in voxels corresponding to the entire kidney region (row C) and those corresponding to the cortical and medullary ROIs (row D). For subjects #1 and #2, respectively, cortical μFA was 0.52±0.14 and 0.57±0.11, whereas medullary μFA was 0.70±0.10 and 0.75±0.09. Cortical μFA was significantly lower than medullary μFA (Fig. 4).Discussion
The higher values of cortical and medullary μFA compared to traditional FA (range: 0.19-0.29 (cortex), 0.31-0.43 (medulla) [Notohamiprodjo2010], [Cutajar2011], [Chan2014]) suggest that the effect of orientation dispersion may lead to a lower FA in conventional DTI. Future work will focus on further optimization of the acquisition protocol and image processing for abdominal applications, particularly with regard to improving the robustness to motion artefacts. Furthermore, a potential limitation is that LTE and STE waveforms were not matched with respect to the diffusion time, which may cause a parameter bias [Lundell2017]. However, this will be investigated in future studies.Conclusion
We provide the first estimation for microscopic anisotropy in human kidney in vivo. Quantification of microscopic anisotropy may provide a sensitive new biomarker of renal microstructure that is not confounded by orientation dispersion. Further work is required to ascertain reproducibility and reduce sensitivity to subject movement.Acknowledgements
This study was funded by Great Ormond Street Hospital Children's Charity and supported by the National Institute for Health Research Biomedical Research Centre at Great Ormond Street Hospital for Children NHS Foundation Trust and University College London. DLT is supported by the UCL Leonard Wolfson Experimental Neurology Centre (PR/ylr/18575).References
[Sjölund2015] Sjölund, J. et al., 2015. Constrained optimization of gradient waveforms for generalized diffusion encoding. Journal of Magnetic Resonance, 261, pp.157–168.
[Szczepankiewicz2015] Szczepankiewicz, F. et al., 2015. Quantification of microscopic diffusion anisotropy disentangles effects of orientation dispersion from microstructure: Applications in healthy volunteers and in brain tumors. NeuroImage, 104, pp.241–252.
[Lasič2014] Lasič, S. et al., 2014. Microanisotropy imaging: quantification of microscopic diffusion anisotropy and orientational order parameter by diffusion MRI with magic-angle spinning of the q-vector. Frontiers in Physics, 2 (February), pp.1–14.
[Klein2010] Klein, S. et al., 2010. elastix: A Toolbox for Intensity-Based Medical Image Registration. IEEE Transactions on Medical Imaging, 29(1), pp.196–205.
[Nilsson2015] Nilsson, M. et al., 2015. Extrapolation-based references improve motion and eddy-current correction of high B-value DWI data: Application in Parkinson’s disease dementia. PLoS ONE, 10(11).
[Nilsson2017] Nilsson, M. et al., 2017. Mapping prostatic microscopic anisotropy using linear and spherical b-tensor encoding: A preliminary study. In Proceedings of the ISMRM 25th Annual Meeting & Exhibition, Honolulu, HI, USA, 4945.
[Notohamiprodjo2010] Notohamiprodjo, M. et al., 2010. Diffusion tensor imaging (DTI) of the kidney at 3 Tesla–feasibility, protocol evaluation and comparison to 1.5 Tesla. Investigative radiology, 45(5), pp.245–254.
[Cutajar2011] Cutajar, M. et al., 2011. Test-retest reliability and repeatability of renal diffusion tensor MRI in healthy subjects. European Journal of Radiology, 80(3), pp.e263–e268.
[Chan2014] Chan, R.W. et al., 2014. High-resolution diffusion tensor imaging of the human kidneys using a free-breathing, multi-slice, targeted field of view approach. NMR in Biomedicine, 27(11), pp.1300–1312.
[Lundell2017] Lundell, H. et al., 2017. Microscopic anisotropy with spectrally modulated q-space trajectory encoding. In Proceedings of the ISMRM 25th Annual Meeting & Exhibition, Honolulu, HI, USA, 1086.
Figures