5230
Prediction of Neurite Indices From Diffusion Tensor Imaging in the human cerebral cortex.1RIKEN Center for Life Science Technologies, Kobe, Japan, 2Department of Diagnostic Imaging and Nuclear Medicine, Graduate School of Medicine, Kyoto University, Kyoto, Japan, 3Human Brain Research Center, Graduate School of Medicine, Kyoto University, Kyoto, Japan
Synopsis
Recent studies suggest that Neurite Orientation Dispersion and Density Imaging (NODDI) provides valuable information about cortical neurites. However, it requires lengthy time to acquire multi-shell data of diffusion weighted imaging (DWI), as well as to calculate parameters, neurite density index (NDI) and orientation dispersion index (ODI). We propose a method to estimate cortical NDI and ODI from diffusion tensor imaging (DTI), which is based on a mathematical relationship between NODDI and DTI assuming negligible cerebrospinal fluid (CSF) in the cortex. We also show the accuracy and time for scanning and computation.
Introduction
The NODDI model1 provides valuable information that relates to neurites, myelin and geometrical arrangement in cortical myeloarchitecture.2 However, NODDI requires multi-shell DWI data and very long calculation time. Although accelerated microstructure imaging via convex optimization (AMICO)3 shortens its calculation time, it takes several tens of minutes per subject. Therefore, reduction of calculation time of NODDI and required DWI data makes it easy to handle NODDI in studies dealing with a large number of subjects. Edwards et al.4 and Lampinen et al.5 independently solved the equation of NODDI and DTI models and formulated the mathematical relationship among NDI, ODI, fractional anisotropy (FA) and mean diffusivity (MD) when the CSF compartment (viso) was negligible. In a previous study, we found that viso was negligibly small in the cerebral cortex. Here, we tested whether NODDI parameters can be accurately estimated from DTI by using the equation.Method
Model
The equations that relate NODDI to DTI models are written as follows4,5:
(1) $$$NDI=1-\sqrt{\frac{1}{2}(\frac{3MD}{d//}-1)}$$$, (2) $$$\tau=\frac{1}{3}(1+\frac{4MD\cdot{FA}}{|d//-MD|\cdot{\sqrt{3-2FA^{2}}}})$$$
, where “d//” is a constant for intrinsic diffusivity assumed in the NODDI model. Orientation dispersion index is calculated using following formulas:
(3) $$$\tau=\frac{1}{\sqrt{\pi\kappa}\exp(-\kappa)erfi(\sqrt{\kappa})}-\frac{1}{2\kappa}$$$, (4) $$$ODI=\frac{2}{\pi}\arctan(\frac{1}{\kappa})$$$
, where “erfi” is error function and “arctan” is arctangent.
Diffusion data and analysis
We used 90 healthy subjects from the publicly available human connectome project (HCP) dataset, including high-resolution structural images (0.7-mm isotropic T1w and T2w images) and DWI data (1.25-mm isotropic resolution).6 The DWI data included 270 volumes with 90 volumes for each of the three shells of b-values (b=1000, 2000 and 3000 s/mm2) in addition to 18 non-diffusion weighted (b=0 s/mm2) volumes, from which five simulated datasets of DWI data were derived as a single-shell type; Dataset(b1000): b=0,1000, Dataset(b2000): b=0,2000, Dataset(b3000): b=0,3000, and mult-shell type: Dataset(b1000-2000): b=0,1000,2000, Dataset(bAll): b=0,1000,2000,3000. Each dataset was fitted to DTI and resultant MD and FA were mapped onto the cortical surface. Then NDI was estimated from MD using formula (1) (NDIDTI), and ODI was estimated using formula (2) to (4) and a look-up-table for k (ODIDTI). The original NODDI model was also applied using AMICO and the optimized value of d// for cerebral cortex2 to calculate NDI and ODI (NDIORIG and ODIORIG), as well as viso. The surface mapping was performed using an algorithm weighted towards the cortical mid-thickness7. Surface maps (NDIORIG, ODIORIG, viso, NDIDTI and ODIDTI) were averaged across subjects and parcellated according to HCP’s multi-modal parcellation (HCP_MMP1.0 210P MPM version)8. The mean values for each of the 180 parcels/hemisphere were calculated and analyzed for correlations between two methods of NODDI calculations. Values of the original NODDI calculation using Dataset(bAll) (NDIORIG and ODIORIG) were considered to be ‘true’ values as a reference.
Results
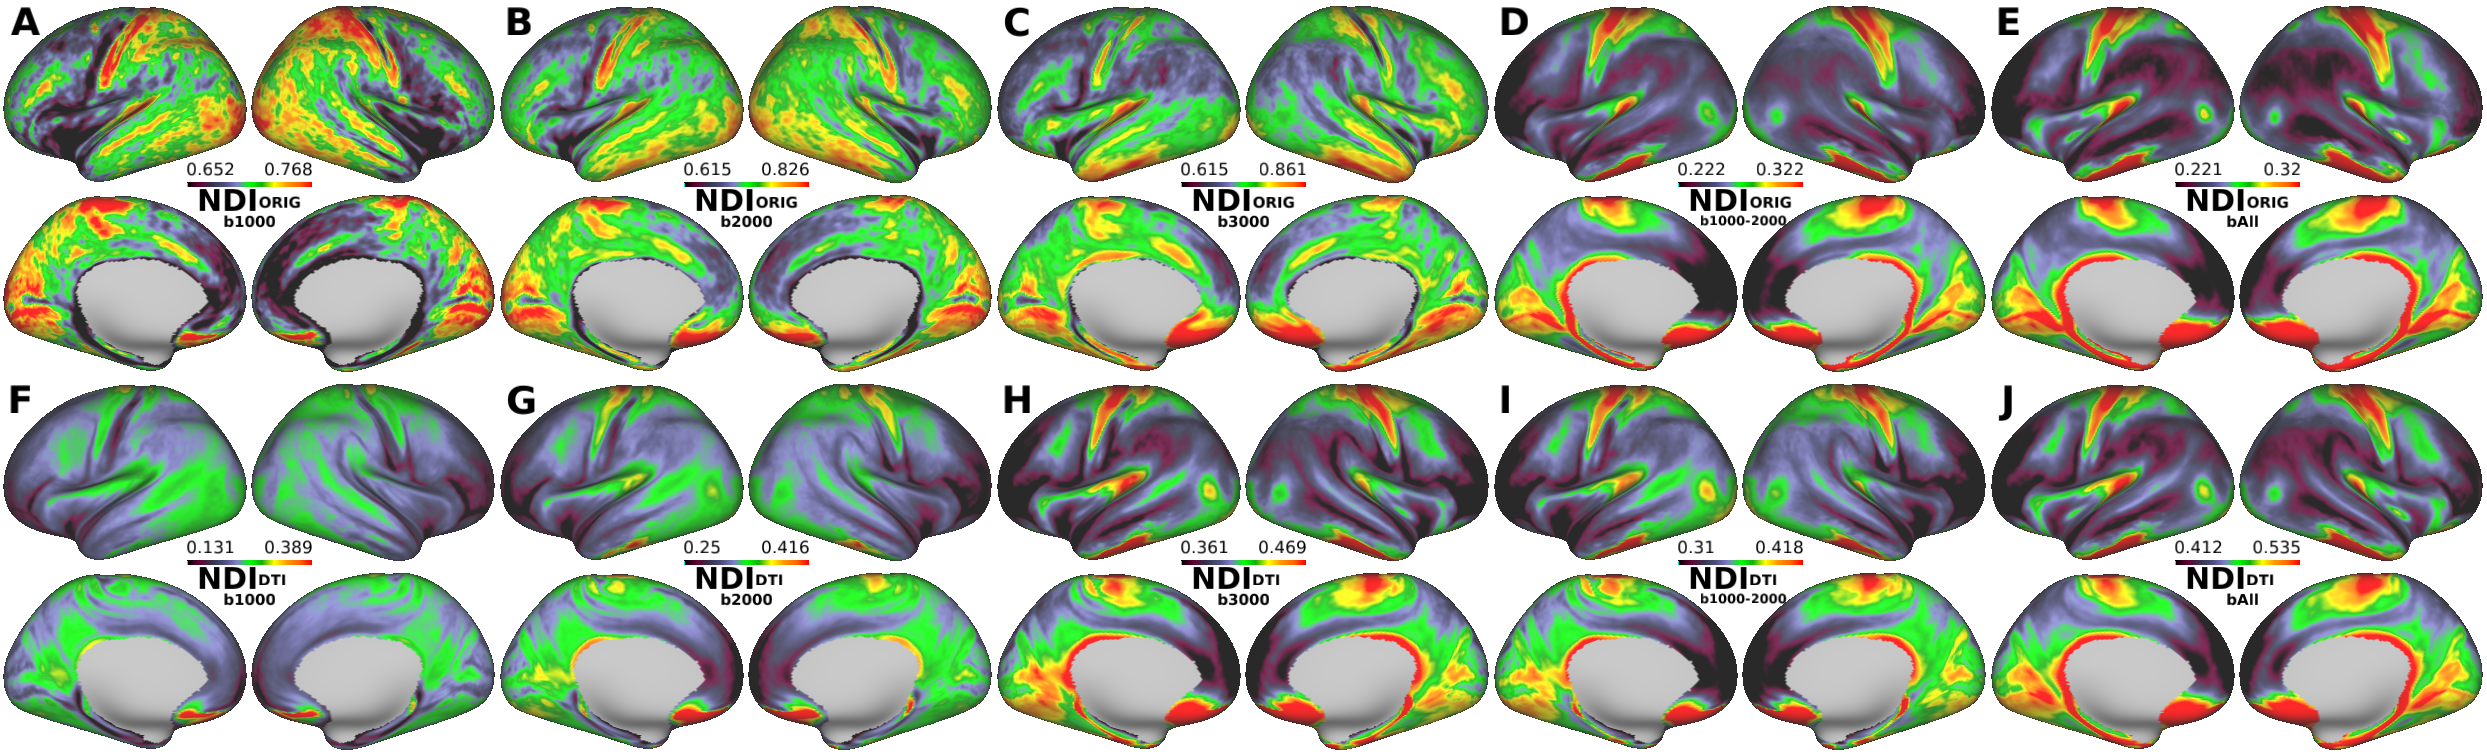
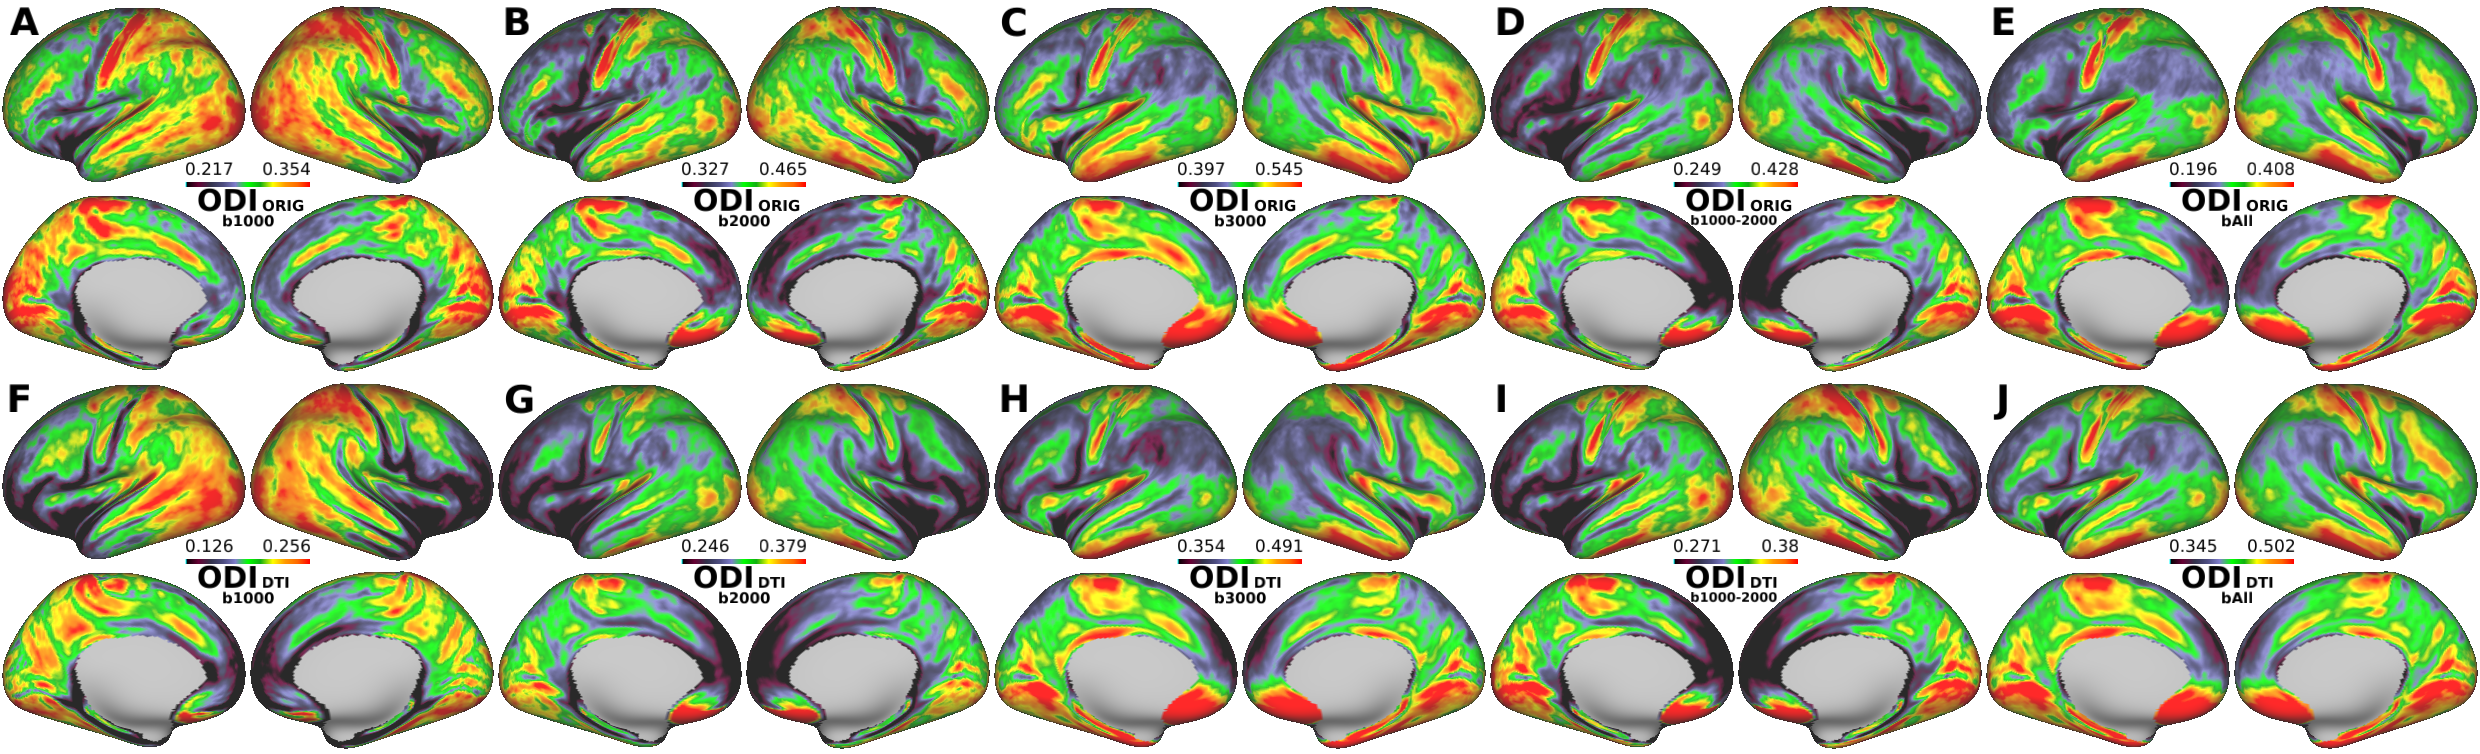
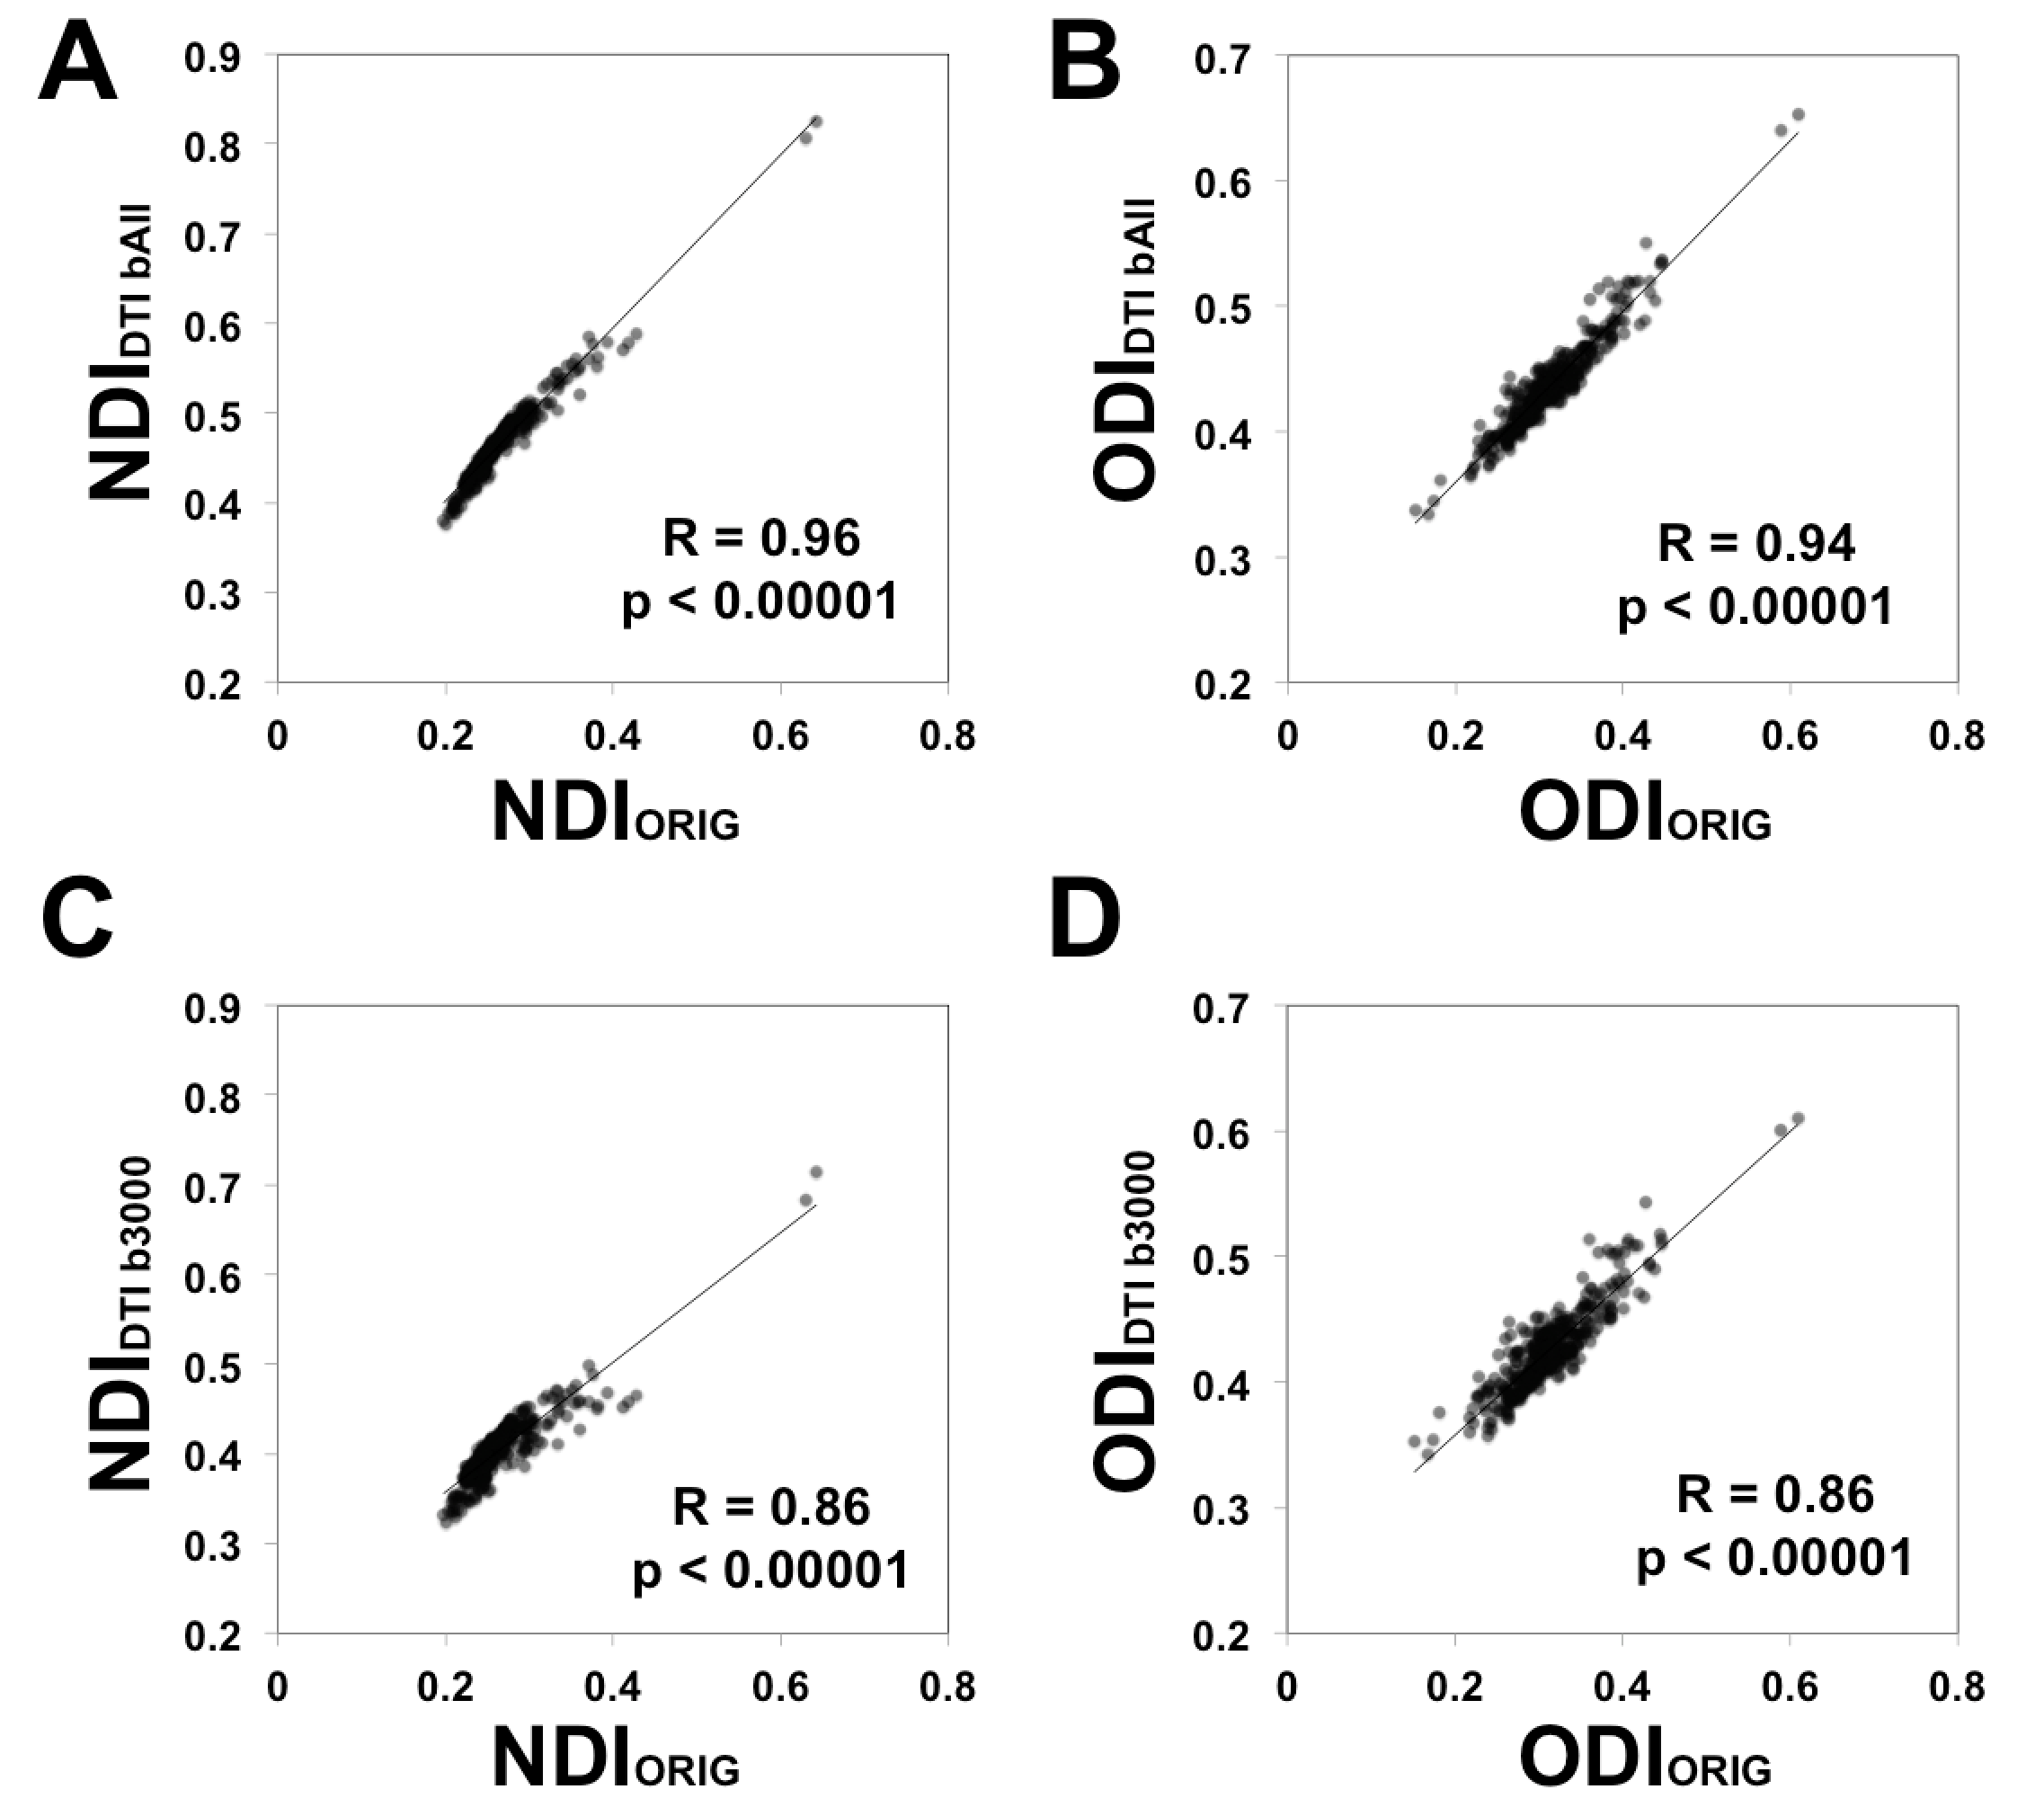
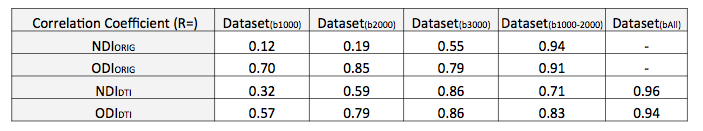
The average surface maps of NDIORIG, ODIORIG, NDIDTI, and ODIDTI in each dataset are shown in Fig.1 and 2. NDIDTI and ODIDTI calculated with all three-shell data (Dataset(bAll)) showed a very similar distribution with the reference maps NDIORIG and ODIORIG, respectively (Fig.1-E,J, Fig.2-E,J). The correlation coefficients were extremely high (NDI:R=0.96, ODI:0.94) (Table1, Fig3-A,B). Further, each NDIDTI and ODIDTI using Dataset(b3000) showed a similar distribution to the reference, and their correlations were very high (NDI:R=0.86, ODI:R=0.86) (Table1, Fig.1-E,H, Fig2-E,H, Fig3-C,D). However, NDIDTI and ODIDTI using Dataset(b1000), Dataset(b2000) and Dataset(b1000-2000), which did not include high b-value (b3000), did not highly correlate with the references (Table1, Fig1-E,F,G,I). NDIORIG using a single-shell type dataset did not highly correlate with the reference (Table1, Fig1-A,B,C,E), although both NDIORIG and ODIORIG using Dataset(b1000-2000) showed a very similar distribution with the reference and their correlations were extremely high (NDI:R=0.94, ODI:0.91) (Table1, Fig.1-D,E, Fig.2-D,E). Mean of CSF compartment (viso) in the cerebral cortex was 0.096. The calculation time of DTI-based estimation of NODDI parameters was less than one minute per dataset.Discussion
We found that cortical neurite indices of NODDI can be accurately predicted based on mathematical derivation from DTI when multi-shell data were used. The calculation time was drastically reduced to less than one minute, as compared to over hours in the original NODDI calculation. Moreover, accurate DTI-based NODDI estimation was also achieved even using single-shell DWI data with high b-value (i.e. b=3000), thus eliminating the need for lengthy multi-shell scans commonly done in NODDI. In contrast, DTI-based NODDI estimation using low b-value data was degraded in accuracy, suggesting that signals from CSF are not as negligible in low b-value data, thus violating the assumption in the model. Future algorithms should address correction of b-values and b-vectors for gradient non-linearity.Conclusion
The DTI-based NODDI estimation in the cerebral cortex allows economic and accurate estimation of neurite indices.Acknowledgements
The data of this study was provided by the Human Connectome Project, WU-Minn Consortium (Principal Investigators: David Van Essen and Kamil Ugurbil; 1U54MH091657) funded by the 16 NIH Institutes and Centers that support the NIH Blueprint for Neuroscience Research; and by the McDonnell Center for Systems Neuroscience at Washington University.References
1. Zhang, H., Schneider, T., Wheeler-Kingshott, C. A. & Alexander, D. C. NODDI: Practical in vivo neurite orientation dispersion and density imaging of the human brain. NeuroImage 61, 1000–1016 (2012).
2. Fukutomi, H. et al. Neurite properties revealed by in vivo diffusion MRI in human cerebral cortex. at OHBM in Vancouver (2017).
3. Daducci, A. et al. Accelerated Microstructure Imaging via Convex Optimization (AMICO) from diffusion MRI data. NeuroImage 105, 32–44 (2015).
4. Edwards, L. J., Pine, K. J., Weiskopf, N. & Mohammadi, S. NODDI-DTI: extracting neurite orientation and dispersion parameters from a diffusion tensor. bioRxiv 77099 (2017). doi:10.1101/077099
5. Lampinen, B. et al. Neurite density imaging versus imaging of microscopic anisotropy in diffusion MRI: A model comparison using spherical tensor encoding. NeuroImage 147, 517–531 (2017).
6. Van Essen, D. C. et al. The WU-Minn Human Connectome Project: An overview. NeuroImage 80, 62–79 (2013).
7. Glasser, M. F. & Van Essen, D. C. Mapping human cortical areas in vivo based on myelin content as revealed by T1- and T2-weighted MRI. J. Neurosci. Off. J. Soc. Neurosci. 31, 11597–11616 (2011).
8. Glasser, M. F. et al. A multi-modal parcellation of human cerebral cortex. Nature 536, 171–178 (2016).
Figures