5228
Advanced quantification of dispersion and directionality in three-dimensional electron microscopy images and diffusion MR imaging of injured rat brain1A. I. Virtanen Institute for Molecular Sciences, University of Eastern Finland, Kuopio, Finland, 2Institute of Biotechnology, University of Helsinki, Helsinki, Finland
Synopsis
The relationship between orientation distribution functions (ODFs) from advanced dMRI and the real tissue microstructure is under active research. We utilized three-dimensional (3D) serial block-face scanning electron microscopy in the corpus callosum and cingulum, and implemented 3D structure tensor (ST) analysis to produce ODFs comparable to dMRI ODFs from the same locations. The ODFs were parametrized using Watson distribution. Our results showed a clear correspondence in orientation estimates, but dispersion estimates were not as clearly correlated. ST analysis combined with 3D SBEM has great potential to unveil the complexity of the underlying microstructure in biological tissues.
Introduction
Advanced diffusion
magnetic resonance imaging (dMRI) methods, such as high-angular resolution
diffusion imaging (HARDI) go beyond the classical diffusion tensor model. HARDI
tools can provide complex orientation distribution functions (ODF) corresponding
with microstructural information within the voxel. The relationship between these
ODF estimates to the actual microstructure in the tissue is under active
research. In this study, we utilized serial block-face scanning electron
microscopy (SBEM) images to implement 3D structure tensor (ST) analysis1
and compared the analysis results to generalized q-sampling imaging2
(GQI) results.Materials and methods
Severe lateral fluid percussion injury was performed on one male adult Sprague-Dawley rat. One sham-operated rat was used as a control. TBI model was used to ensure robust, detectable microstructural changes in the brain tissue.
The brains were perfused with 4% paraformaldehyde 5 months after TBI and scanned ex vivo with 9.4 T Agilent scanner using segmented 3D spin-echo EPI (TR=1 s; TE=35 ms; matrix = [128 96 96]; resolution: 0.15x0.15x0.15 mm3; b-values=2000 s/mm2, 3000 s/mm2, and 4000 s/mm2). The acquisition comprised of three sets of 42 uniformly distributed directions with diffusion weighting and three images without. The water diffusion ODFs were estimated using generalized q-sampling imaging of DSI studio (http://dsi-studio.labsolver.org).
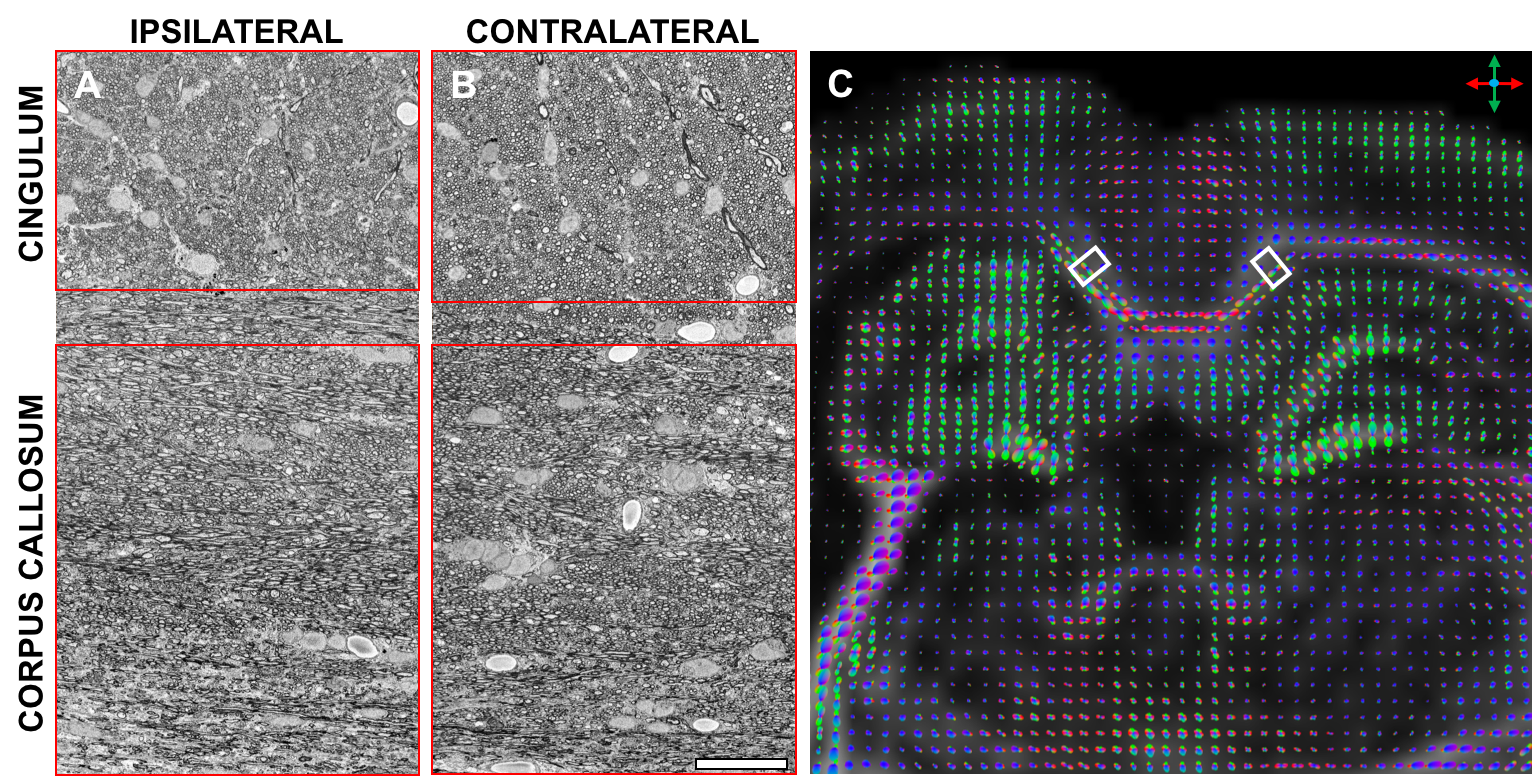
After ex vivo imaging, the brains were sectioned and processed for EM. SBEM imaging was performed on ipsi- and contralateral samples from the corpus callosum and cingulum from both sham-operated and TBI animals (Fig. 1A and B). SBEM blocks were 200x100x50-75 μm3 with a resolution of 50x50x50 nm3 (4096x2048x1000-1250 voxels). After imaging, the blocks were divided into two volumes of interest (VOIs) for analysis, the corpus callosum VOI (2400x2000x1000-1250 voxels) and cingulum VOI (1050-1200x2000x1000-1250 voxels).
The SBEM blocks were co-registered to dMRI data to compare ST analysis parameters and corresponding QBI parameters in the same voxels. The SBEM stacks were localized on 1-mm thick photomicrograph images using stained semi-thin histological sections and anatomical landmarks. The dMRI images were manually co-registered to the photomicrograph using translations, rotations, and non-uniform voxel scaling using Amira (version 5.6.0; FEI Co., USA). The locations of the SBEM blocks in the GQI images are shown in Fig. 1C.
ST analysis was used to produce ODFs from the SBEM VOIs. In order to decrease memory use, each VOI was divided into several smaller VOIs of 290x290x290 voxels. Intensity gradients were computed for each voxel and summed within a 19x19x19 voxel neighbourhood to produce a structure tensor. The 3rd eigenvectors, representing water diffusion orientations, formed the ODF for the small VOIs. Finally, the small VOI ODFs were concatenated into a large VOI ODF.
The ODFs from both ST and GQI were parametrized with Watson distribution,
$$W_p(x;\mu,\kappa) = c_p(\kappa)e^{\kappa(\mu^Tx)^2},$$
where cp is a normalizing constant. The concentration parameter κ, representing dispersion, and mean orientation vector μ were extracted for comparison.
Results
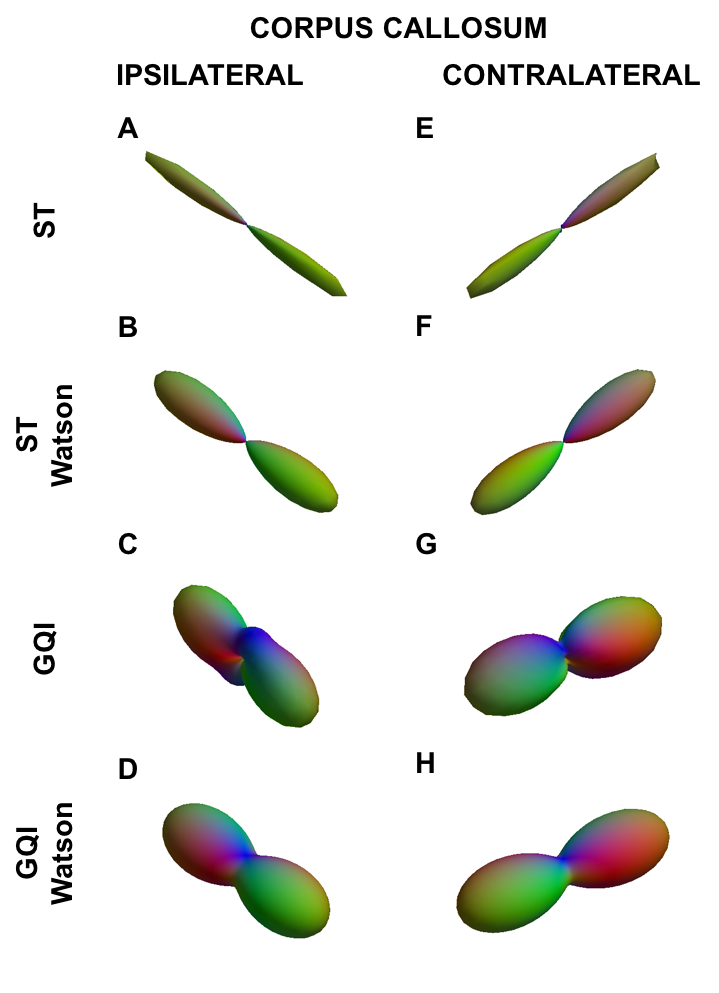
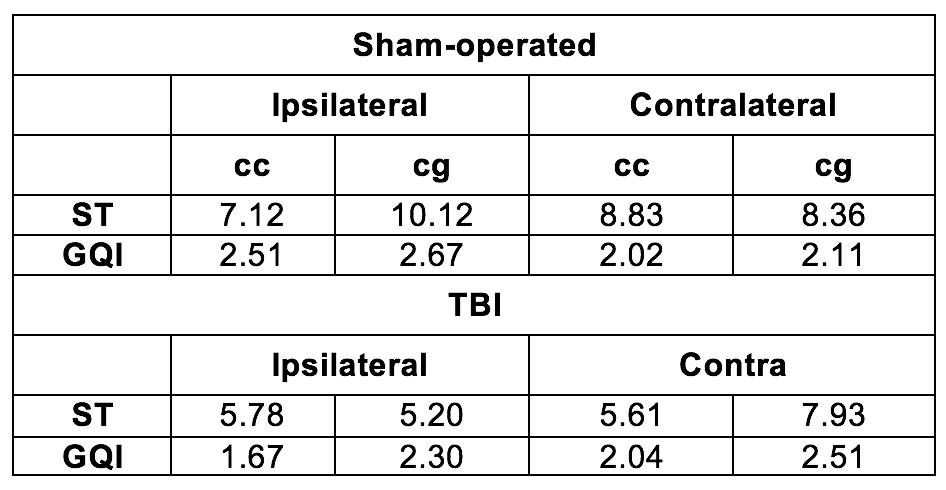
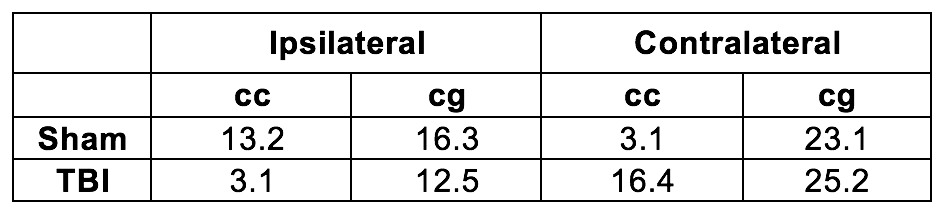
ODF estimates from ST and GQI from the corpus callosum of the TBI rat, along with their Watson parametrizations, are shown in Fig 2. ST ODFs were long and thin (Fig. 2A and 2E), whereas GQI ODFs were thicker (Fig. 2C and 2G) than ST ODFs. Watson parametrization captured the GQI ODF features reliably (Fig. 2D and 2H), whereas the parametrizations were not as thin (Fig. 2B and 2F) as the ST ODFs. Table 1 summarizes the dispersion values from the ipsi- and contralateral corpus callosum and cingulum of both rats. In the ST analysis, κ was consistently lower in the TBI samples compared to the sham-operated samples (Table 1), indicative of trauma-induced changes, such as loss and/or damage of axons. A similar pattern appeared in the ipsilateral corpus callosum and cingulum in GQI κ (Table 1). The chosen locations represented areas with one clearly dominant orientation of microstructure in form of myelinated axons. The orientations from the different methods matched well to each other. The angular difference varied between 3.1° and 25.2° (Table 2).Discussion
This study demonstrates that ST-ODFs can produce dispersion and orientation from 3D SBEM blocks. These parameters can be compared to GQI parameters from the dMRI data with success.
The structure tensor distributions were very thin, apparently only reflecting orientations along the axons, not all potential orientations of water diffusion. In addition, the Watson distribution did not fully capture this thinness, potentially due to issues with distribution fitting.
In the future, we will add more samples with more heterogeneous microstructural environment, such as cortex. Furthermore, adding such samples makes fitting mixtures of Watson distributions essential.
Conclusions
Structure tensor analysis combined with 3D SBEM methodology has great potential in unravelling the complex microstructures present in biological tissue.Acknowledgements
This work was supported by the Academy of Finland.References
1. Budde MD, Frank JA. Examining brain microstructure using structure tensor analysis of histological sections. Neuroimage. 2012 Oct 15;63(1):1-0.
2. Yeh FC, Wedeen VJ, Tseng WY. Generalized q-Sampling Imaging. IEEE transactions on medical imaging. 2010 Sep;29(9):1626-35.
Figures