5222
Reducing Tractogram Endpoint Biases with Surface-Enhanced Tractography1Sherbrooke Connectivity Imaging Lab (SCIL), Université de Sherbrooke, Sherbrooke, QC, Canada
Synopsis
In this work, we highlight the importance and advantages of integrating cortical surfaces with dMRI tractography. Doing so facilitates the integration of gray matter (GM) features in white matter (WM) connectivity analysis. Extending streamlines to cortical meshes allows the study of WM structural features from tractography along the cortex. This combined approach also enables the measurement of streamline connections cortical coverage and density bias with different tractography algorithms.
Introduction
Conventional dMRI tractography methods estimate fiber directions for each voxel from a dMRI acquisition and then use a fiber tracking algorithm to reconstruct WM pathways. However, due to the low spatial resolution of dMRI (approximately 2mm isotropic), tractography techniques have difficulty reconstructing WM fiber structures near the cortex, and in particular, have trouble penetrating and fully extending throughout each gyrus1,2. Hence, the main limitation of current tractography techniques near the cortex is caused by partial volume effects (PVE), which arise from poor spatial resolution of the dMRI data, discretization and coarse tracking mask in gyri. These limitations reduce the WM-GM interface coverage of streamline endpoints. The low surface coverage combined with this gyral bias increase the variability of tractograms and connectivity matrices.
A surface-enhanced tractography (SET)3 was recently proposed to initialize and terminate tractography at cortical surfaces, extracted from the T1 image (1mm isotropic). To reduce dMRI PVE and improve tractography, this method incorporates anatomical priors based on the geometry of the cortex4,5, combining dMRI tractography with a mass-stiffness flow6 (see Figure #1). Similarly to Cottaar et al.7, the flow trajectory better models the fiber fanning structures near the cortex and helps tractography streamlines reach GM.
Data
We use a test-retest dataset (11 subjects, 3 acquisitions each) for our experiments. For each subject, one streamline per mesh vertex was generated (~250k seeds) with different tractography methods: local tractography from Dipy (LT)8 or particle filter tractography (PFT)9, with and without surface-enhancement (SET)3.Methods
To estimate potential biases, such as the gyral bias1,2, we studied tractogram endpoints along the WM-GM interface. Surface measurements, alongside tractogram connections (streamlines that end in GM), were employed to compare tractography algorithms. These measurements include the tractogram cortical coverage, the amount of connections at each vertex and the mean-curvature on the surface at those vertices. Tractography was initialized and terminated from cortical surfaces, to equally compare all methods. Features extracted from tractograms were then projected to the cortical mesh vertices, based on streamline endpoints. With the surface-enhanced approach, the mass-stiffness flow trajectory was used to initialize and back-project dMRI tractography (LT or PFT) over the extracted meshes.Results
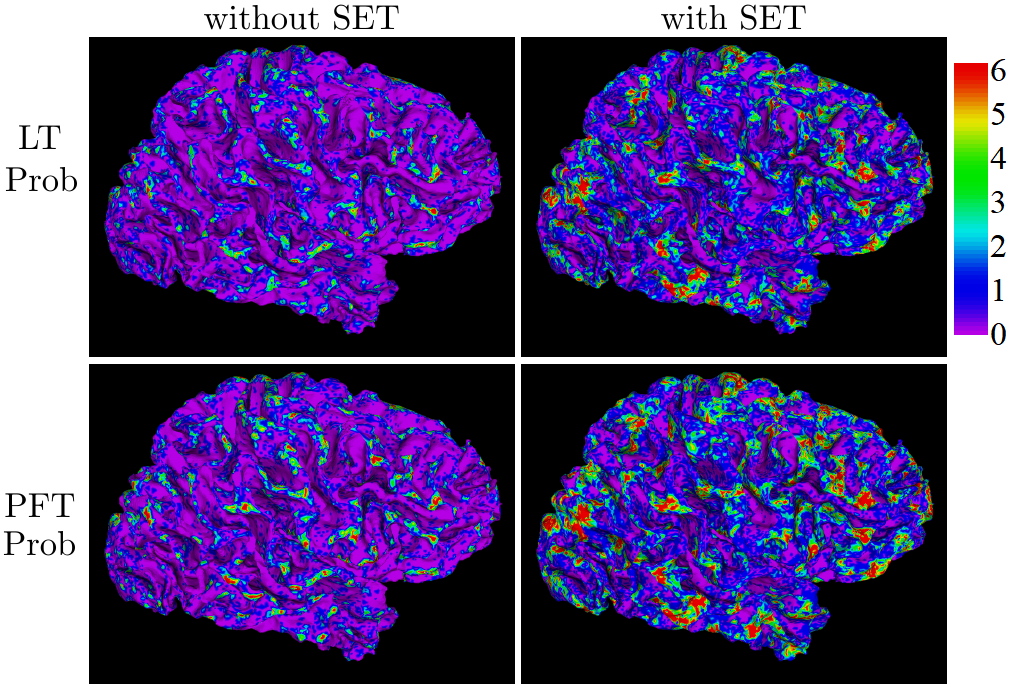
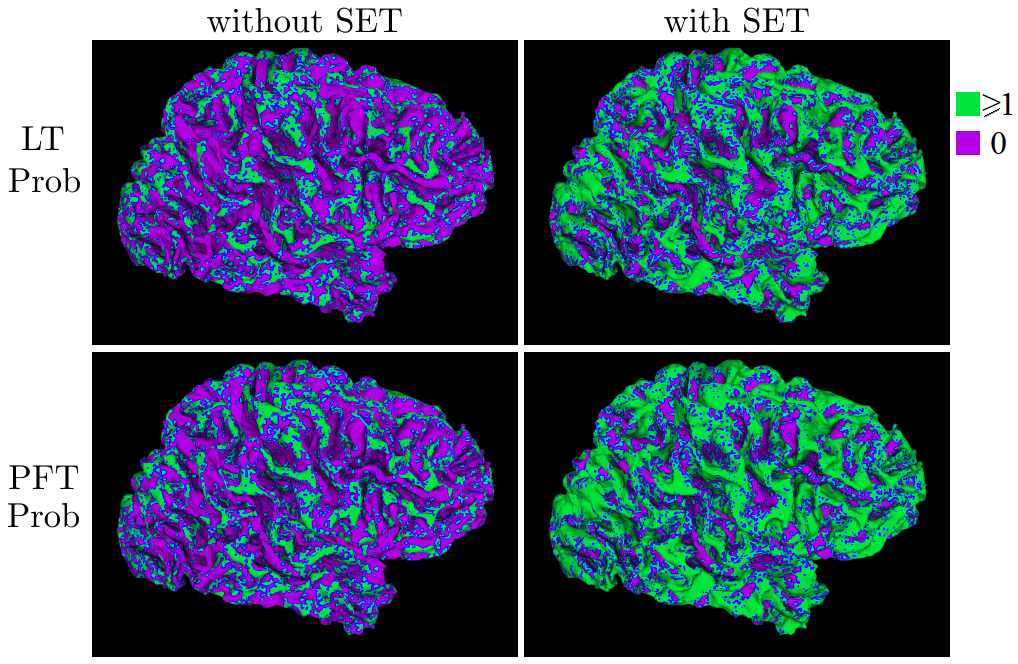
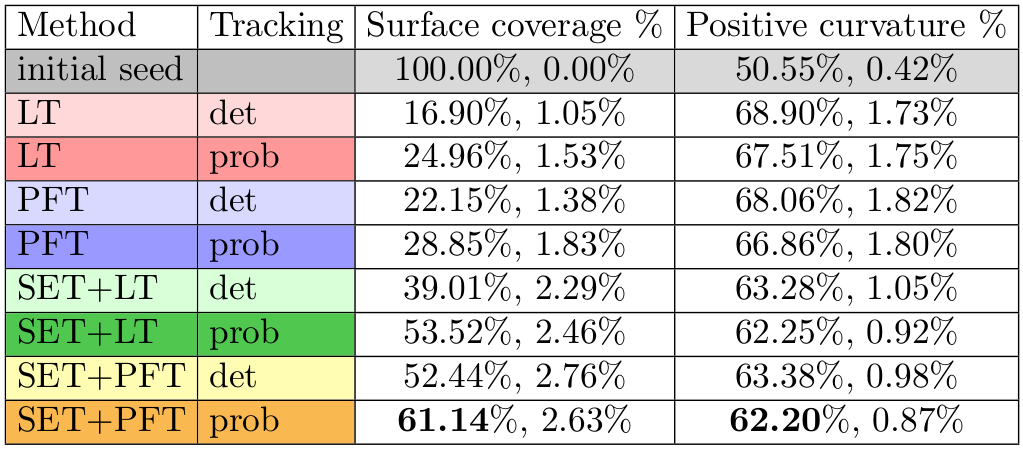
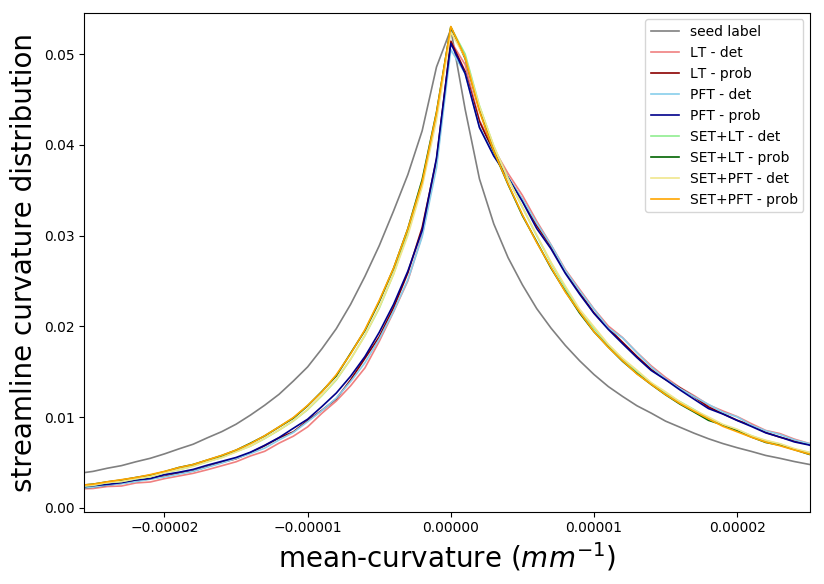
Figures #2 and #3 show the number of streamlines intersecting distinct mesh triangles for different tractography approaches. As seen in both figures, for all methods, streamline endpoints do not cover the whole cortex and tend to end in gyri crowns. However, when using SET, a more complete GM coverage from streamline endpoints is observed. Quantitative results, in Table #1, show the average percentage of surface coverage and the percentage of endpoints with positive curvature (ending in gyri crowns). For the same amount of seeds, SET doubles the percentage of GM coverage and significantly reduces the positive curvature bias. Figure #4 presents the streamline endpoints distribution, showing the gyral bias, with positive curvature skewness. In addition to presented results, SET reduces the amount of invalid streamlines by 12% (tracts that do not reach GM regions). It decreases the number of streamlines under 10mm (the standard tractography minimum length threshold) and increases the average streamline length. The proposed method is more reproducible with connectivity matrices variability analysis: it reduces the intra-subject distance by 20% and increases the inter/intra ratio from 1.63 to 1.95.Discussion
Utilizing mesh surfaces with priors does not only improve masking precision, it also facilitates the projection of WM features onto the cortex. Modelled by a mass-stiffness flow, the proposed surface-enhanced tractography improves reconstruction near the cortex without the need for high resolution dMRI acquisitions or sophisticated hardware. This method also significantly improves the surface coverage and reduces the gyral bias. However, there is still room for improvement and, even when seeding from the whole surface, streamlines finish more often in gyri (62%) than in sulci (38%) and 39% of the cortex is left without connections. Thus, it is important to reduce the effect of streamline endpoint bias and validate results, with test-retest variability, before performing connectomic analysis. To refine the proposed method, cortical surface local features such as area, thickness and volume, among others, could be included with an adaptive seeding strategy to fill GM regions with no endpoints. Techniques similar to SET have been proposed recently to improve tractography by combining cortex information with dMRI10,11.Conclusion
Integrating geometrical priors based on the cortex structure significantly improves tractography endpoints connectivity, i.e. percentage of surface coverage and the percentage of endpoints with positive curvature. SET also noticeably decreases the test-retest variability and the number of invalid streamlines. Furthermore, using cortical surfaces for both WM and GM metrics has potential for connectomics, where covering the whole cortex with minimal bias is crucial to reducing variability.Acknowledgements
Special thanks to Noor Al-Sharif for her help and insights. Acknowledgements to FRQNT, NSERC and CREATE-MIA program for research founding. Thanks to M. Chamberland, K. Whittingstall and the Sherbrooke Molecular Imaging Center (CIMS) for the MR images.References
[1] Reveley, C., Seth, A.K., Pierpaoli, C., Silva, A.C., Yu, D., Saunders, R.C., Leopold, D.A., Frank, Q.Y., 2015. Superficial white matter fiber systems impede detection of long-range cortical connections in diffusion mr tractography. Proceedings of the National Academy of Sciences.
[2] Van Essen, D.C., Jbabdi, S., Sotiropoulos, S., Chen, C., Dikranian, K., Coalson, T., Harwell, J., Behrens, T., Glasser, M.F., 2013a. Mapping connections in humans and non-human primates: Aspirations and challenges for diffusion imaging. Diffusion MRI, 2nd: From Quantitative Measurement to In vivo Neuroanatomy. Academic Press San Diego.
[3] St-Onge, E., Girard, G., Whittingstall, K., Descoteaux, M., 2015. Surface tracking from the cortical mesh complements diffusion mri fiber tracking near the cortex. ISMRM.
[4] Tallinen, T., Chung, J.Y., Rousseau, F., Girard, N., Lefèvre, J., Mahadevan, L., 2016. On the growth and form of cortical convolutions. Nature Physics.
[5] Waehnert, M., Dinse, J., Weiß, M., Streicher, M., Waehnert, P., Geyer, S., Turner, R., Bazin, P.L., 2014. Anatomically motivated modeling of cortical laminae. Neuroimage.
[6] Kazhdan, M., Solomon, J., Ben-Chen, M., 2012. Can mean-curvature flow be modified to be non-singular?, in: Computer Graphics Forum, Wiley Online Library.
[7] Cottaar M., Bastiani M. , Chen C., Krikor Dikranian K., Van Essen D., Behrens T., Sotiropoulos S., and Saad Jbabdi S., 2016. Fibers crossing the white/gray matter boundary: a semi-global, histology-informed dMRI model, ISMRM.
[8] Dipy, Diffusion Imaging in Python - Neuroimaging in Python. URL: http://nipy.org/dipy/.
[9] Girard, G., Whittingstall, K., Deriche, R., Descoteaux, M., 2014. Towards quantitative connectivity analysis: reducing tractography biases. Neuroimage.
[10] Yeh, C.H., E Smith, R., Dhollander, T., Connelly, A., 2017. Mesh-based anatomically-constrained tractography for effective tracking termination and structural connectome construction, ISMRM.
[11] Teillac, A., Beaujoin, J., Poupon, F., Mangin, J.F., Poupon, C., 2017. A novel anatomically-constrained global tractography approach to monitor sharp turns in gyri. MICCAI, Springer.
Figures