5221
Decomposition of brain structural connectivity using Independent component analysis1Biomedical Engineering, Amirkabir University of Technology (Tehran Polytechnic), Tehran, Iran (Islamic Republic of), 2Department of Radiology, University Hospital Center and University of Lausanne, Lausanne, Switzerland, 3School of Cognitive Sciences, Institute for Research in Fundamental Sciences (IPM), Tehran, Iran (Islamic Republic of)
Synopsis
Diffusion imaging provides the capability of investigating brain white matter non-invasively. There is an increasing interest in studying whole brain structural connectivity (SC) as a complex network, but examining multiple structural sub-networks has yet to be investigated. In this study we have proposed a specific pipeline to decompose whole brain structural connectivity into different sub-networks using Independent Component Analysis (ICA). Obtaining two structural gender related sub-networks in line with previous findings confirms the feasibility of the approach.
Introduction
Diffusion MR imaging has been widely accepted as a powerful tool to investigate brain structural connectivity. Literature has shown significant tract-wise variation related to subject’s information such as age, gender etc. or specific disorders (disease). However, investigation of SC from sub-network viewpoint has not been studies. Correlation of SC and FC raises the question of whether functional similarity of tracts can lead to decomposition of SC into sub-networks as well. Recently voxel-based ICA approach for diffusion features such as Fractional Anisotropy (FA) has been proposed1,2 and the findings open the way of thinking for explaining the interpersonal variations of the brains structures through the existence of multiple independent sub-networks. Here, to decompose brain SC into multiple sub-networks, we used ICA in a new application. We also examined gender relation of weights for the selected edges in the components.Method
Ninety two healthy subjects (aged 29.8 ± 9.8, 55 males) were included in this study. Two types of MR images including Diffusion Spectrum Imaging (DSI) and T1-weighted (MP-RAGE) were acquired from each participant using 32-channel head coil on 3T Siemens scanner. The MPRAGE volume of each subject was segmented to 129 cortical and subcortical regions of interest using Freesurfer software version 5.0.0. Subcortical regions and the brain stem were excluded from further analysis. After reconstruction of orientation distribution function (ODF)3, deterministic tractography was performed. Linear registration of parcellated anatomical image to the diffusion space (b0) is applied to define 129 regions. Structural connectivity matrix was constructed based on fiber density between each pair of regions4. For each subject, lower triangular part of SC was vectorized and then all SC vectors were stacked to form a SC matrix for all subjects. After performing Principal Component Analysis (PCA) for dimension reduction, Independent Component Analysis (ICA) based on Infomax algorithm5 was applied on the matrix. Since ICA has no standard approach for ordering components, , RAICAR (Ranking and averaging independent component analysis by reproducibility) algorithm6 was used to identify reproducible components among 100 different runs. All components were normalized to z-score row-wise and a threshold based on 75% of confidence interval was applied to define significant edges. Individual adjacency matrices were linearly regressed on the obtained components according to the following formula. The regression coefficients, which is called usage strength (Beta weights) of each component, was compared between male and female by 1000 permutation test.
$$Y(Individual Adjacency Matrix)_{(\sharp edge \times 1) }=X (selected ICs)_{(\sharp edges \times \sharp components) }* Beta Weights _{(\sharp components \times 1) }+ Error$$
Results
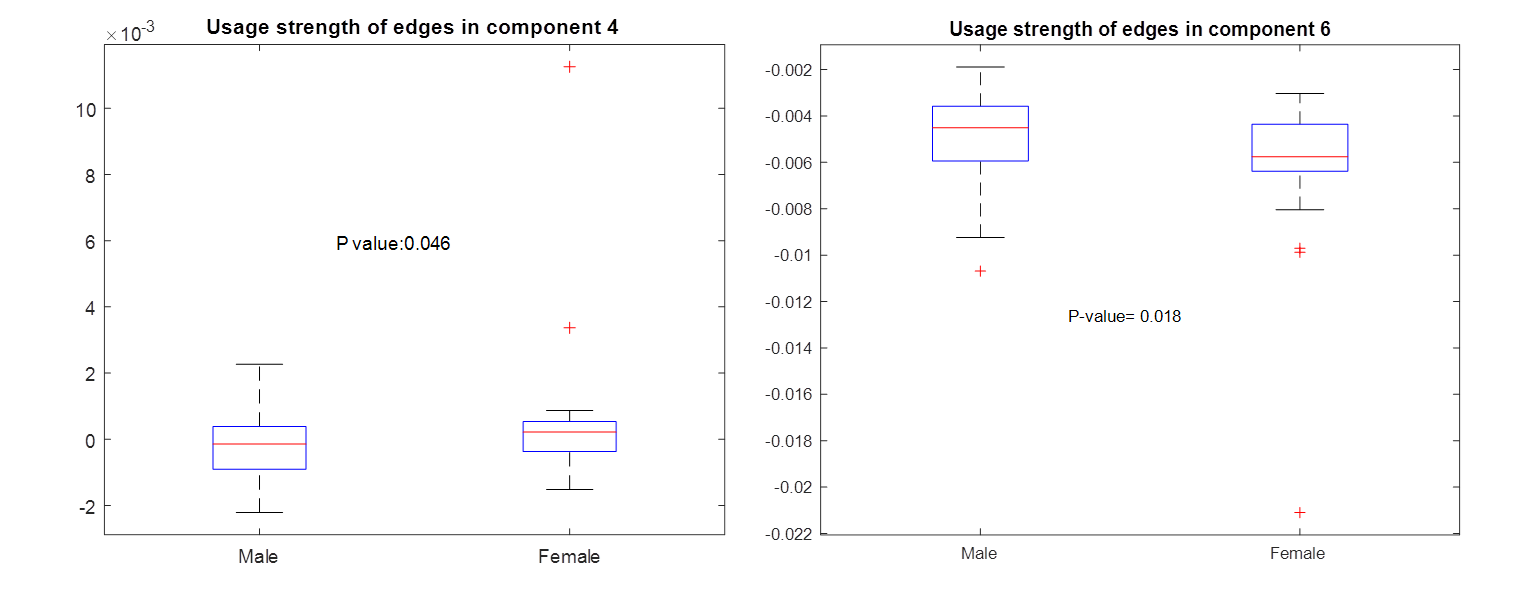
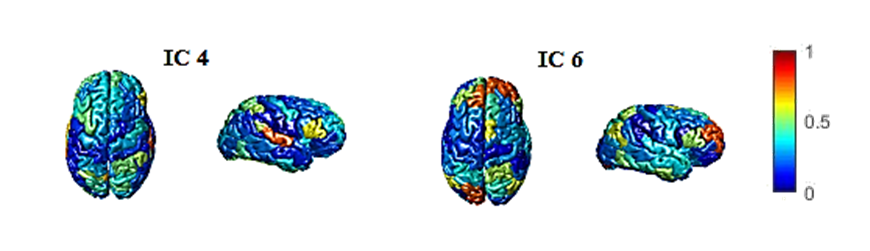
From 8 obtained components, usage strength of two components was significantly different between men and women. Statistical comparison of these components is depicted in Fig. 1. The usage strength of selected edges in IC4 is greater for females. However, in IC6, females have smaller usage strength compared to males. The ratio of selected edges to the total number of edges was also calculated for inter and intra-hemispheric areas separately. 67% of intra-hemispheric and 69% of inter-hemispheric edges was selected in IC4. These two values are 17% and 13% in IC6 respectively. These results can also be understood from Fig 2 which is surface color coded map of obtained components. From the usage-strength and the contribution of edges in IC4 and IC6, it can be inferred that males have higher connectivity of intra-hemispheric edges compared to women. This finding is in agreement with previous studies confirming higher connectivity for male in intra-hemispheric connections7.Discussion and Conclusion
In this study, we have introduced an approach based on ICA to decompose structural connectivity into multiple sub-networks. Using the proposed pipeline, two sub-networks were obtained with significant differences of usage strength between males and females. The percentage of inter and intra-hemispheric edges in these components has also confirmed higher intra-hemispheric connections in males. The finding delineates the capability of this approach to investigate meaningful structural sub-networks. Segregation of brain SC into sub-networks may lead to further understanding of brain structural organization and its relationship to functional systems.Acknowledgements
This work has been funded by COGC, Iran, No. 2374 and INSF, Iran, No. 95850085.References
1. Li, Y.-O. et al. Hum. Brain Mapp. 33, 1431–1451 (2012).2. Wu, L., Calhoun, V. D., Jung, R. E. & Caprihan, A. Hum. Brain Mapp. 36, 4681–4701 (2015).
3. Wedeen, V. J., Hagmann, P., Tseng, W. I., Reese, T. G. & Weisskoff, R. M. Magn. Reson. Med. 54, 1377–1386 (2005).
4. Hagmann, P. et al. PLoS Biol. 6, 1479–1493 (2008).
5. Bell, A. J. & Sejnowski, T. J. Neural Comput. 7, 1129–1159 (1995).
6. Yang, Z., LaConte, S., Weng, X. & Hu, X. Hum. Brain Mapp. 29, 711–25 (2008).
7. Tunç, B. et al. Phil. Trans. R. Soc. B 371, 20150111 (2016).
Figures