5220
Automated fibre tractography of the optic radiation for epilepsy surgery planning1Translational Imaging Group, University College London, London, United Kingdom, 2MRI Unit, Epilepsy Society, Chalfont St Peter, United Kingdom, 3Wellcome EPSRC Centre for Interventional and Surgical Sciences (WEISS), University College London, London, United Kingdom, 4Department of Clinical and Experimental Epilepsy, University College London, London, United Kingdom, 5Center for Disease Control and Prevention, Health Bureau, Macau, Macau, 6Neuroimaging of Epilepsy Laboratory, Montreal Neurological Institute, McGill University, Montreal, Canada, 7Dementia Research Centre, University College London, London, United Kingdom
Synopsis
Fibre tractography of the optic radiation can be helpful in epilepsy surgery, but its widespread clinical use is hampered by the need for time-consuming expert manual ROI delineations and interrater variability. Our automated approach using anatomically constrained geodesic shape-based averaging is evaluated on two diffusion MRI datasets from different scanners. Automatically generated tracts are within the interrater agreement of two expert raters when evaluating for distance between temporal pole and Meyer’s loop for both datasets, with a tendency towards a more inclusive Meyer’s loop in the automated method.
Introduction
Fibre tractography of the optic radiation (OR) has been shown to help prevent visual field deficits in patients with temporal lobe epilepsy (TLE) undergoing anterior temporal lobe resection (ATLR).1 The current gold standard is to manually define ROIs, either through traditional inclusion and exclusion criteria2 or by supplying orientational priors,3 requiring expert rater input with associated time commitments and inter-rater variability. The typically small start region and highly curved morphology of the OR has made automating this nontrivial.4 Here, we combine our previous method4 of using geodesic shape-based averaging (GSBA) of multi-atlas propagation from a dataset of previously delineated ROIs with anatomically constrained end-points, validating its performance in datasets from two scanners with different diffusion MRI (dMRI) protocols.Methods
Dataset 1: 59 TLE patients (mean age 36y; 29F/30M) were scanned on a 3T GE Signa HDx including a 3D-T1 and dMRI scan with 52 gradient directions at a b-value of 1200 s/mm2 and 6 b=0-images (details in 5). Dataset 2: 10 TLE patients planned for ATLR (mean age 42.5y; 4F/6M) underwent imaging on a 3T GE MR750 including a 3D-T1 and a multi-shell dMRI protocol with 2 mm isotropic resolution and 11, 8, 32, and 64 gradient directions at b-values of 0, 300, 700, and 2500 s/mm2, respectively, and a single b=0-image with reverse phase-encoding. T1s were segmented using Geodesic Information Flows (GIF) into 208 regions.6 MRtrix3 was used to estimate FODs using CSD after dMRI data were corrected for signal drift, and susceptibility and eddy-current induced distortions. For dataset 1, single-shell CSD (Lmax=8) was used;7,8 dataset 2 was processed with multi-shell multi-tissue CSD (Lmax=8).9 Manual delineations were performed for all data by two expert raters as in2,5: seeding from the lateral geniculate nucleus (LGN), inclusion ROI in occipital lobe, using exclusion ROIs midsagittally and anterior to Meyer’s loop (ML). Our automated method uses GSBA,4 using manual delineations from one rater on dataset 1, converting the continuous geodesic distance to a seed ROI matching the manual ROI. Only tracts (2000 tracts, iFOD2) terminating in the occipital lobe (based on GIF parcellation) were included using ACT.10 The accuracy of our method was tested using a leave-one-out validation on dataset 1 and using all cases from dataset 1 as labels for evaluating dataset 2. Tract maps were generated, thresholded to remove the bottom 2% and binarised. Localisation of ML is the most clinically relevant information, so we evaluated the distance from temporal pole (TP, based on the GIF parcellation) to Meyer’s loop: TP-ML.5 This was calculated as a relative value by subtracting the shortest TP-ML of any method (manual 1, manual 2, automated) from the TP-ML, for each subject and side. Spatial agreement between methods was quantified by Cohen’s kappa.11Results
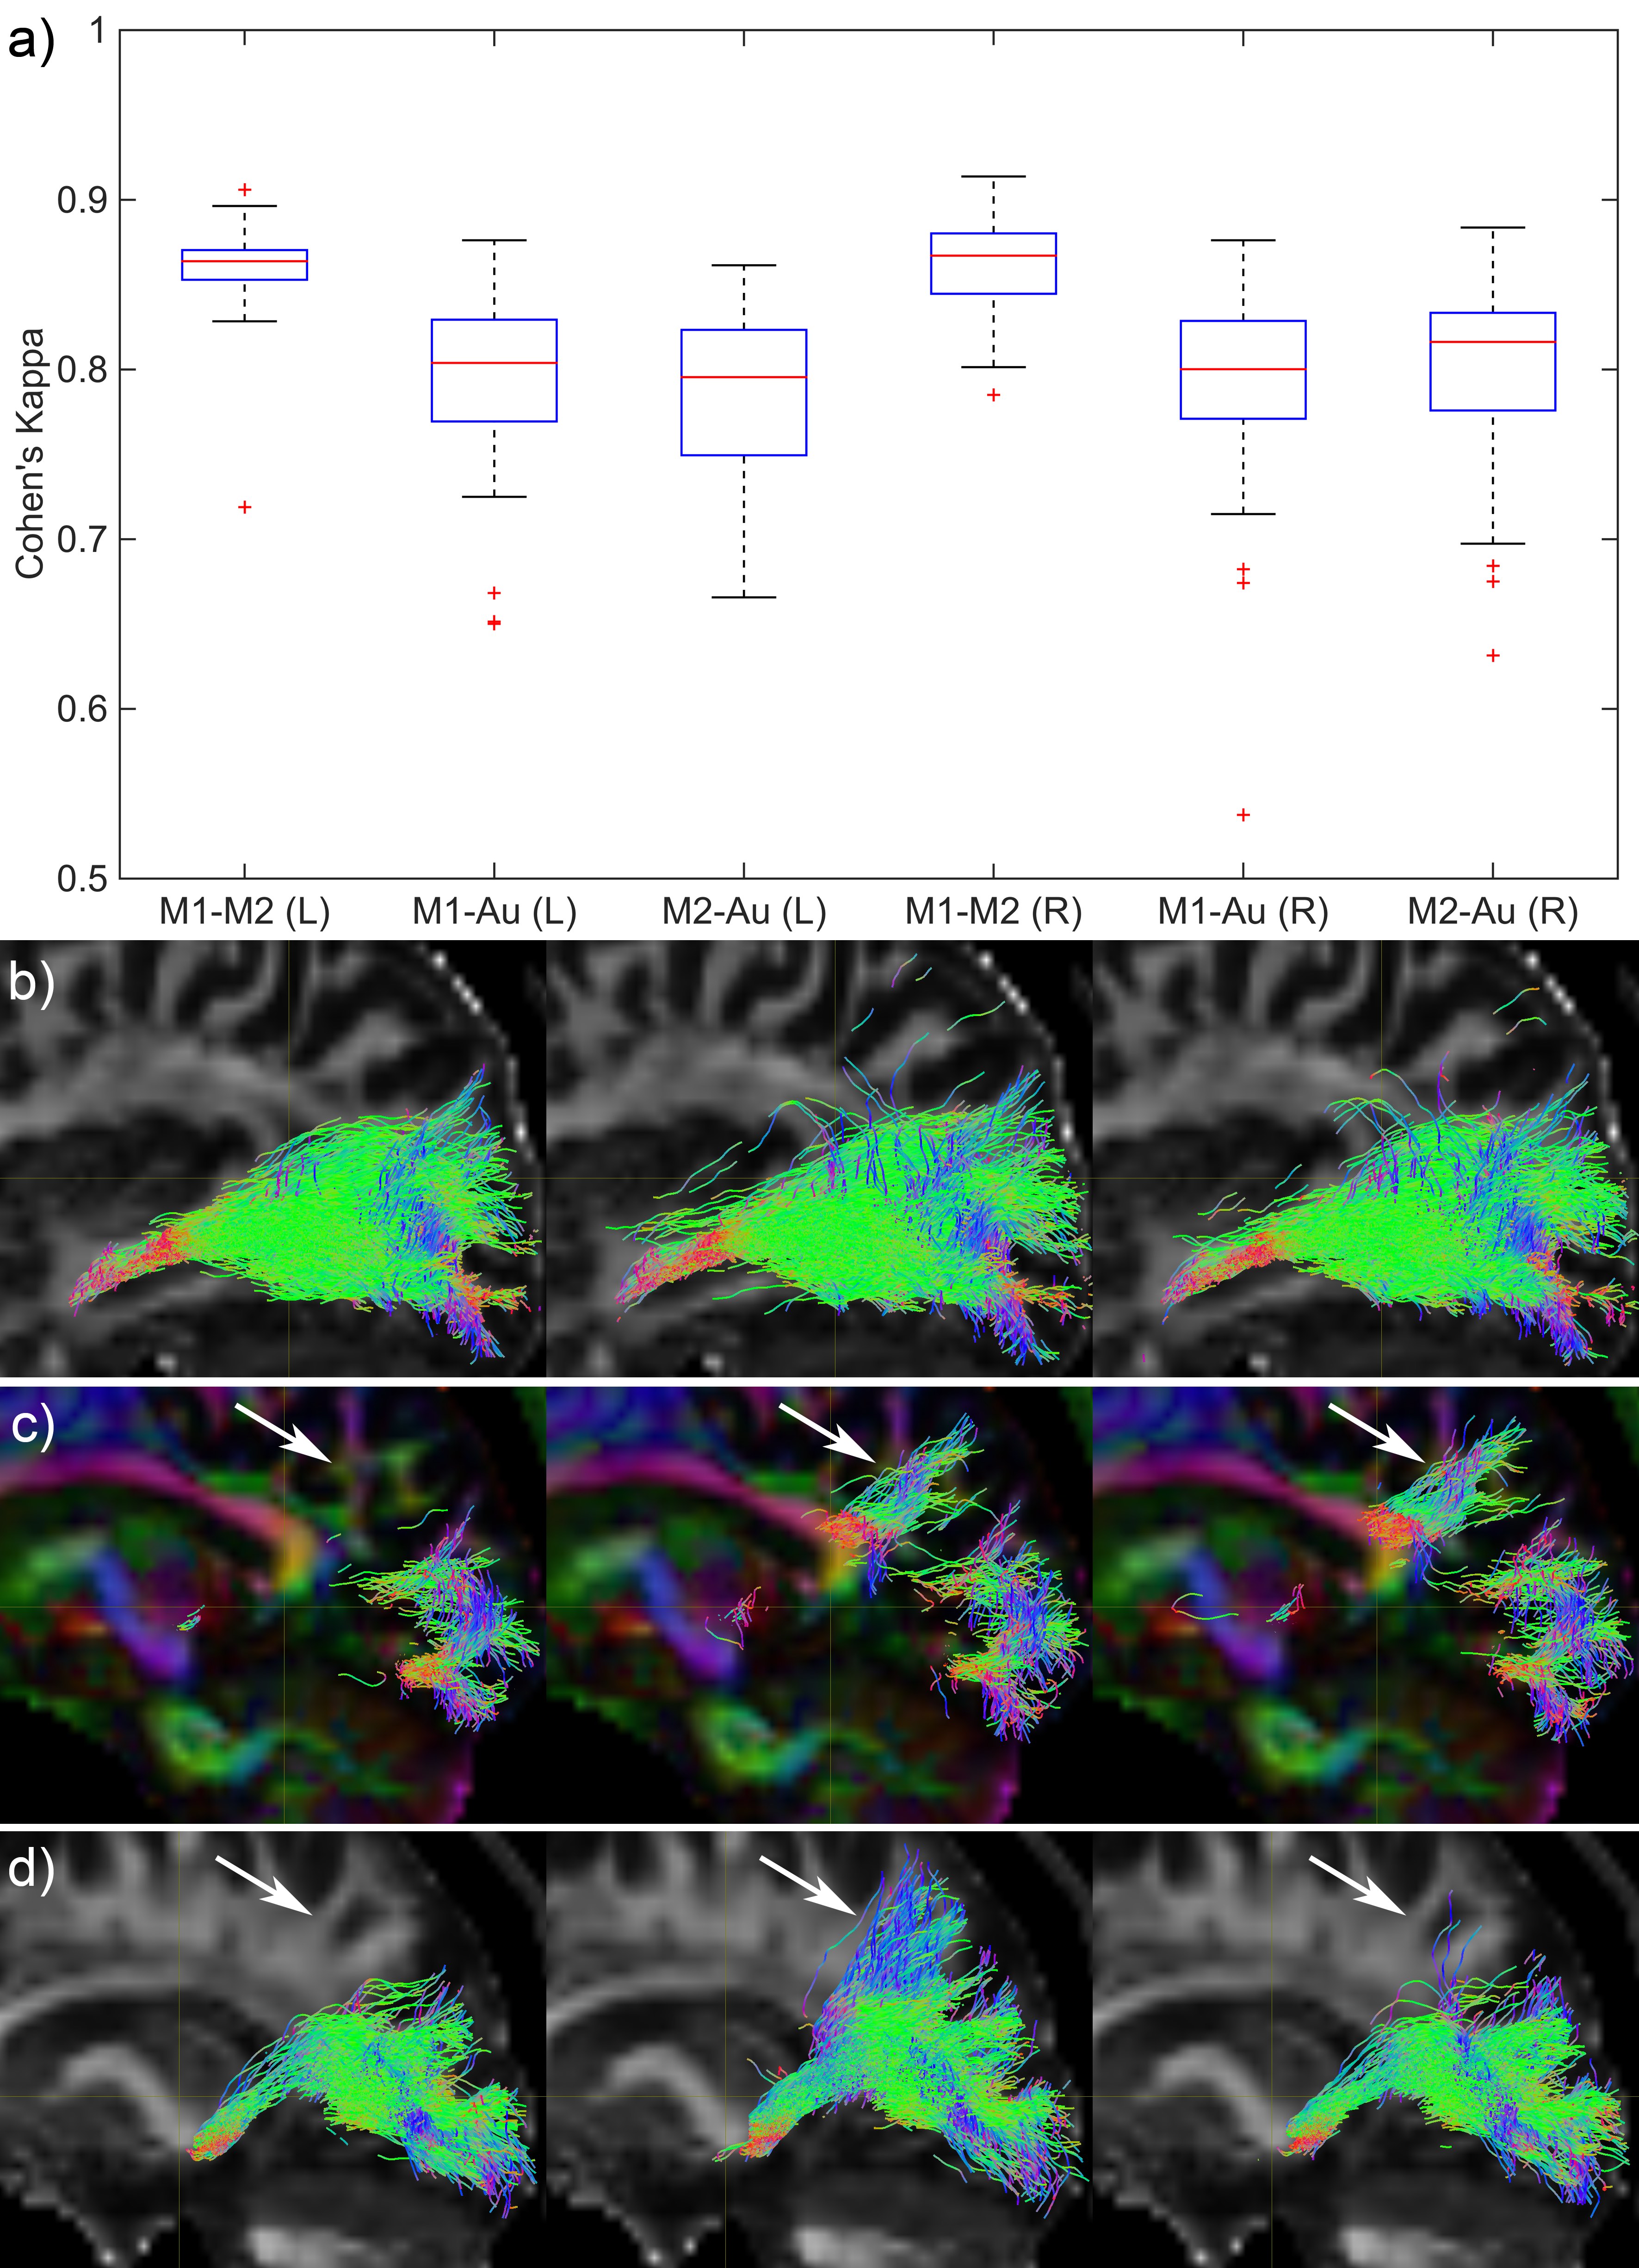
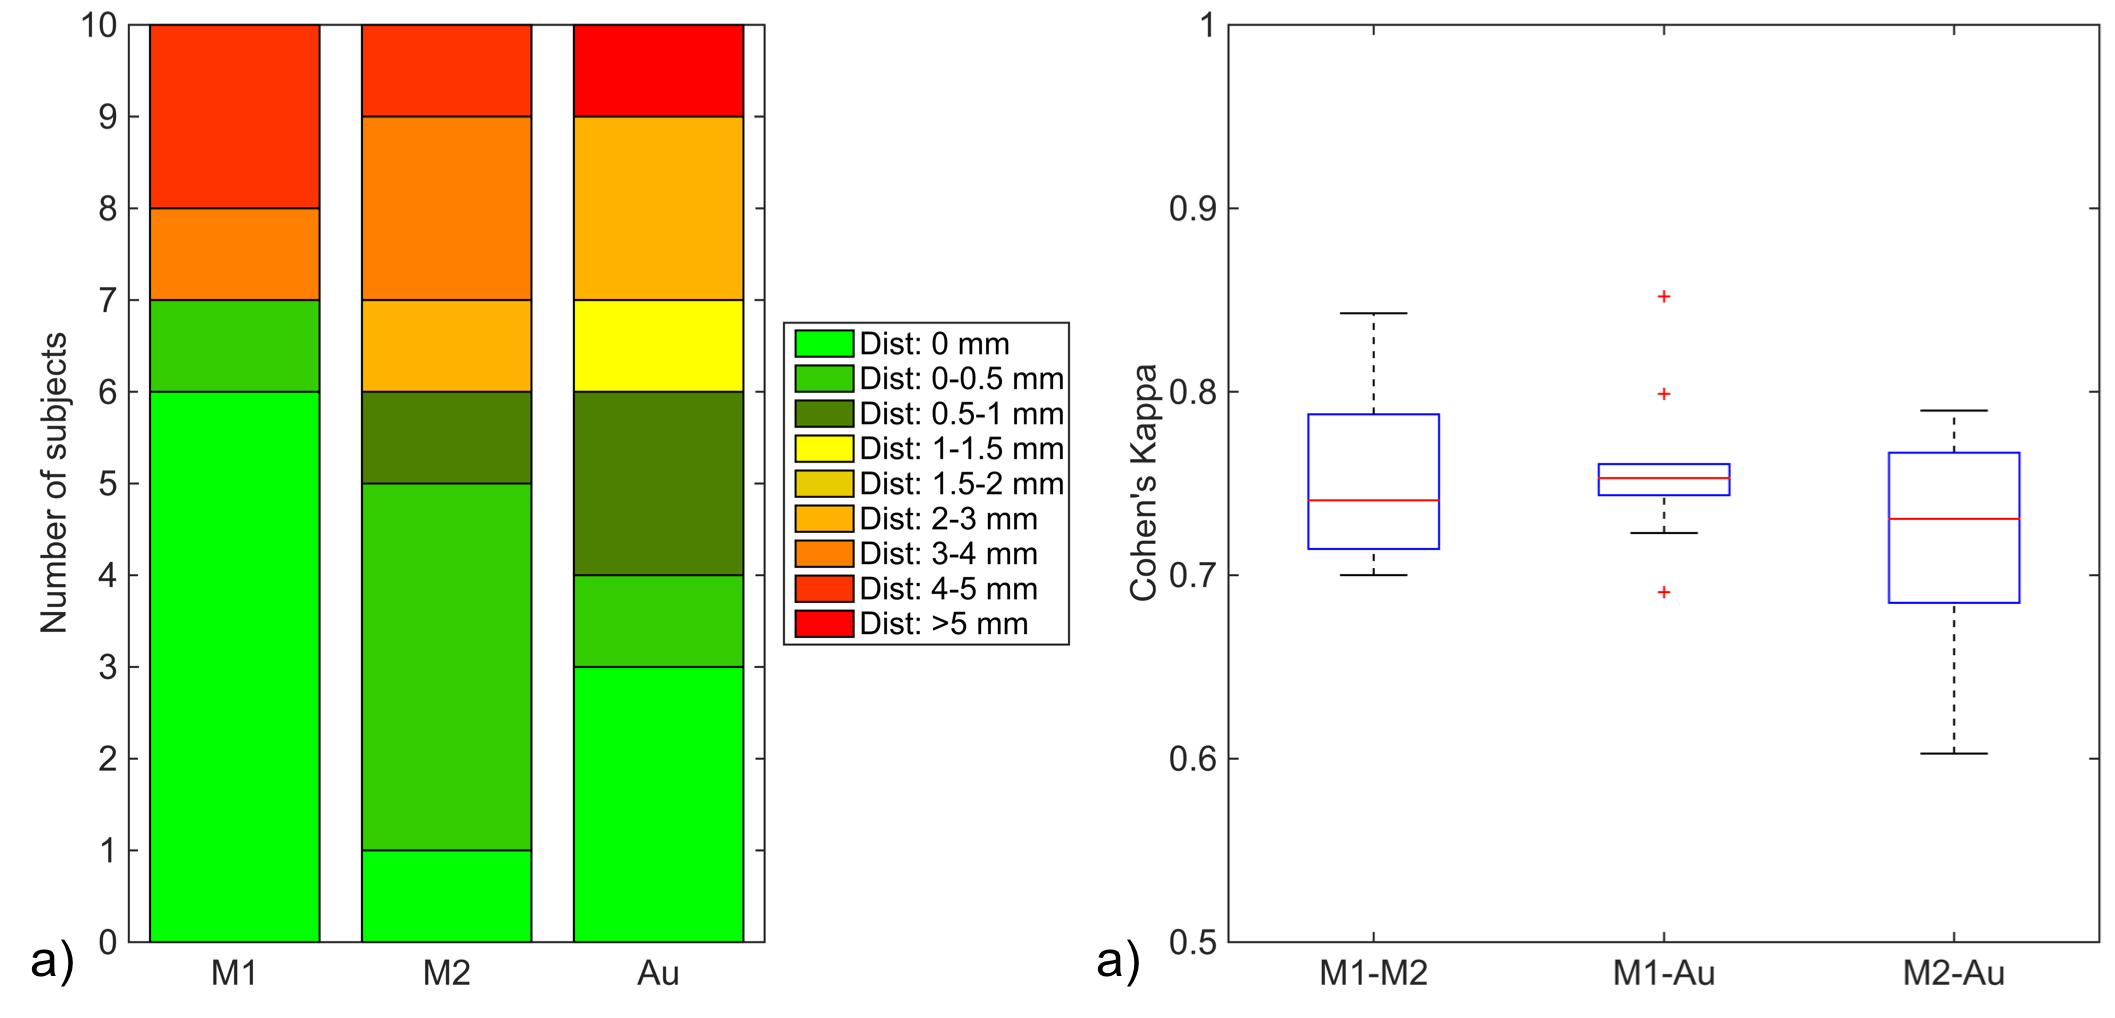
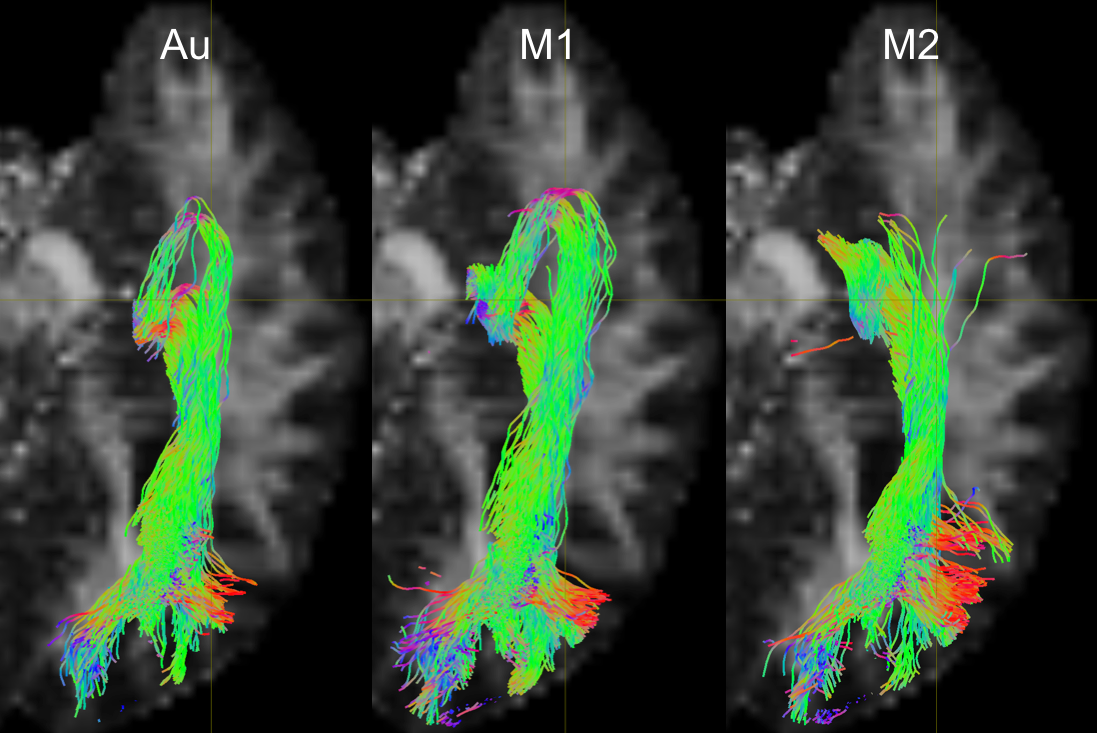
Fig. 1 shows the relative TP-ML distance of each method for dataset 1, as well as example tracts with varying agreement in TP-ML between methods. Fig. 2a shows a boxplot of inter-rater agreement within dataset 1, with near perfect agreement between the two manual delineations (k=0.86 for both left and right bundles) and substantial agreement between either of the manual tracts and the automated method (k=0.79-0.80). Fig. 2b-d show example tracts with varying agreement between methods. Fig. 3 shows relative TP-ML distance and interrater agreement for dataset 2, examining only the OR on the to-be-resected side (4L/6R). Fig. 4 shows example tracts of largest variation in TP-ML between methods.
Discussion
The key characteristic of the OR when undertaking ATLR is the location of ML, and measuring the TP-ML distance we show our automated method yields a smaller distance, i.e., more tracts at the anterior end of the loop. Visual inspection of ML (Figs. 1 & 4) highlights the need for a robust automated approach to circumvent interrater agreement. The lower but substantial agreement between automated and manual tracts compared to interrater agreement is likely the result of varying inclusions of tracts into the parietal lobe (Fig. 2) instead of specifically the occipital lobe. The higher agreement between tracts in dataset 1 (0.80-0.85) than in dataset 2 (0.75) could be a difference in average volume of the bundles (1.8×10⁴ vs. 1.5×104 mm3 for datasets 1 and 2, respectively).Conclusion
Our method to automatically reconstruct the OR is comparable to manual fibre reconstructions over multiple dMRI acquisition protocols on two different scanners.Acknowledgements
We are grateful to the Wolfson Foundation and Epilepsy Society for supporting the Epilepsy Society MRI scanner. This work was supported by the Wellcome/EPSRC (203145Z/16/Z), NIHR BRC UCLH/UCL High Impact Initiative, MRC (G0802012, MR/M00841X/1), and Health Innovation Challenge Fund (WT106882).References
1. Winston GP, Daga P, White MJ, et al. Preventing visual field deficits from neurosurgery. Neurology 2014.
2. Yogarajah M, Focke NK, Bonelli S, et al. Defining Meyer’s loop - temporal lobe resections, visual field deficits and diffusion tensor tractography. Brain 2009;132:1656-68
3. Chamberland M, Scherrer B, Prabhu SP, et al. Active delineation of Meyer’s loop using oriented priors through MAGNEtic Tractography (MAGNET). Human Brain Mapping 2017;38:509-27
4. Cardoso MJ, Winston GP, Modat M, et al. Geodesic Shape-Based Averaging. MICCAI 2012;26-33
5. Nowell M, Vos SB, Sidhu M, et al. Meyer’s loop asymmetry and language lateralisation in epilepsy. JNNP 2016;87:836-42.
6. Cardoso MJ, Modat M, Wolz R, et al. Geodesic Information Flows: Spatially-Variant graphs and their application to Segmentation and Fusion
7. Tournier JD, Calamante F, Connelly A. Robust determination of the fibre orientation distribution in diffusion MRI: non-negativity constrained super-resolved spherical devonvolution. NeuroImage 2007;35:1459-72.
8. Tax CM, Jeurissen B, Vos SB, et al. Recursive calibration of the fiber response function for spherical deconvolution of diffusion MRI data. NeuroImage 2014;86:67-80.
9 Jeurissen B, Tournier JD, Dhollander T, et al. Multi-tissue constrained spherical deconvolution for improved analysis of multi-shell diffusion MRI data. NeuroImage 2014;103:411-26.
10. Smith R, Tournier JD, Calamante F, et al. Anatomically-constrained tractography: improved diffusion MRI streamlines tractography through effective use of anatomical information. NeuroImage 2012;62:1924-36.
11. Wakana S, Caprihan A, Panzenboeck MM, et al. Reproducibility of quantitative tractography methods applied to cerebral white matter. NeuroImage 2007;26:630-44.
Figures