5218
Functional- and Structural-Connectivity Connectome Fingerprints Correlate With Cognitive Behavior Traits in HCP Datasets1Center for Biomedical Imaging, Department of Radiology, NYU School of Medicine, New York, NY, United States, 2Center for Advanced Imaging Innovation and Research (CAI2R), NYU School of Medicine, New York, NY, United States
Synopsis
Connectome analysis of the human brains structural and functional architecture provides a unique opportunity to understand the organization of brain networks. Recently, connectome fingerprinting using brain functional connectivity profiles as the unique traits was able to identify individuals from the group in the Human Connectome Project (HCP) datasets. In HCP s900 datasets, we extend connectome fingerprinting from functional to structural connectivity, identifying multiple relationships between behavioral traits and brain connectivity.
Purpose
In this work, we want to further generalize the connectome fingerprinting 1 approach to correlate behavioral measurements (such as subsets of the working memory test, control attention test, and language test) with diffusion MRI (dMRI) and resting state fMRI. The novel connectome fingerprinting technique, applied to both functional and structural connectivity, can detect the links between individual traits and in-vivo MRI measurements. The identified structure-function relationships can be used to infer neurocognitive measures from neuro-imaging.Methods
We included images from the HCP s900 release dataset 2. We focused on 144 unrelated subjects (64/80 male/female, age 28.5 ± 4.0) for which both diffusion MRI and resting state fMRI scans are available (3T Prisma, 32-channel head coil). Resting state fMRI time series data were acquired with TR/TE=720/33.1 ms, 2 mm³ isotropic resolution, multiband acceleration of factor 8, and a total scan time of 14:33 mins. Diffusion MRI scan parameters were b-max = 3000 s/mm², TR/TE=5520/89.5 ms, 1.25 mm³ resolution, multiband acceleration of factor 3, and the total scan time of 9:50 mins. T1-weighted imaging with TR/TE=2400/2.14ms, 0.7 mm³ isotropic resolution was used for registration.
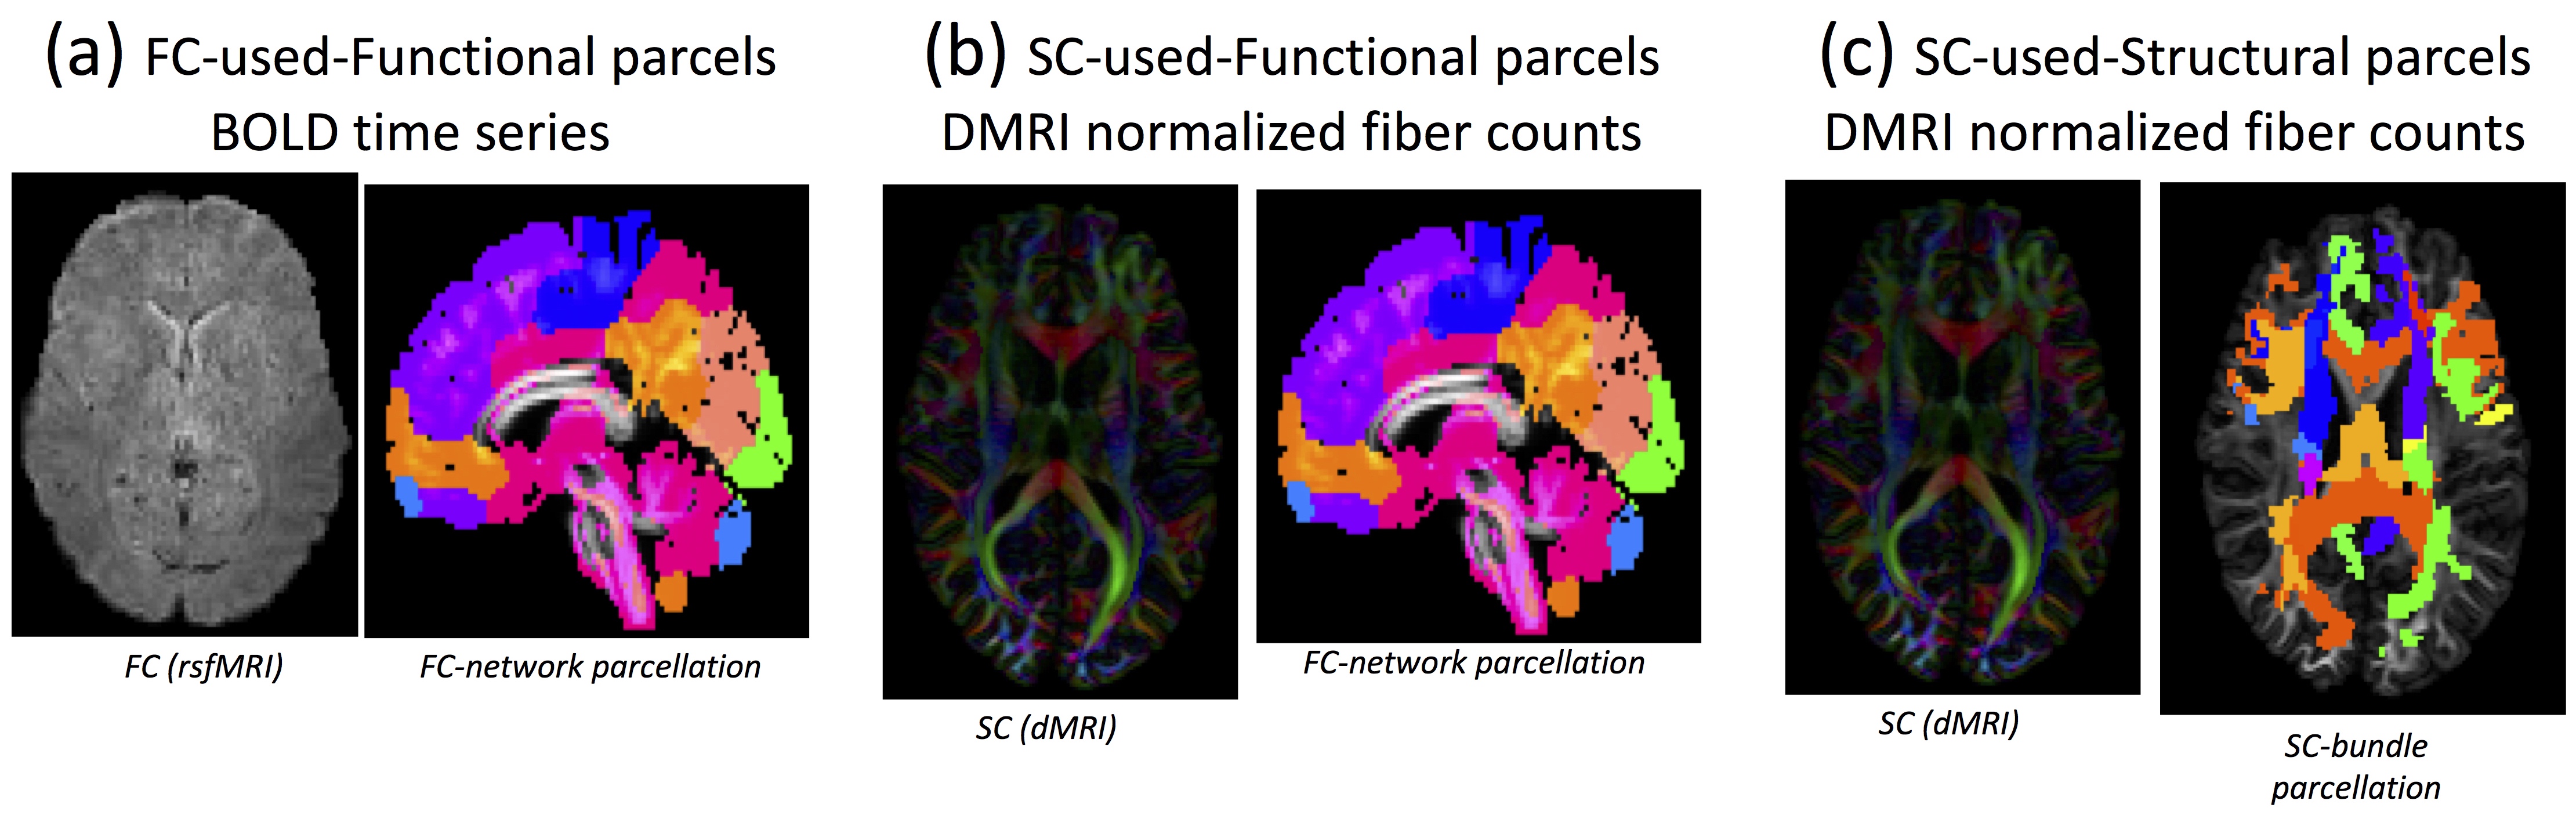
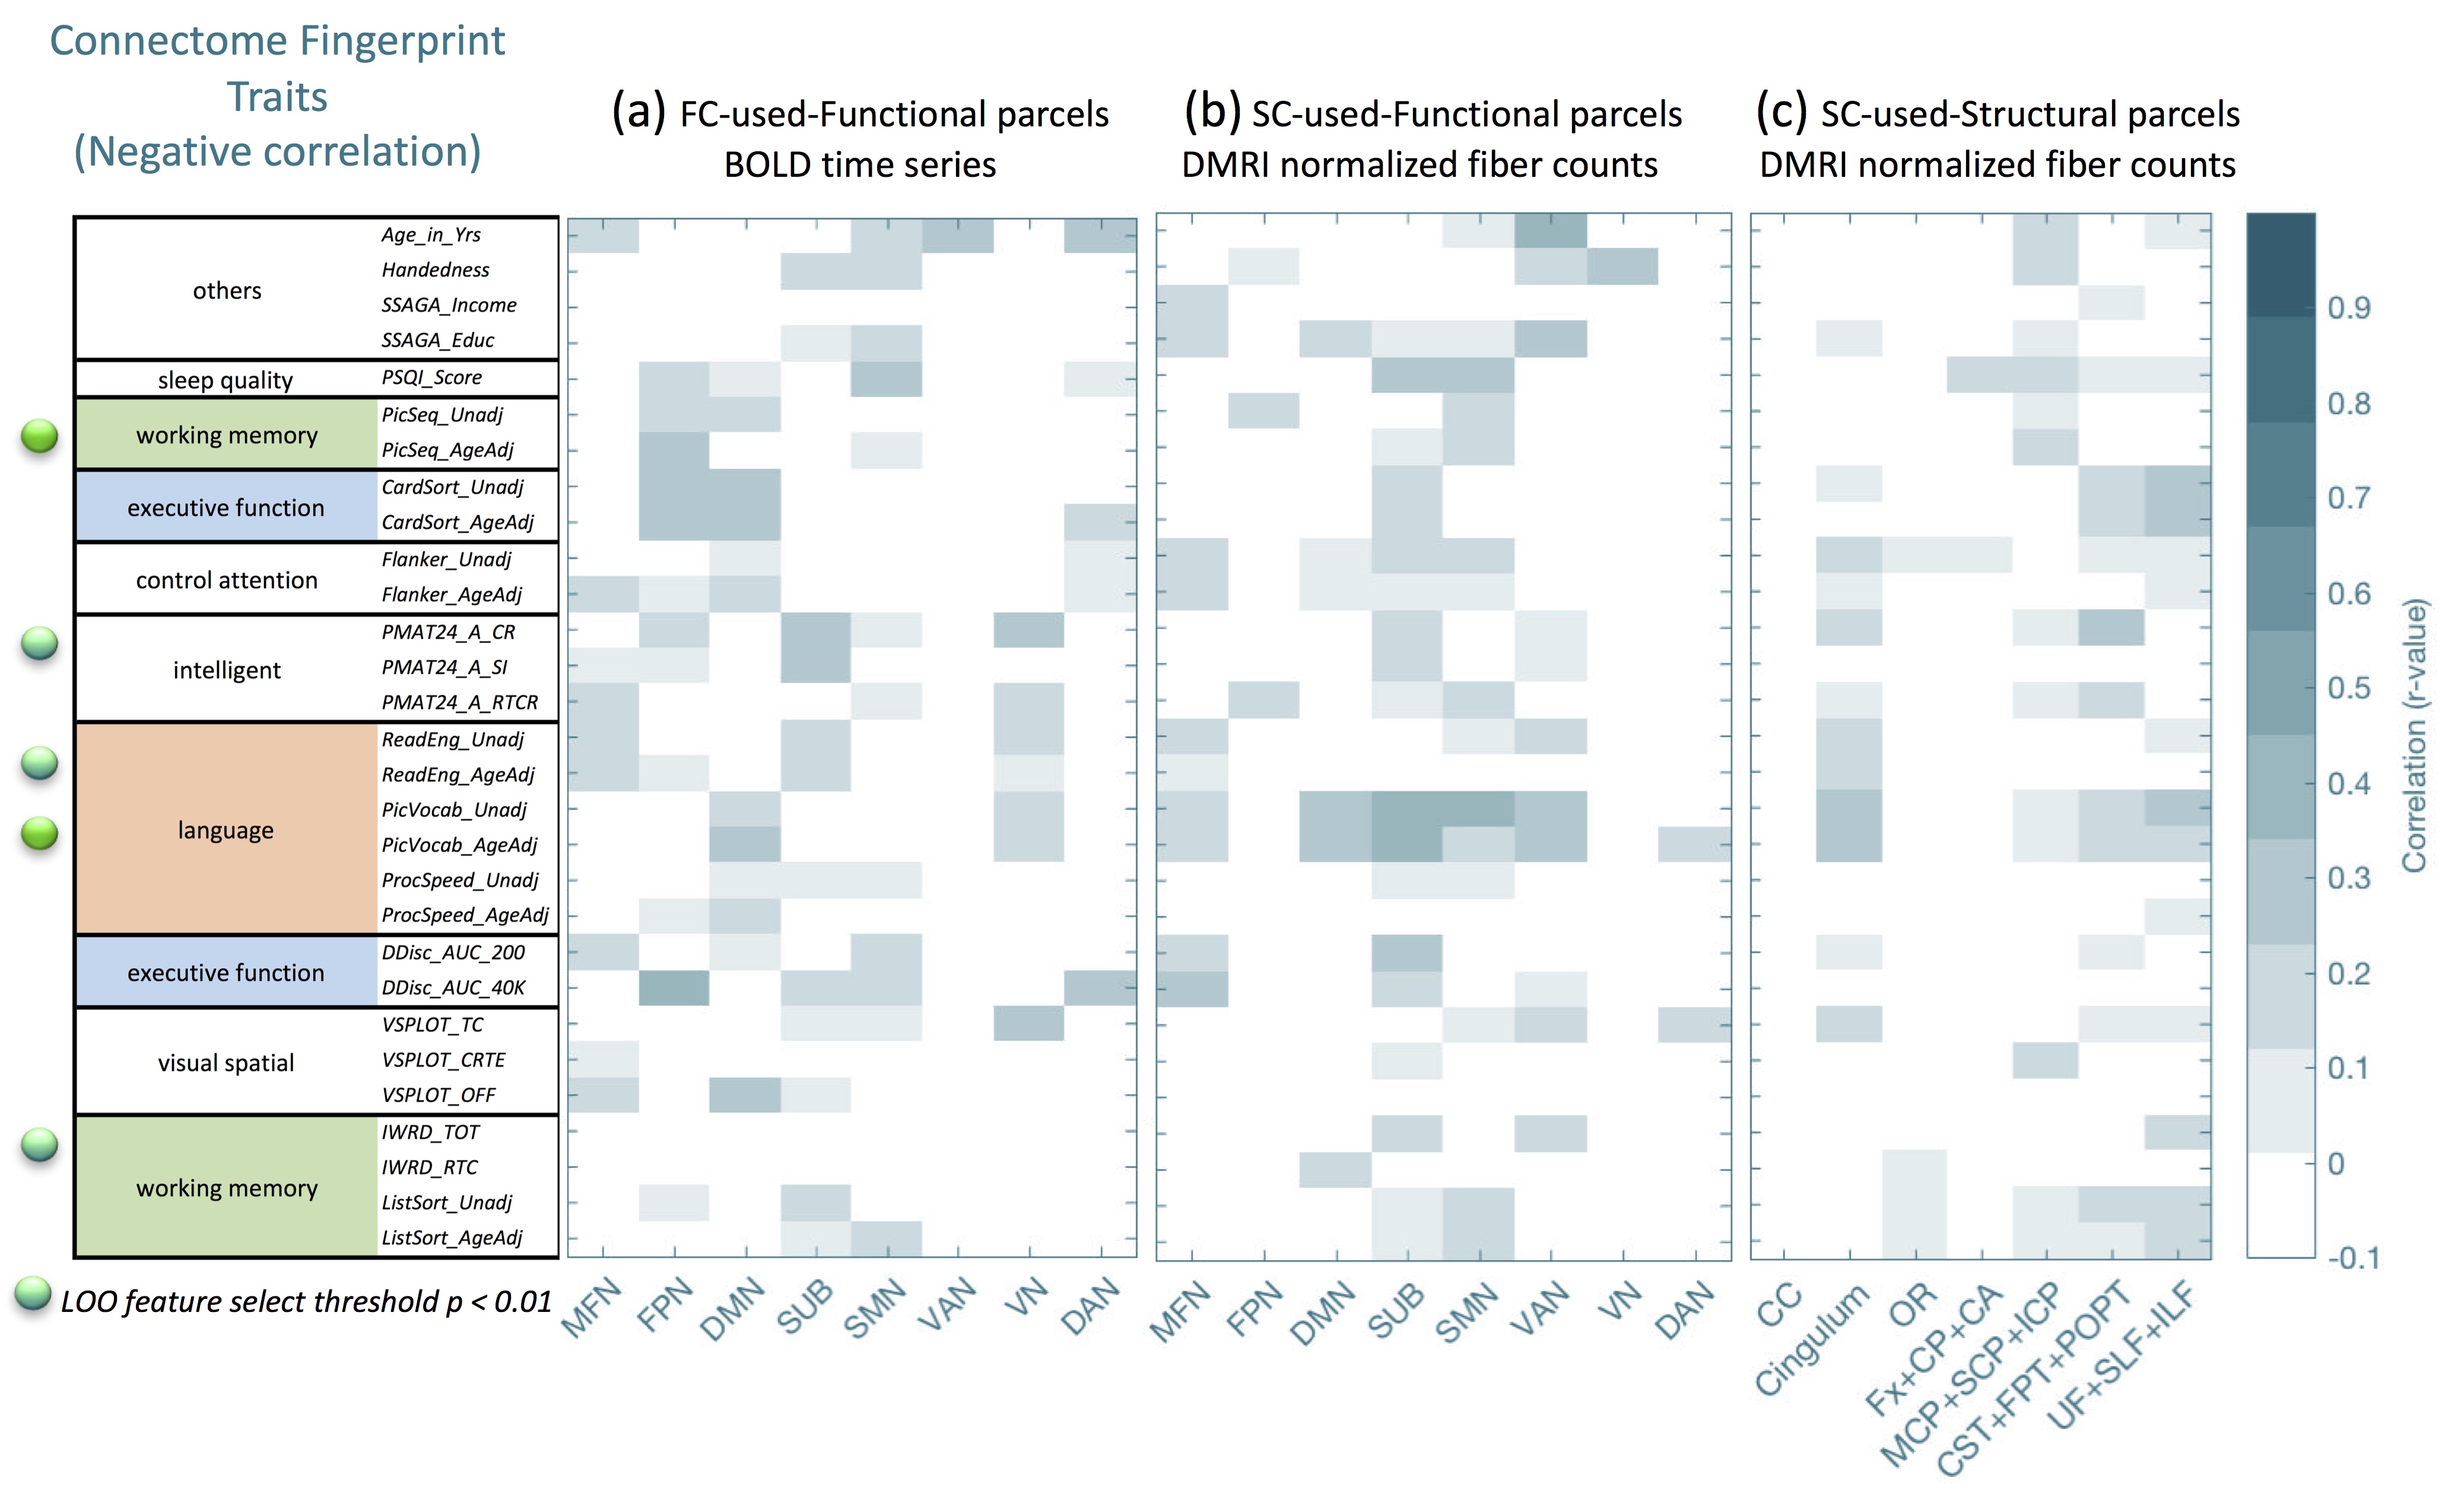
Preprocessing of the functional pipeline includes artifact removal, motion correction (Friston 24-parameter motion-model) and registration to the standard space. We employ a functional parcellation into 268 regions which was recently reported by Shen et al. 3. The Pearson’s correlation was used to calculate the functional connectivity matrices, here referred to as the functional connectome (FC). This FC can be subdivided into eight resting-state cortical and subcortical networks (see Fig. 1) based on location. To obtain meaningful fiber bundles, we employed, besides the previously mentioned functional parcellation, a tractography-based twenty-five fiber bundle template as the structural parcellation (see Fig. 1). For each subject, the structural connectivity matrices (SC) were calculated as the number of the streamlines connecting each pair of regions. Similar to the FC, the SC were subdivided in seven major fiber bundles (CC, Cingulum, OR, Fx+CP+CA, MCP+SCP+ICP, CST+FPT+POPT, UF+SLF+ILF; see Fig. 1) 4,5. All the SC/FC parcellations were transformed to individual diffusion spaces using Elastix 6 and tractography was performed with a deterministic streamline tracking algorithm 7 (turning angle threshold 45⁰, fiber length between 20-500 mm, one million tracts). We selected 29 non-image subject demographic (age, sex, income, education level, etc.) and cognitive behavior (including handedness, working memory, control attention, intelligent score, language score and visual spatial) measurements from the HCP data dictionary 8,9. The fingerprinting evaluation model used leave-one-out cross validation (LOOCV) and false discovery rate (FDR) correction in order to train and test correlations of these measurements with functional/structural connectivity.
Results and Discussion
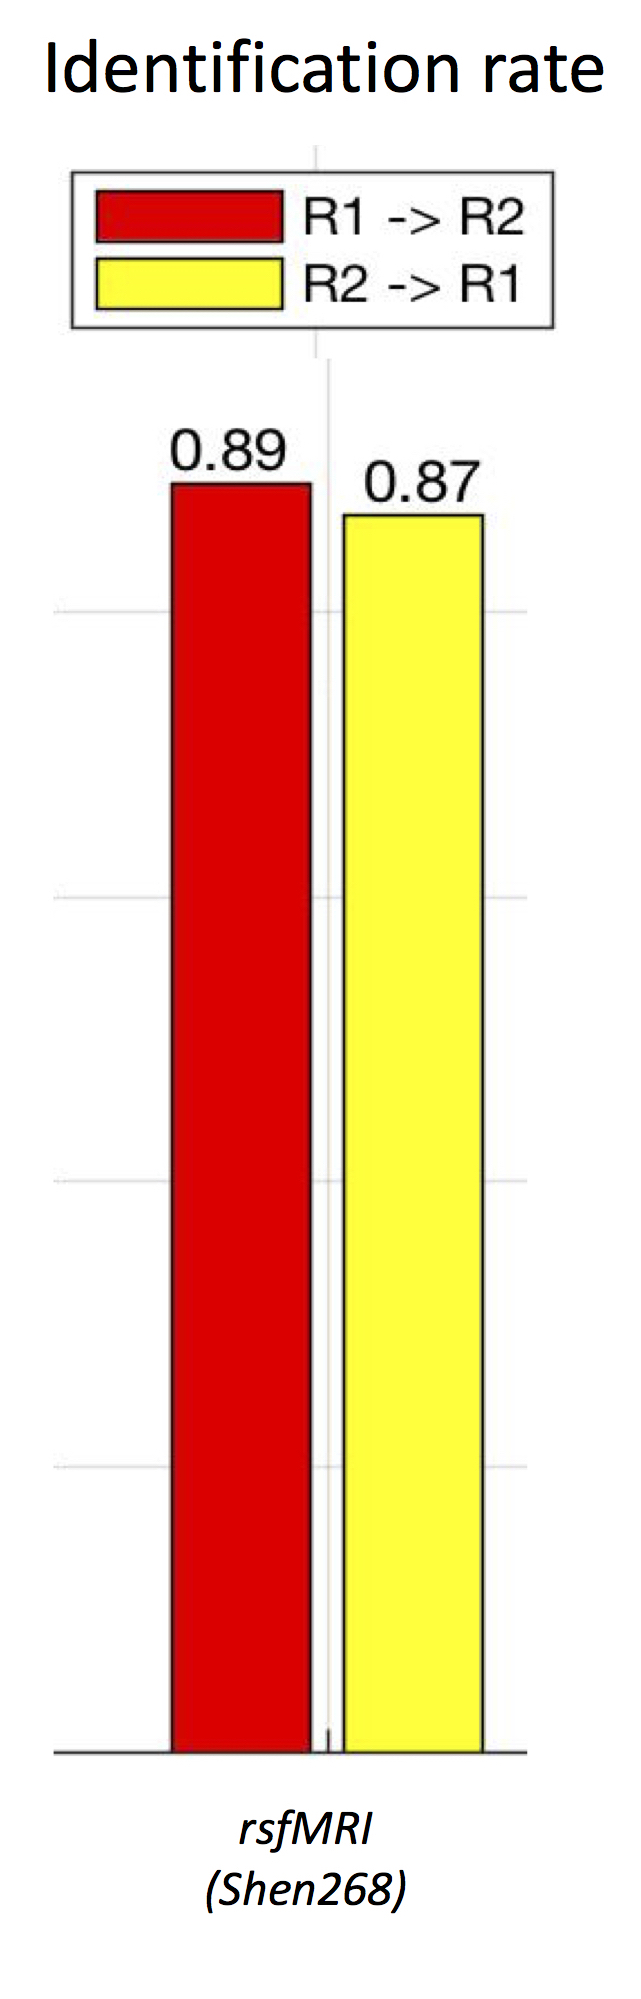
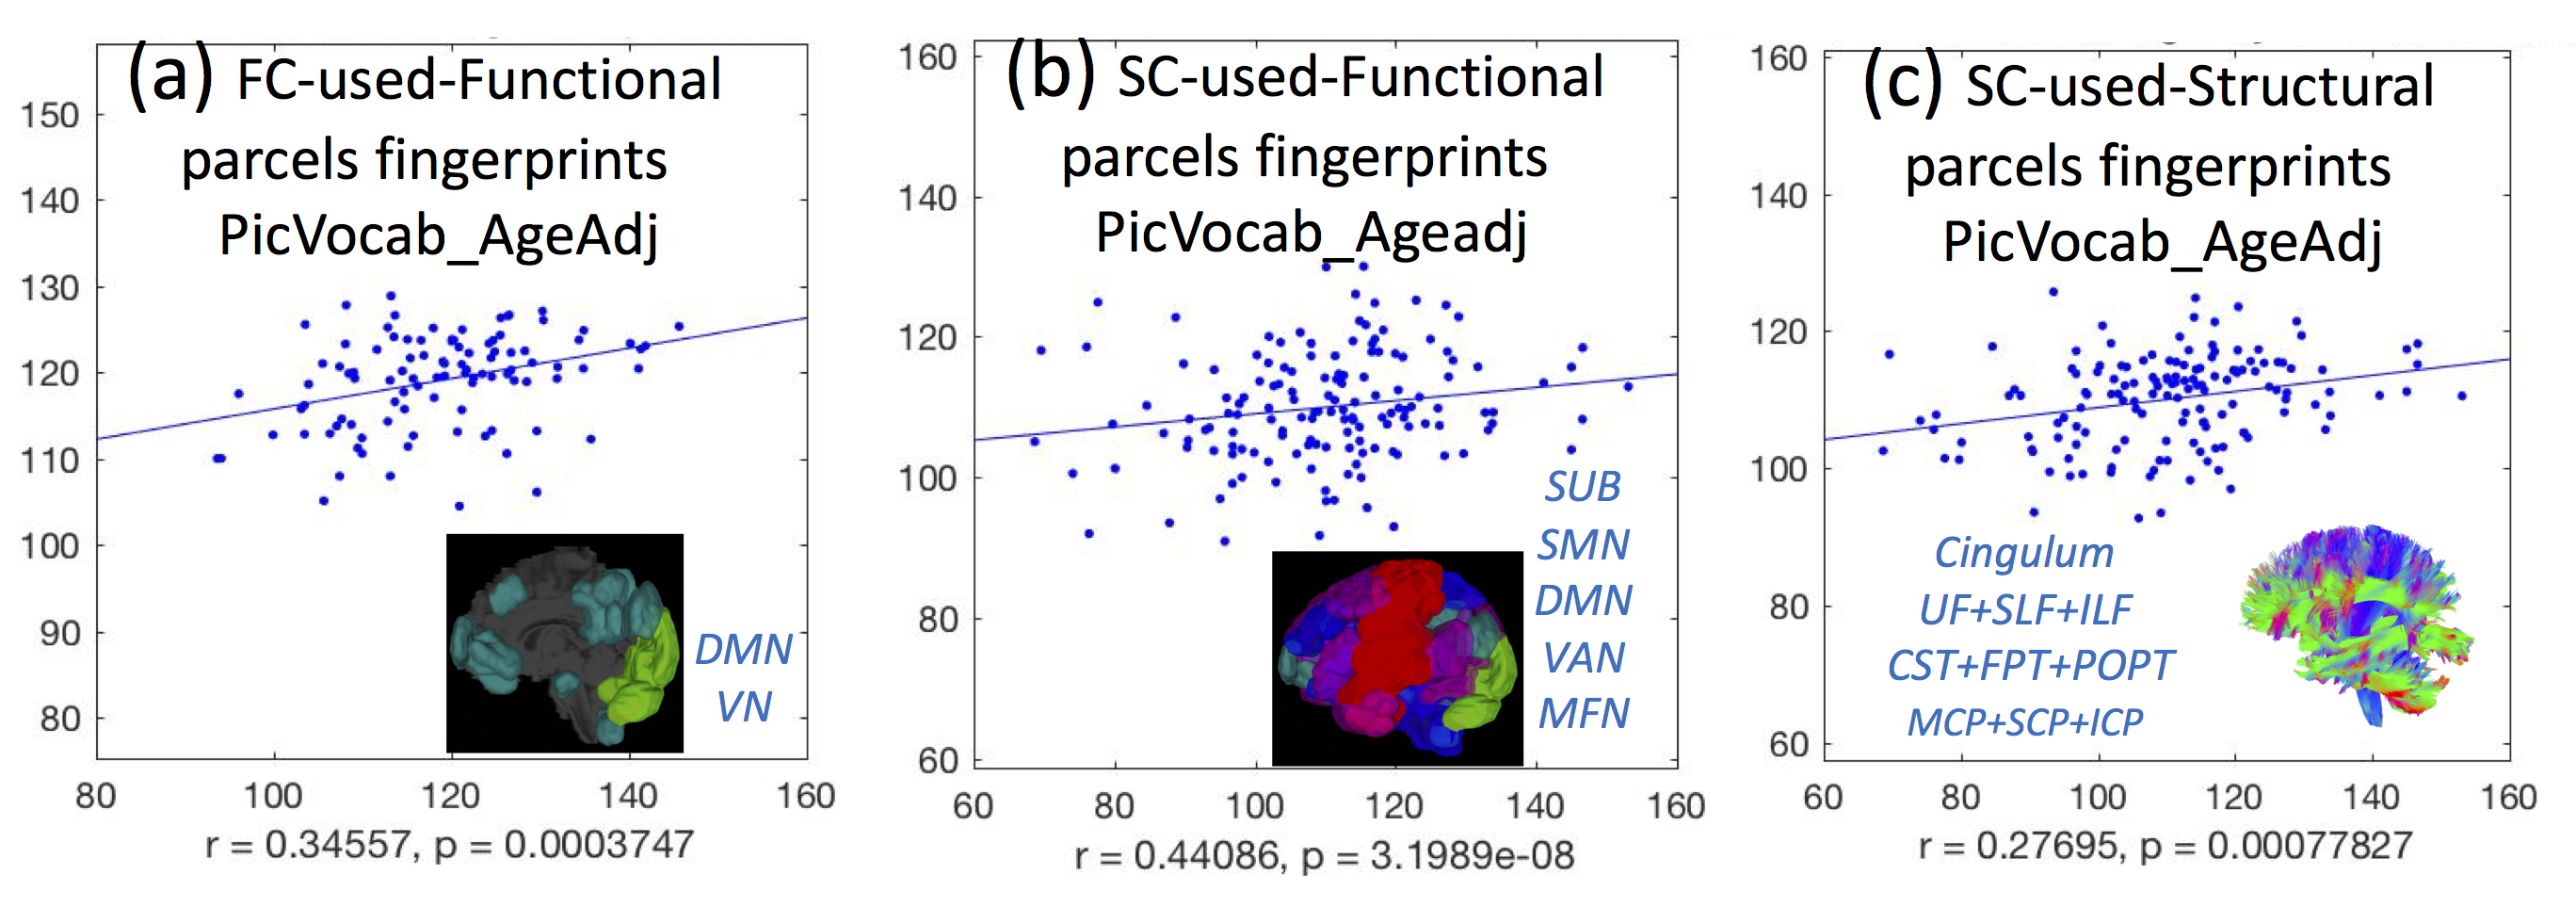
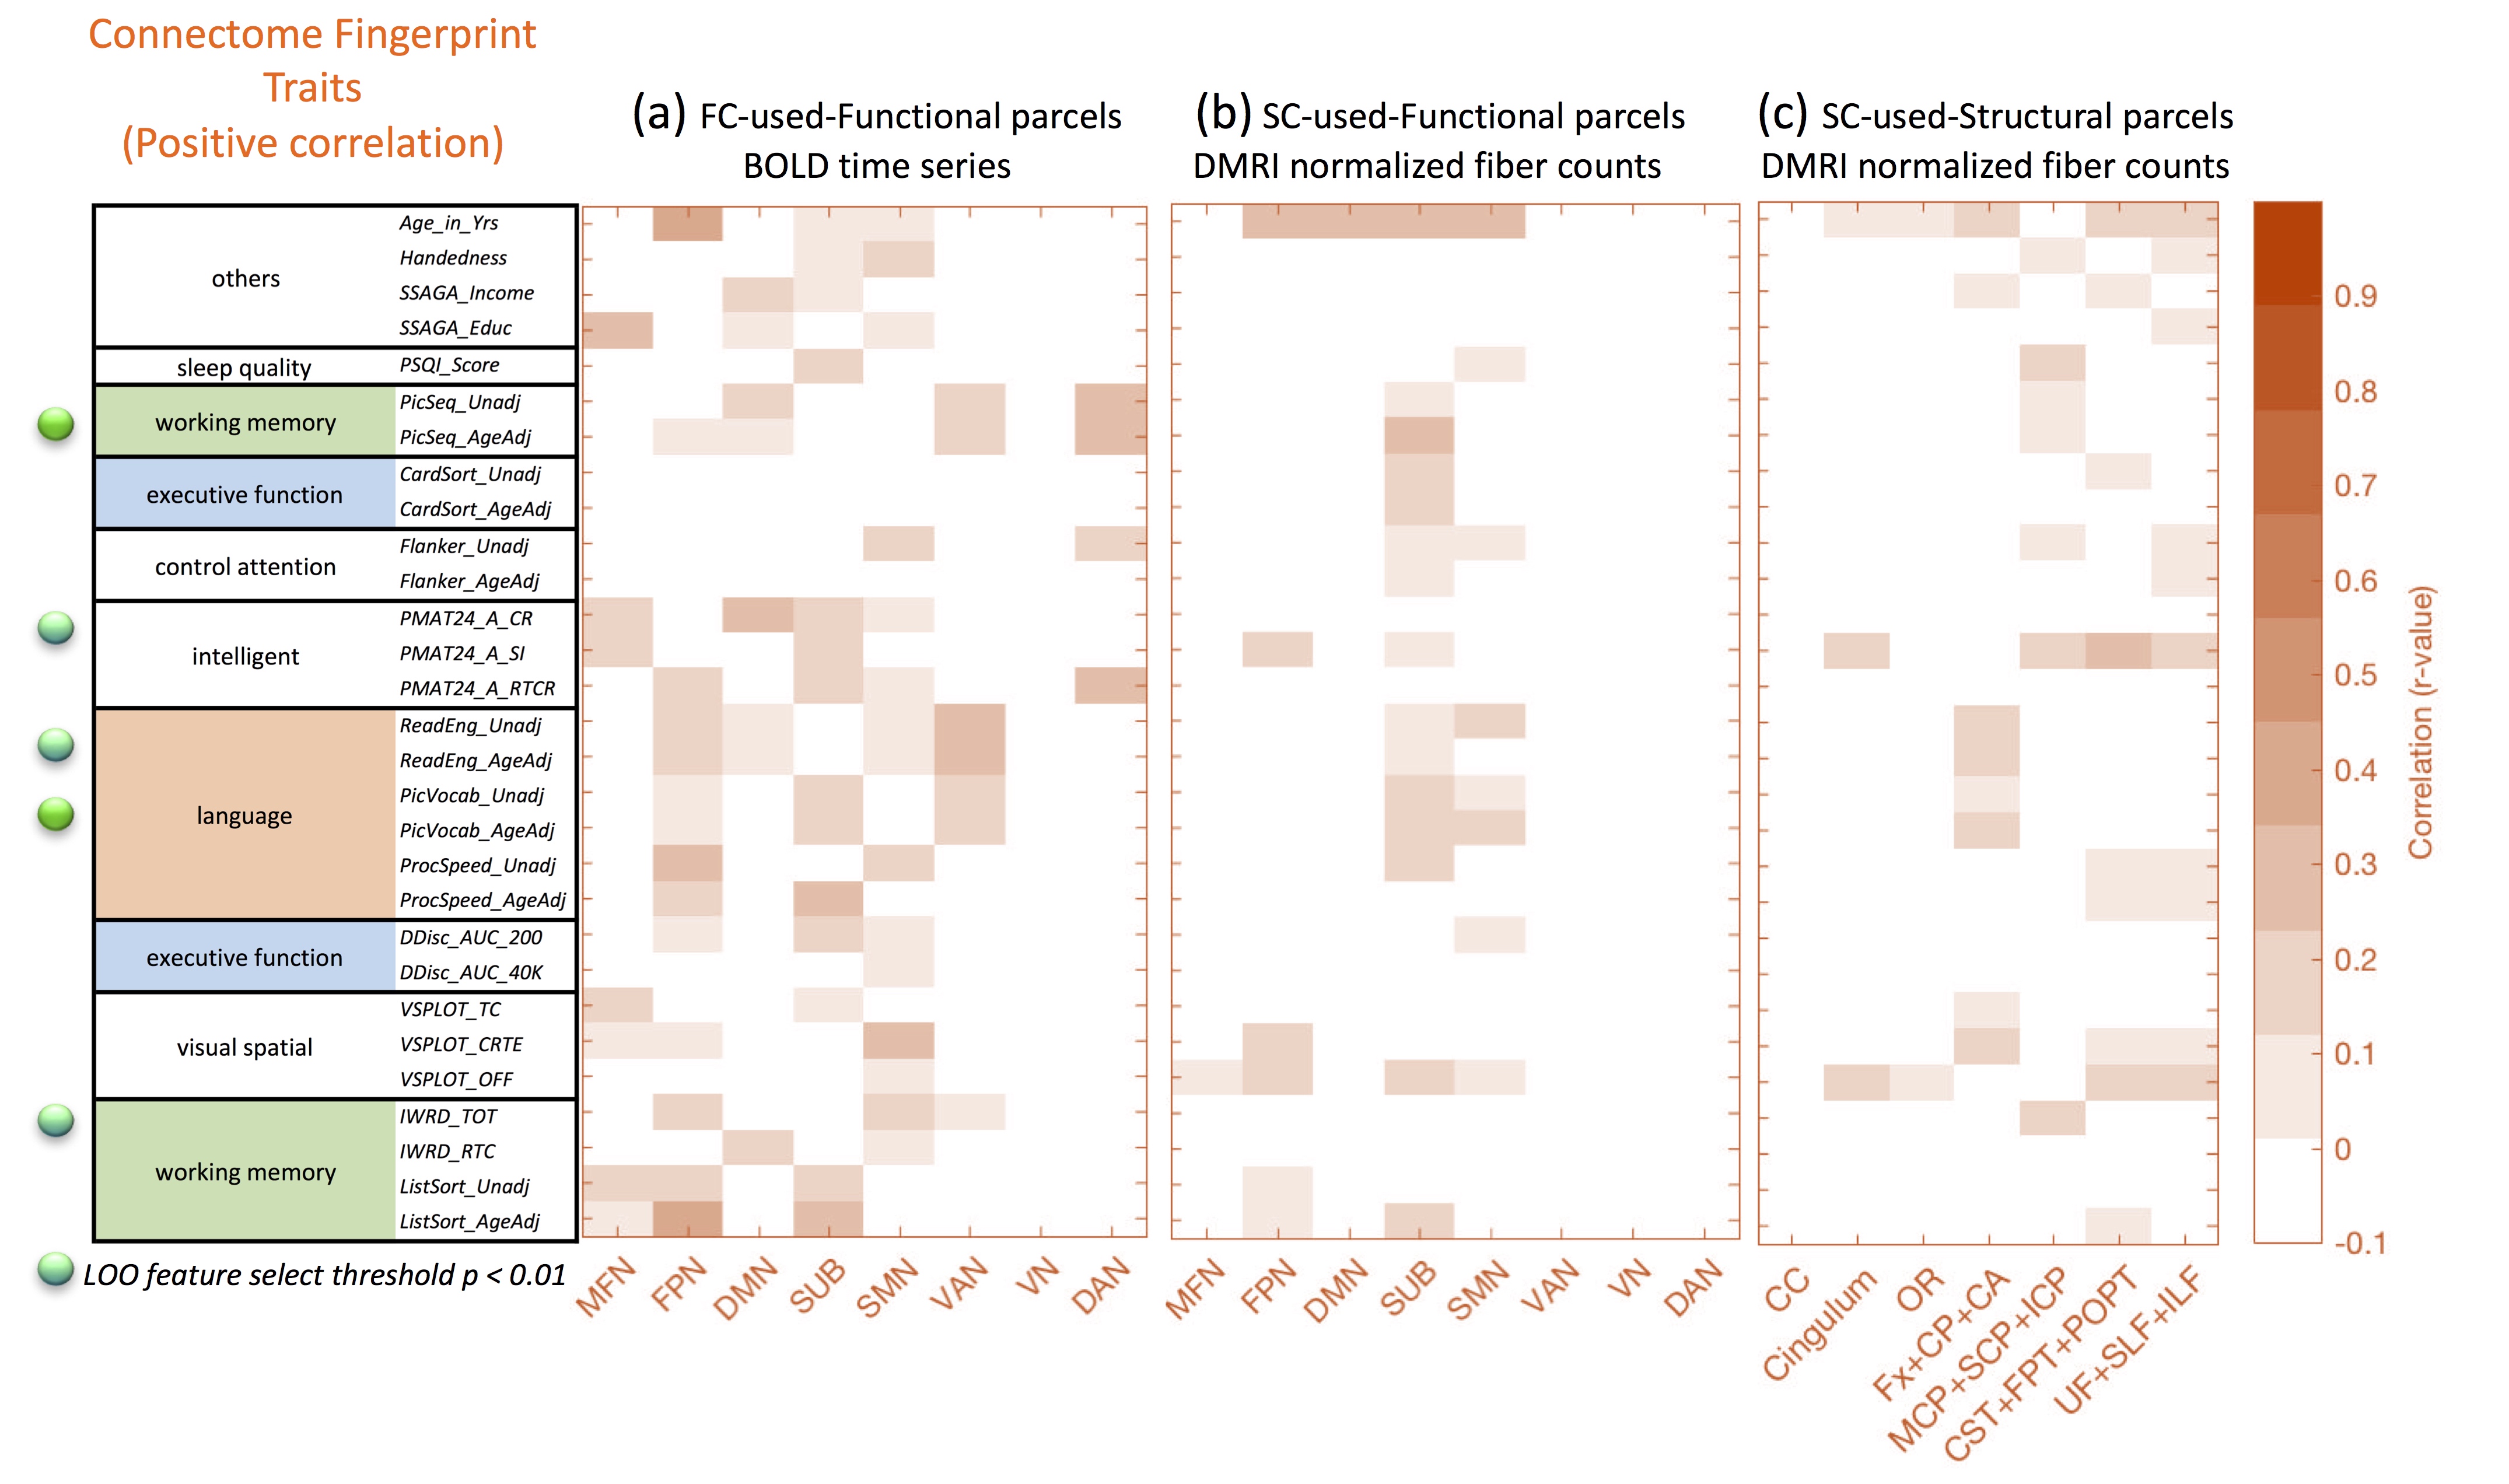
Our results reproduce the close to 90% identification of the same subject using FC fingerprints from two separate days (Fig. 2), confirming the recent FC fingerprint studies 2,9. Hence, we can apply the concept of relating FC fingerprints with cognitive behavior to SC fingerprints (Fig. 3 (a-c)). Indeed, language measurements (PicVocab_AgeAdj ) relate both to FC (r = 0.34, p < 0.00037) and SC (r=0.44, p < 3.19E-8). Connectome fingerprinting identifies positive (Fig. 4) and negative (Fig. 5) correlations of FC of subnetworks and SC of major fiber bundles with behavioral traits. The most significant correlations are highlighted with green dots (p < 0.01) in Fig. 4 and 5. These results indicate the ability of Connectome fingerprinting to relate not only FC, but also SC, with neurocognitive measures.Conclusion
Our study focusses on the relationships between individual cognitive traits and functional and structural connectivity. In this contribution, we extend earlier functional connectivity connectome fingerprinting results with structural connectivity analysis in seven distinguishable major white matter bundles. These results show that both functional and structural connectome fingerprinting can be used to correlate with behavior; they also confirm other recent “connectome-fingerprint” studies 3, 9-12. The presented framework can be used to explore the connections between MR imaging and cognitive behavior traits in public datasets such as the HCP dataset.Acknowledgements
This project is supported in part by PHS grants R01-CA111996, R01-NS082436 and R01-MH00380. We thank Dr. R. T. Constable and his lab for helpful discussions on the Connectome Fingerprinting method. Data were provided by the Human Connectome Project, WU-Minn Consortium (Principal Investigators: David Van Essen and Kamil Ugurbil; 1U54MH091657) funded by the 16 NIH Institutes and Centers that support the NIH Blueprint for Neuroscience Research; and by the McDonnell Center for Systems Neuroscience at Washington University.References
1. Finn, Emily S. (2015), “Functional Connectome Fingerprinting: Identifying Individuals Using Patterns of Brain Connectivity.” NatureNeuroscience 18, no. 11: 1664–71.
2. “Human Connectome Project.” http://www.humanconnectome.org/data/
3. Shen, X., F. Tokoglu, X. Papademetris, and R. T. Constable. “Groupwise Whole-Brain Parcellation from Resting-State fMRI Data for Network Node Identification.” NeuroImage 82 (November 15, 2013): 403–15. https://doi.org/10.1016/j.neuroimage.2013.05.081.
4. “ISMRM Tractography challenge.” http://www.tractometer.org/ismrm_2015_challenge/
5. Maier-Hein, Klaus H., Peter F. Neher, Jean-Christophe Houde, Marc-Alexandre Côté, Eleftherios Garyfallidis, Jidan Zhong, Maxime Chamberland, et al. “The Challenge of Mapping the Human Connectome Based on Diffusion Tractography.” Nature Communications 8, no. 1 (November 7, 2017): 1349. https://doi.org/10.1038/s41467-017-01285-x.
6. S. Klein, M. Staring, K. Murphy, M.A. Viergever, J.P.W. Pluim, "elastix: a toolbox for intensity based medical image registration," IEEE Transactions on Medical Imaging, vol. 29, no. 1, pp. 196 - 205, January 2010.
7. Yeh FC, Verstynen TD, Wang Y, Fernández-Miranda JC, Tseng WYI (2014) Correction: Deterministic Diffusion Fiber Tracking Improved by Quantitative Anisotropy. PLOS ONE 9(1): 10.1371
8. https://wiki.humanconnectome.org/display/PublicData/HCP+Data+Dictionary+Public-+500+Subject+Release
9. Smith, Stephen, Thomas Nichols, Diego Vidaurre, Anderson Winkler, Timothy Behrens, Matthew Glasser, Kamil Ugurbil, Deanna Barch, David Van Essen, and Karla Miller. “A Positive-Negative Mode of Population Covariation Links Brain Connectivity, Demographics and Behavior.” Nature Neuroscience 18, no. 11 (November 2015): 1565–67. https://doi.org/10.1038/nn.4125.
10. Waller, Lea, Henrik Walter, Johann D. Kruschwitz, Lucia Reuter, Sabine Müller, Susanne Erk, and Ilya M. Veer. “Evaluating the Replicability, Specificity, and Generalizability of Connectome Fingerprints.” NeuroImage 158 (September 2017): 371–77. https://doi.org/10.1016/j.neuroimage.2017.07.016.
11. Powell, Michael, Javier Garcia, Fang-Cheng Yeh, Jean Vettel, and Timothy Verstynen. “Local Connectome Phenotypes Predict Social, Health, and Cognitive Factors.” bioRxiv, January 1, 2017. https://doi.org/10.1101/122945.
12. Fukushima, Makoto, Richard F. Betzel, Ye He, Martijn P. van den Heuvel, Xi-Nian Zuo, and Olaf Sporns. “Structure–function Relationships during Segregated and Integrated Network States of Human Brain Functional Connectivity.” Brain Structure and Function, October 31, 2017. https://doi.org/10.1007/s00429-017-1539-3.
Figures