5216
Enhancing bundle topology for tractography visualization using silhouette rendering1CUBRIC, Cardiff University, Cardiff, United Kingdom
Synopsis
Global illumination rendering techniques are often considered the gold standard for displaying 3D structures. They are however computationally expensive and most neuroimaging software packages do not support such advanced methods. Here, we applied cartoon-like shading to tractography-derived bundles to enhance visualization of their topological features. Combined with glass-brain rendering, we believe that this non-realistic rendering technique can help both new comers to the field and experienced scientists to better perceive shape specific features of brain bundles, enhancing both neuroanatomical understanding and neurosurgical planning.
Introduction
Identifying silhouettes and their edges is critical for segmenting images or improving their comprehension. Illustrative methods based on edge detection such as cartoon-like rendering are commonly found in cinematic and video game industries. These non-realistic rendering techniques have been applied in the past for tractography visualization, generating stunning hand drawn-like black & white images[1, 2]. Similar techniques have been recently proposed to visualize the uncertainty in tractography[3-5] (for a complete review of those methods see [6-8] and references therein). Expanding on these methods, we propose a two-stage real-time rendering technique to improve visualization of tractography-derived bundles, without the need for tube rendering, scene lighting, or the complex computation of illumination methods.Methods
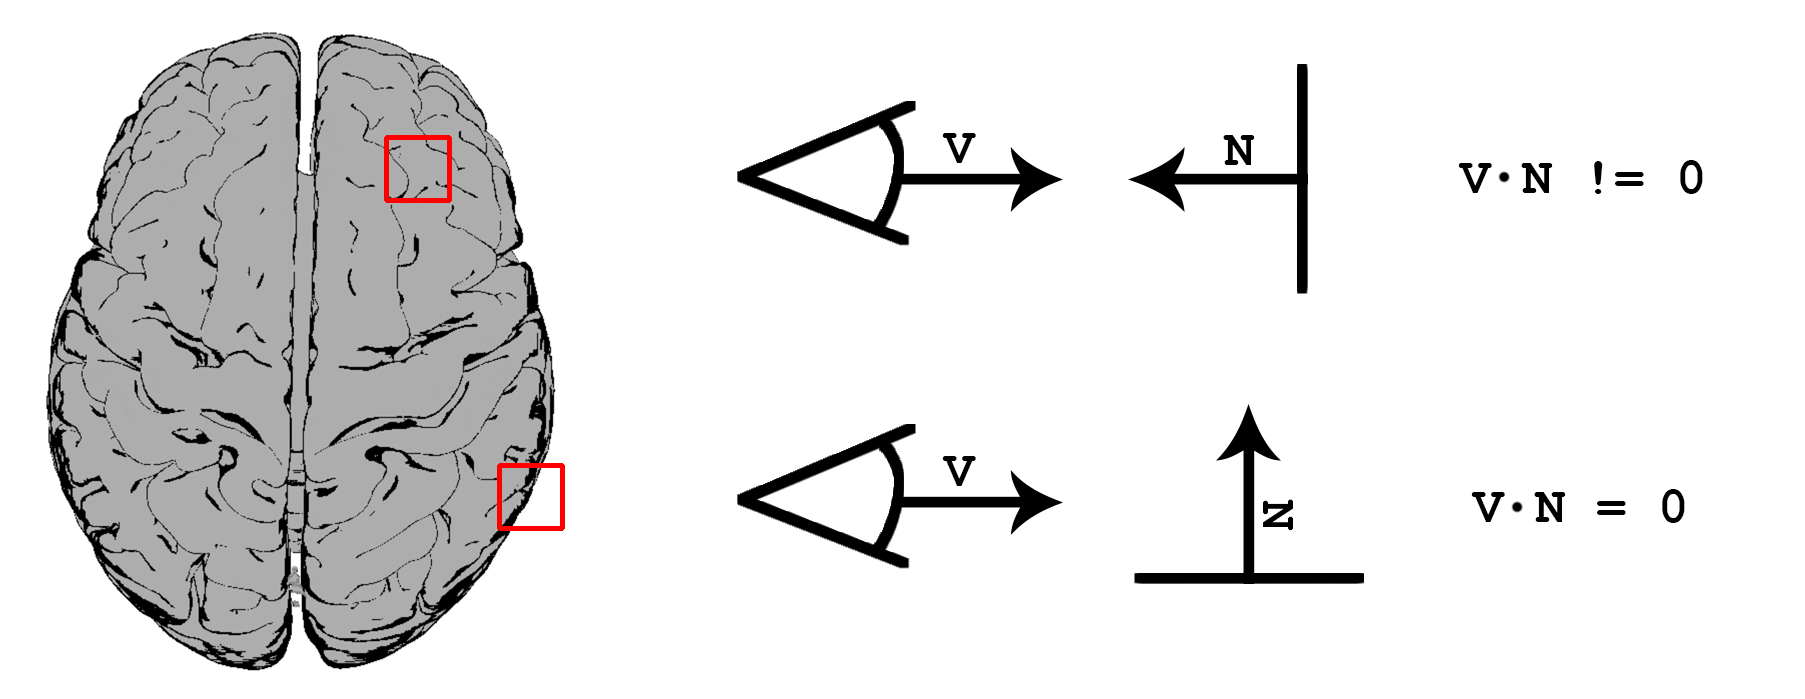
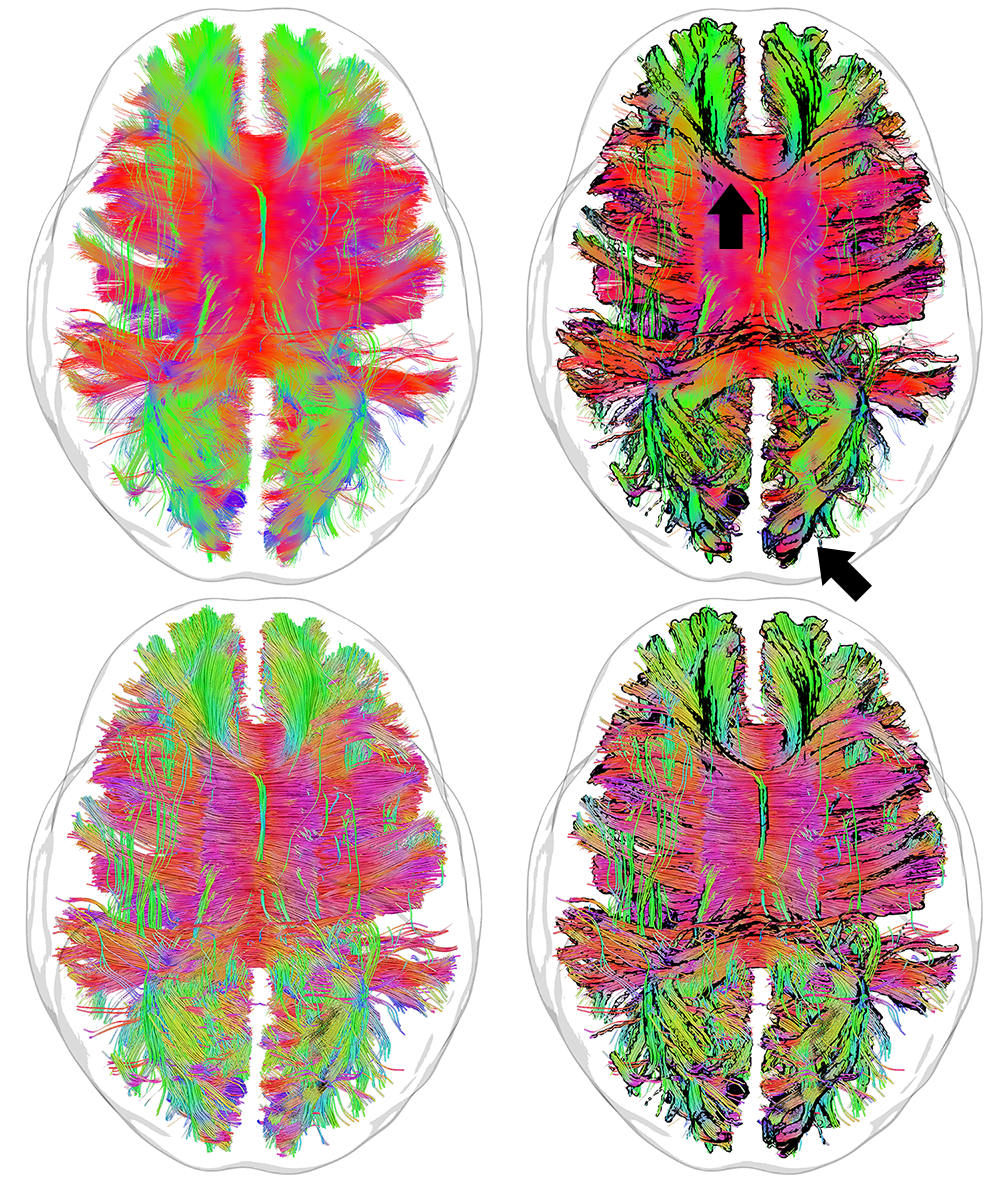
Definitions: A silhouette here represents the contour of a 3D object[9] and is mathematically defined as <v, n> = 0, where v is the view vector (i.e. with which the user is looking at the scene) and n is the normal at each point on the object. Using this approach, edges of an object can then be detected and subsequently colored differently to the rest of the object itself, as seen in Figure 1.
Bundle silhouette: The first step consists of binarizing the bundle of interest and deriving a 3D volume (i.e. iso-surface). The iso-surface is then rendered using the aforementioned silhouette shading technique, and combined with the original streamlines using an appropriate rendering order (Fig. 2). In the proposed framework, the user can dynamically choose 3 parameters to enhance the visualization according to personal preference: i) an edge detection threshold (t); ii) an edge opacity value (αedge) as well as ii) a non-edge opacity value (αnon-edge).
Results
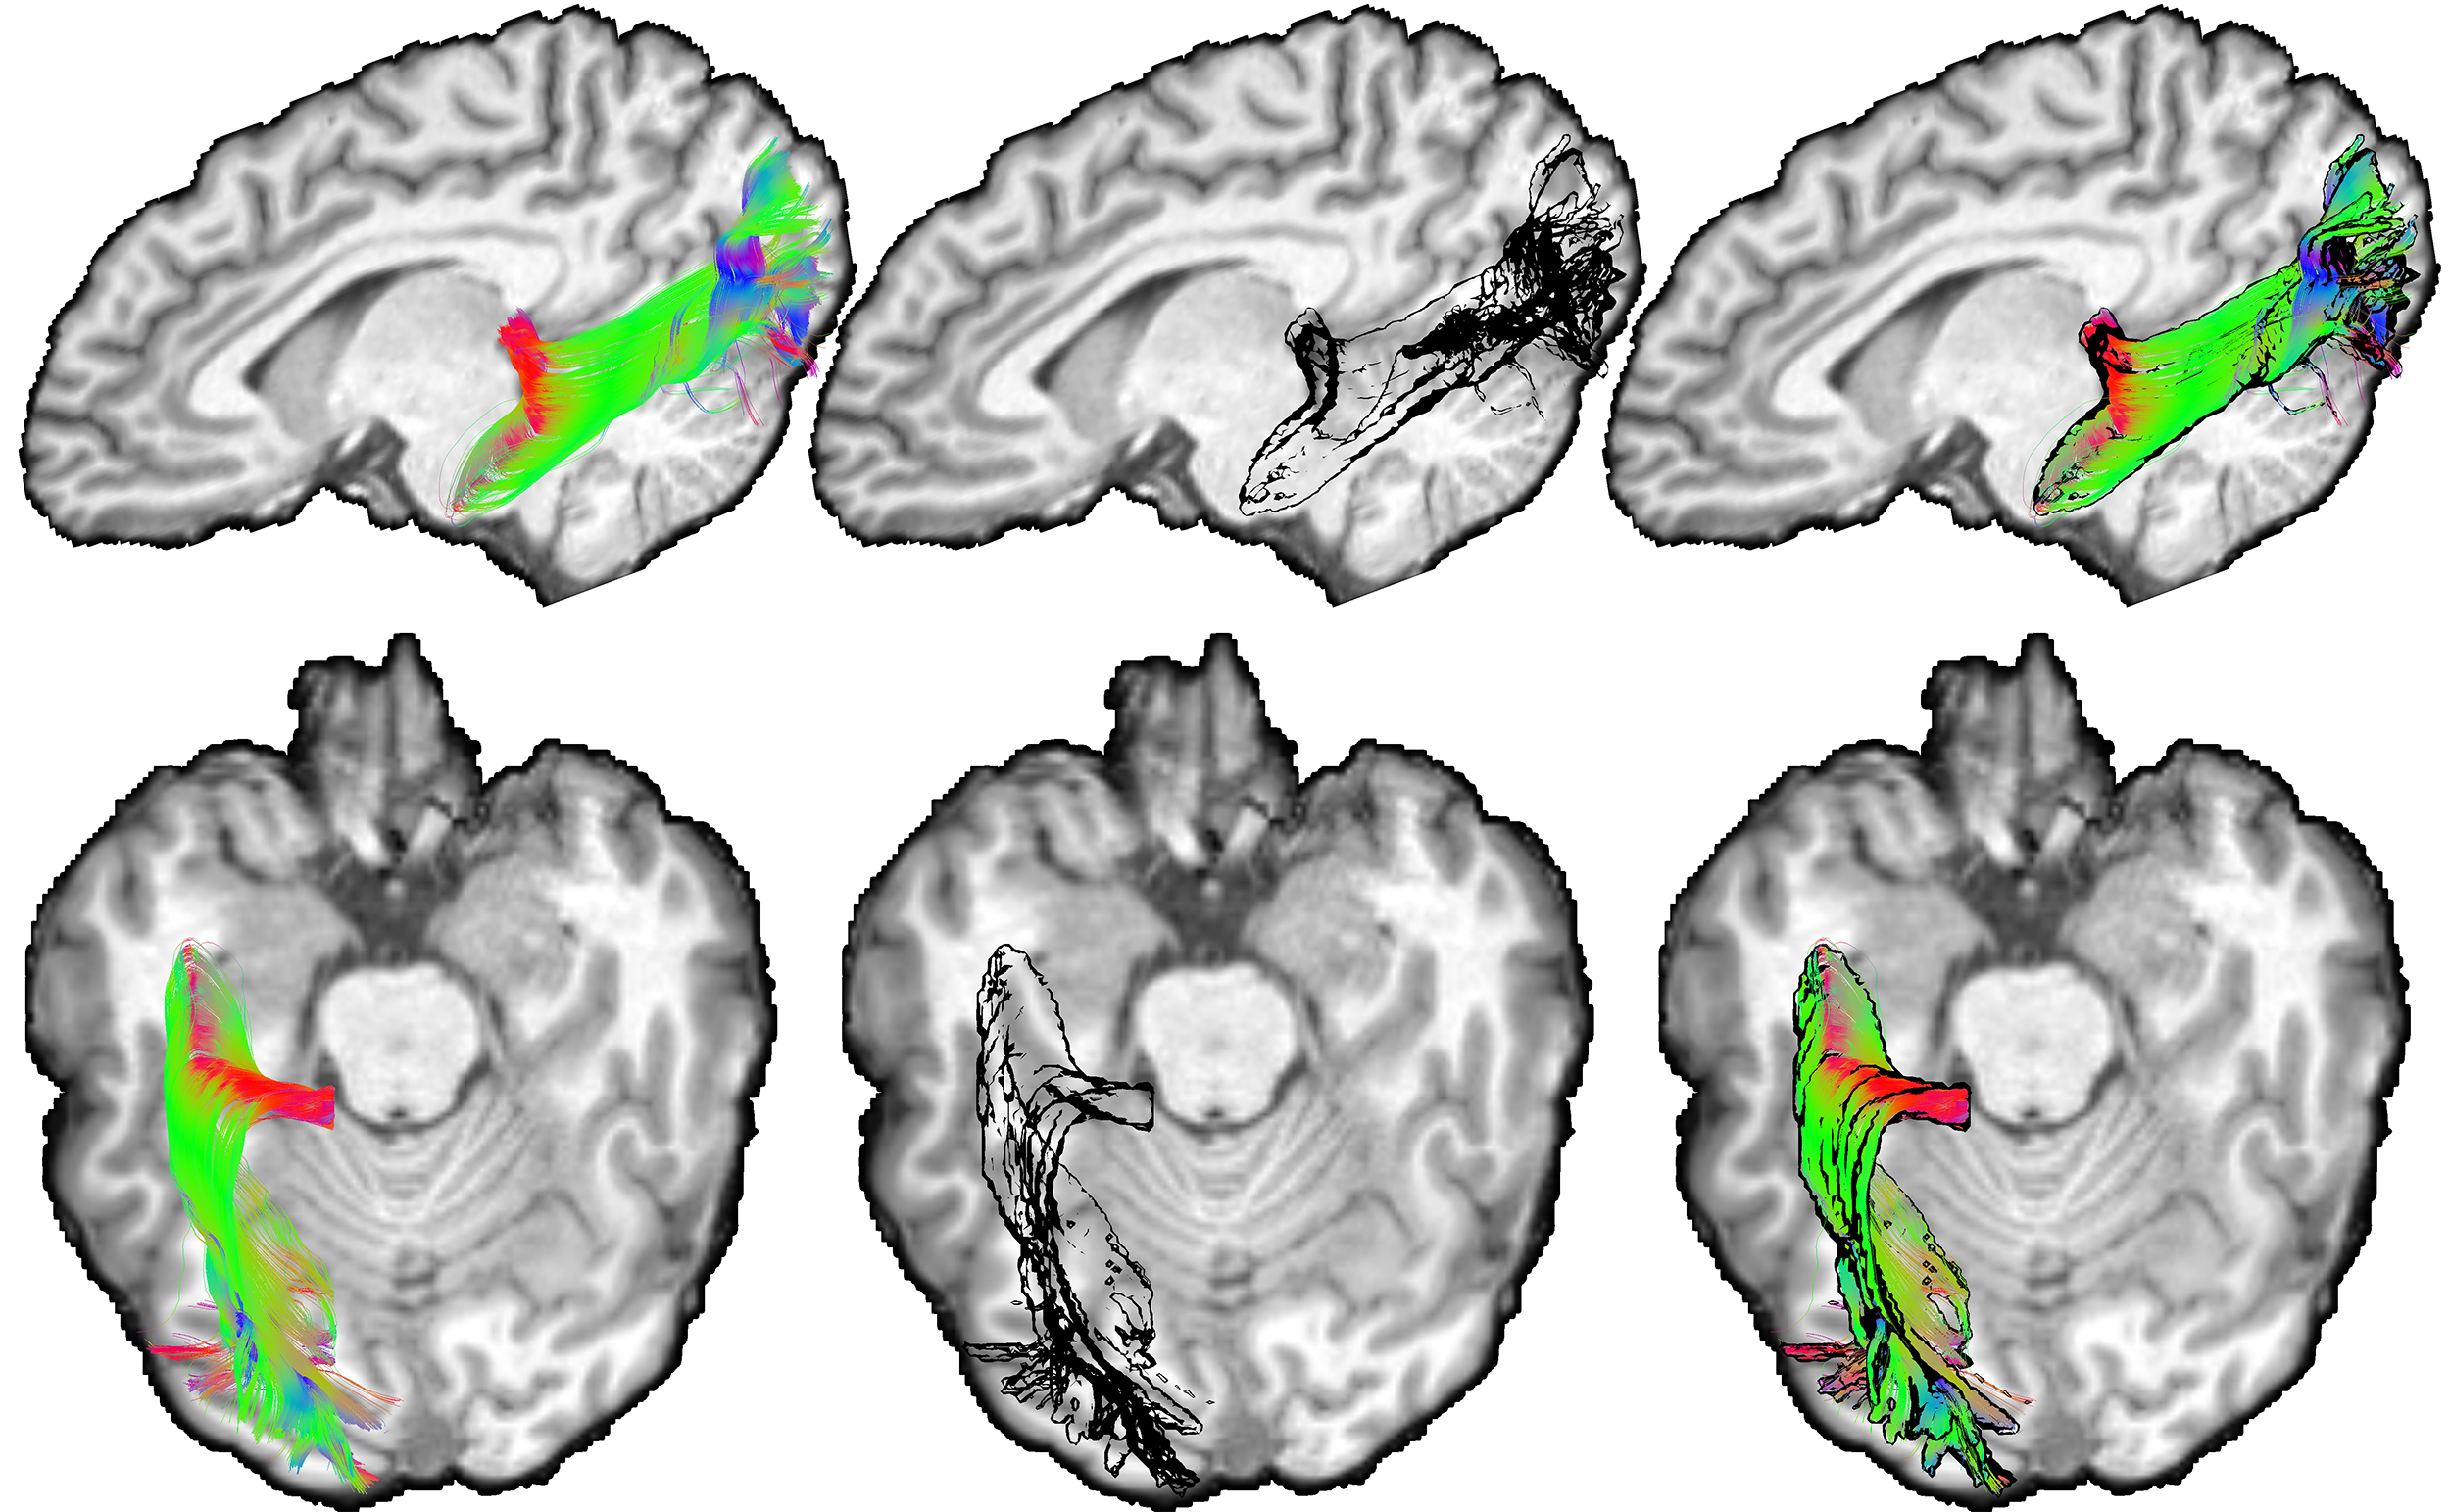
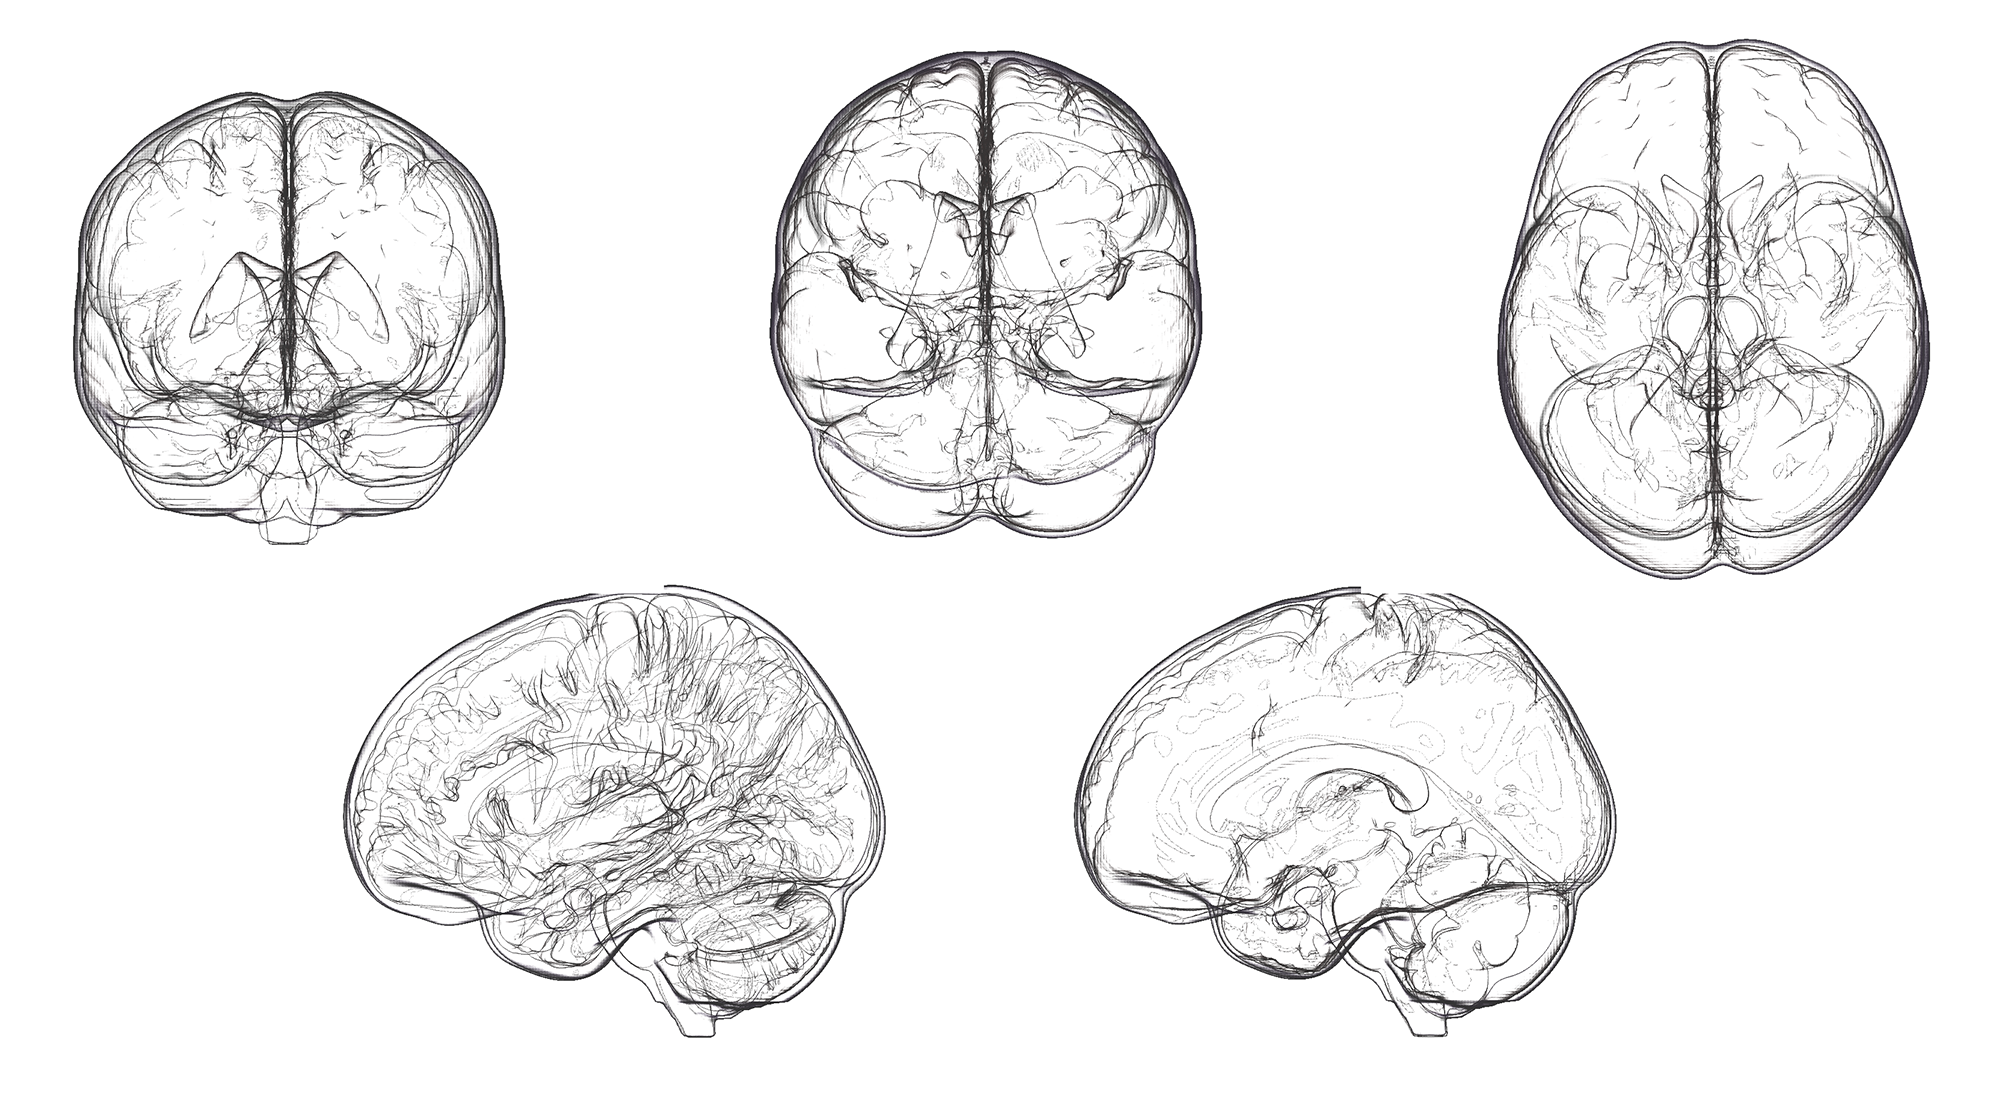
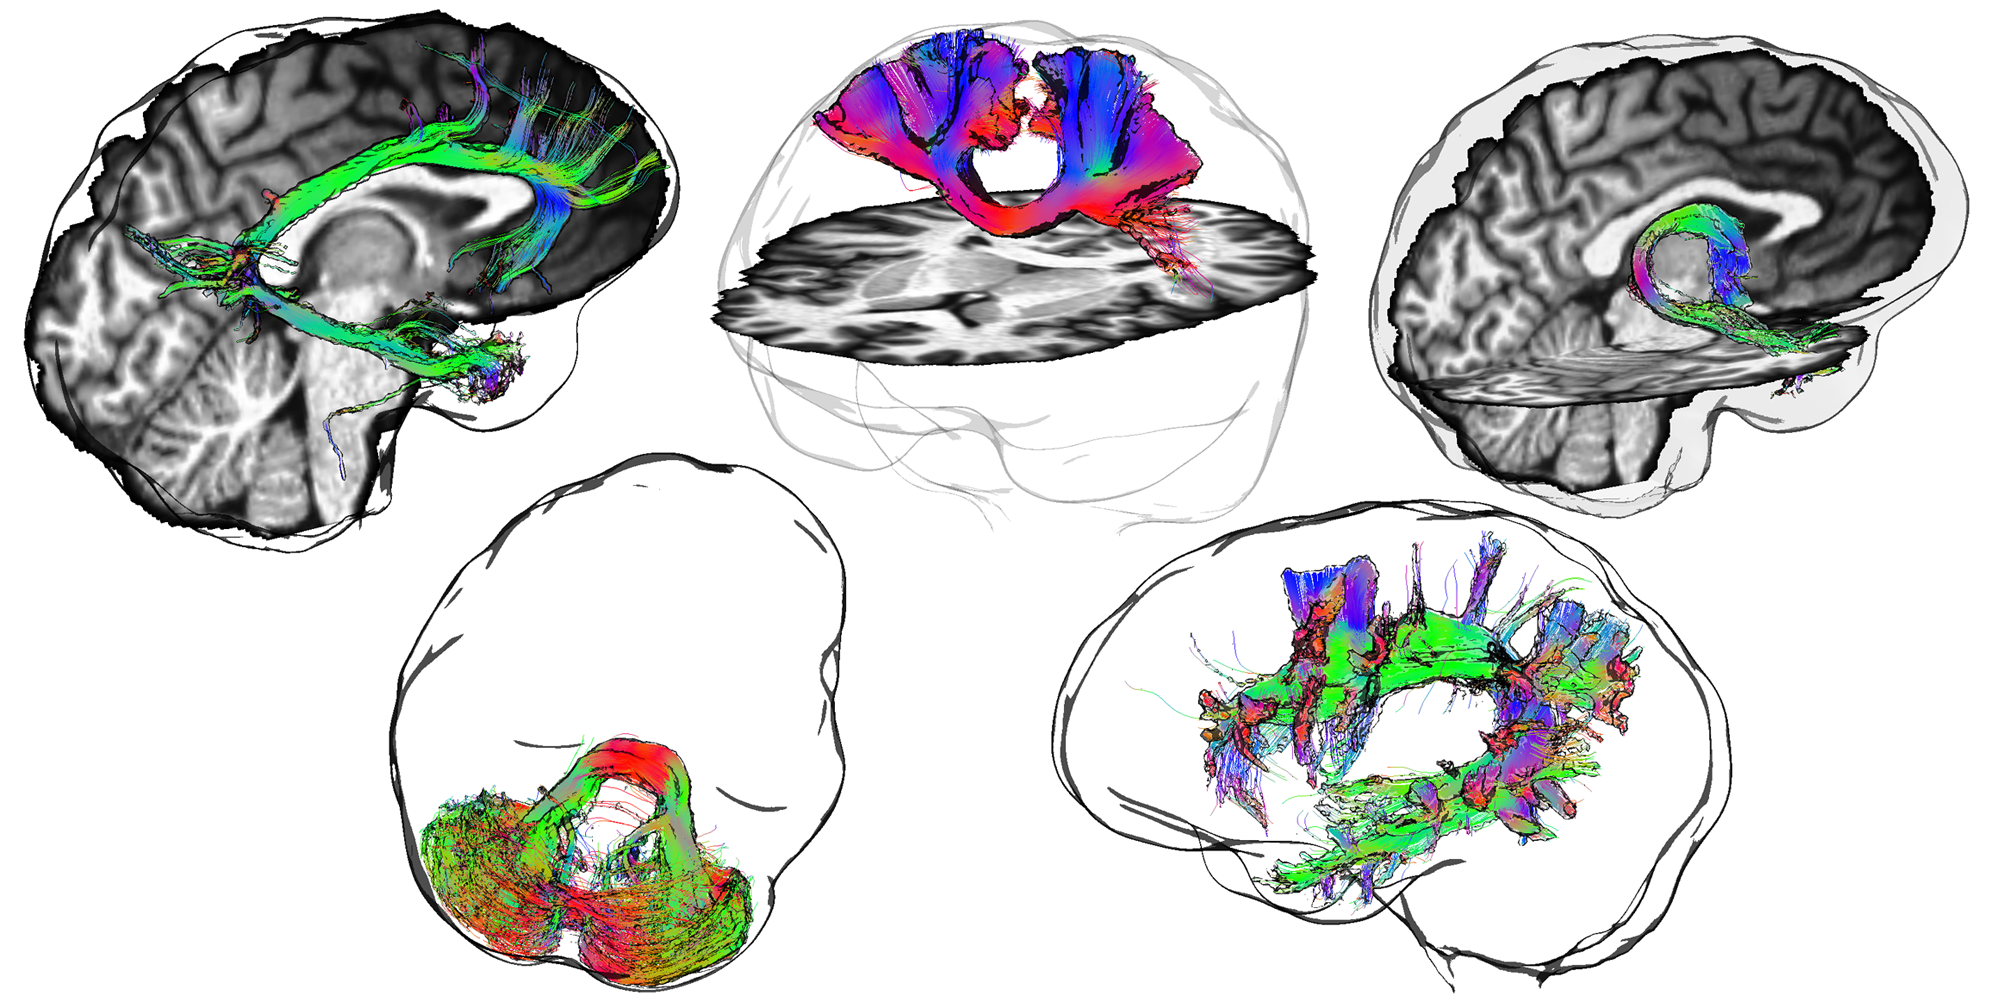
Figure 3 first illustrates the edge detection technique using a simple brain volume (MNI-152 template). A glass rendering is derived from the silhouette equation by setting t to 0.2, αedge to 0.8 (i.e. |<v, n>| < t) and αnon-edge to 0 (i.e. |<v, n>| > t). Figure 4 demonstrate the technique applied to various streamline bundles with different sizes and shape, using the same parameters as above. A visual comparison of traditional streamline rendering techniques combined with silhouette rendering is shown on Fig. 5. For a better appreciation of the orientation-dependent aspect of the technique, a short video is available online at: goo.gl/6nH47z.Discussion & Conclusions
We have presented a quick and accessible technique for enhancing bundle edges for tractography visualization. Our technique performs in real-time; meaning that the silhouette contours are constantly adapting to the view point (e.g. creating new ridges when manually rotating the brain). Although realistic rendering techniques are thought to be better for conveying 3D information, they are usually computationally expensive. Ambient occlusion has been used to circumvent this limitation in the past[10]; however, the technique is mostly suited for whole-brain tractograms. Overall, we recommend that developers of existing and future tractography visualization software packages consider providing this easy-to-implement rendering technique as an extra option for their users.Acknowledgements
The authors would like to thank the Wellcome Trust and the Natural Sciences and Engineering Research Council of Canada Postdoctoral Fellowships Program for funding this project.References
[1] Svetachov, Pjotr, Maarten H. Everts, and Tobias Isenberg. "DTI in context: illustrating brain fiber tracts in situ." Computer Graphics Forum. Vol. 29. No. 3. Blackwell Publishing Ltd, 2010.
[2] Everts, Maarten H., et al. "Depth-dependent halos: Illustrative rendering of dense line data." IEEE Transactions on Visualization and Computer Graphics 15.6 (2009).
[3] Otten, Ron, Anna Vilanova, and Huub Van De Wetering. "Illustrative white matter fiber bundles." Computer Graphics Forum. Vol. 29. No. 3. Blackwell Publishing Ltd, 2010.
[4] Goldau, Mathias, et al. "Fiber stippling: An illustrative rendering for probabilistic diffusion tractography." Biological Data Visualization (BioVis), 2011 IEEE Symposium on. IEEE, 2011.
[5] Brecheisen, Ralph, et al. "Illustrative uncertainty visualization of DTI fiber pathways." The Visual Computer 29.4 (2013): 297-309.
[6] Margulies, Daniel S., et al. "Visualizing the human connectome." NeuroImage 80 (2013): 445-461.
[7] Isenberg, Tobias. "A survey of illustrative visualization techniques for diffusion-weighted MRI tractography." Visualization and Processing of Higher Order Descriptors for Multi-Valued Data. Springer, Cham, 2015. 235-256.
[8] Preim, Bernhard, et al. "A survey of perceptually motivated 3d visualization of medical image data." Computer Graphics Forum. Vol. 35. No. 3. 2016.
[9] Lawonn, K., and Bernhard Preim. "Feature lines for illustrating medical surface models: Mathematical background and survey." Visualization in Medicine and Life Sciences III. Springer, Cham, 2016. 93-131.
[10] Eichelbaum, Sebastian, Mario Hlawitschka, and Gerik Scheuermann. "LineAO—Improved three-dimensional line rendering." IEEE Transactions on Visualization and Computer Graphics 19.3 (2013): 433-445.
Figures