5213
AFQ-Browser: Supporting reproducible human neuroscience research through browser-based visualization tools1Institute for Learning and Brain Sciences, The University of Washington, Seattle, WA, United States, 2Department of Speech and Hearing Sciences, The University of Washington, Seattle, WA, United States, 3The Department of Physics, The University of Washington, Seattle, WA, United States, 4Department of Chemical Engineering, The University of Washington, Seattle, WA, United States, 5eScience Institute, The University of Washington, Seattle, WA, United States
Synopsis
MRI research faces various challenges with regards to reproducibility: scientists are generally aware that data sharing is an important component of reproducible research, but it is not always clear how to share data in a manner that allows other researchers to understand and reproduce published findings. Here we describe AFQ-Browser, a software tool that builds an interactive website as a companion to a diffusion MRI study and leverages web-visualization technologies to create linked views between different aspects of a diffusion MRI dataset (anatomy, diffusion metrics, subject metadata). This facilitates exploratory data analysis, fueling new scientific discoveries based on previously published datasets.
Introduction
Technical advances in modern web browsers, and open-source visualization software libraries, such as D3 (1), BrainBrowser (2) XTK (3) and Mango (4) have been playing an increasingly prominent role in communicating data on a wide range of topics. In the present work, we leverage these technical developments to build a graphical user interface (GUI) that visualizes results from diffusion-weighted MRI (dMRI) studies. We focus on visualization of data analyzed using an Automated Fiber Quantification (AFQ) approach (5). This confronts two major challenges in the study of human brain connectivity: (A) Scientific reproducibility: Tables, graphs and plots that typically appear in journal articles reflect an author’s interpretation of the data, and do not suffice for meaningful reproducibility of the results. On the other hand, raw data is often large and complex, and access to it by itself, though very useful (6), does not guarantee reproducibility. AFQ-browser facilitates sharing of dimensionally-reduced portions of dMRI data, together with rich interactive data visualizations, lending itself not only to replication of original results, but to immediate and straight-forward extensions of these results, even in the hands of researchers in other disciplines. (B) Exploration of high dimensional data: Data visualization and exploration plays an integral role in scientific inquiry, even beyond communicating results from statistical tests of an a priori hypothesis. But large high-dimensional datasets of dMRI-derived white matter tissue properties, in conjunction with behavioral and demographic measures, pose a fundamental challenge for data visualization. One approach to this challenge is implementation of linked views of a data set, where interaction with a visualization of one dimension evokes a change in another visualization of the same data. By interactively exploring the relationships among different dimensions of a dataset, a researcher can develop an understanding of the principles that characterize the system without specifying an a priori model of the complex relationships that are present in the high-dimensional space.Methods
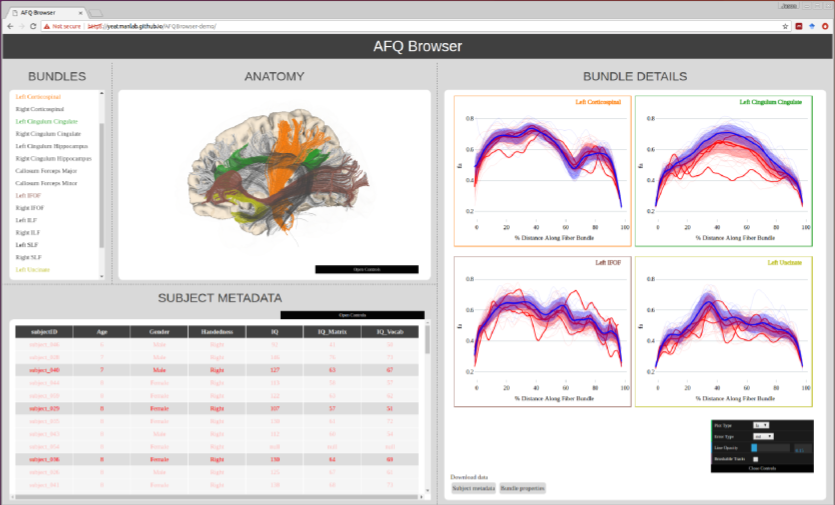
AFQ-Browser takes the output of the AFQ pipeline (5), and generates a browser-based visualization of the results (Figure 1). A command-line script, afqbrowser-assemble, extracts information from the AFQ results file, writes a series of .csv and .json files, stored in tidy formats (7), and organizes the various AFQ-Browser files into a fully-functioning AFQ-Browser website using a template of HTML and Javascript scripts. This website can be viewed locally on a user’s computer, or using another script, afqbrowser-publish, it can be packaged and automatically uploaded to Github, where it becomes publicly available on the web.Results
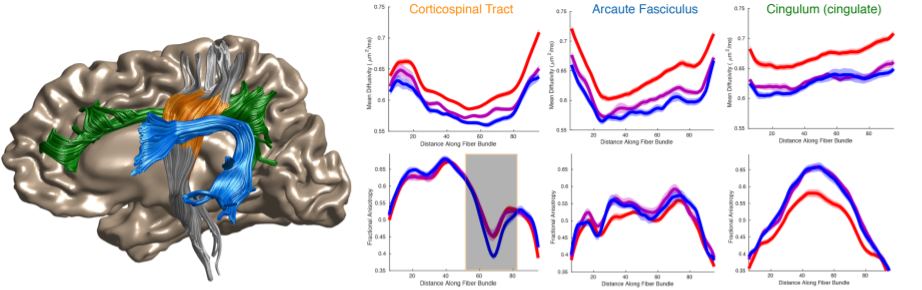
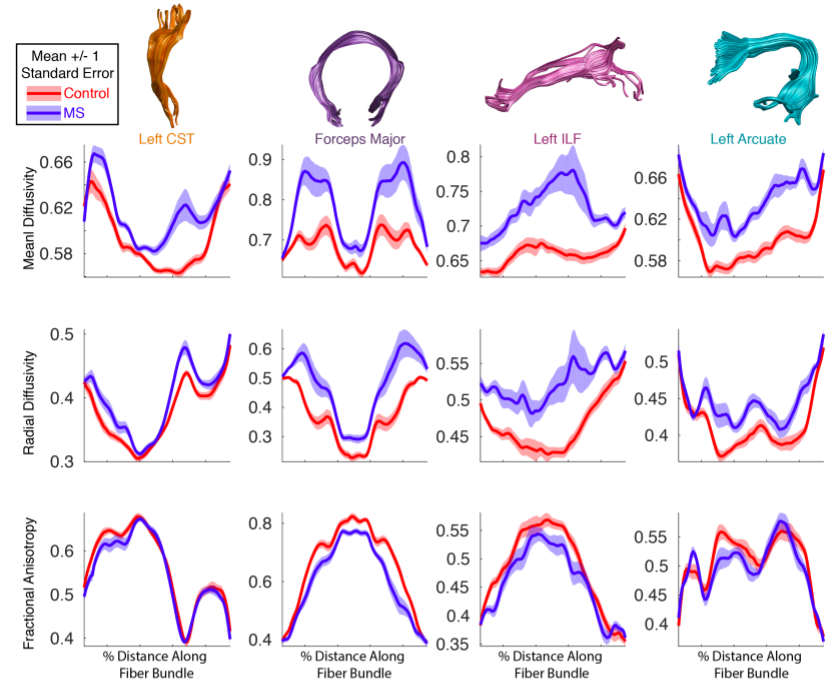
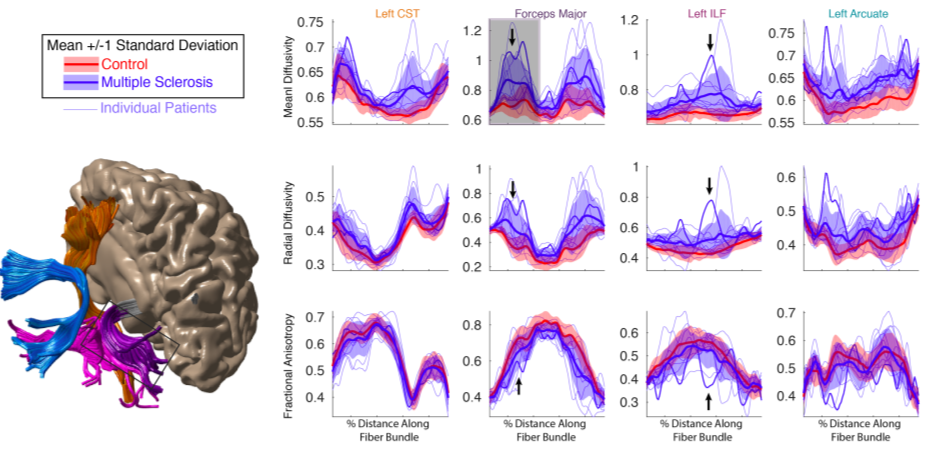
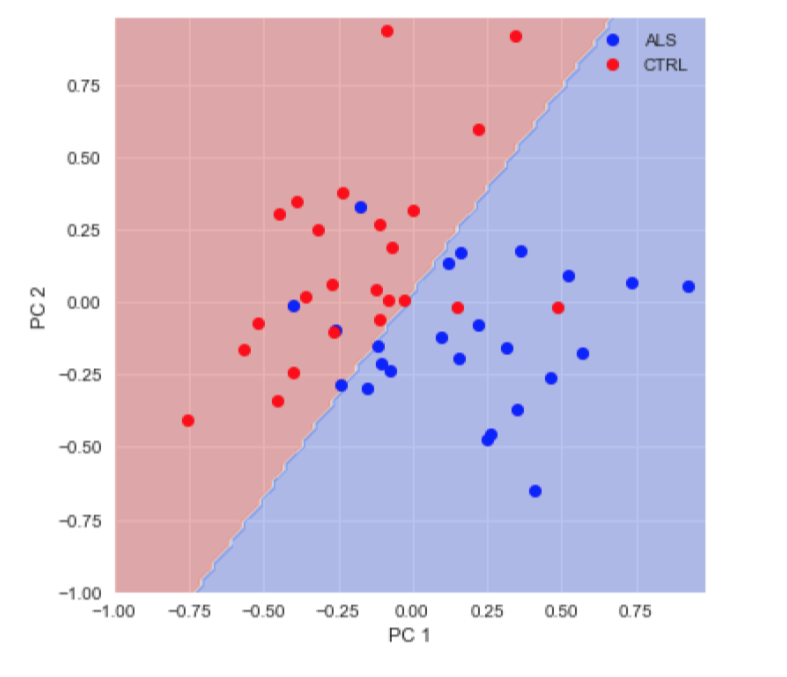
Publishing data in a convenient format supports reproducibility and fuels new scientific discoveries. For example, examining the published data from (8) in a running instance of AFQ-Browser (http://YeatmanLab.github.io/AFQBrowser-demo) we can reproduce the reported finding that mean diffusivity (MD) in the arcuate fasciculus shows more developmental change than the corticospinal tract (CST) (Figure 2). Switching the plot to fractional anisotropy (FA) rather than MD, an effect not reported in the original manuscript was observed: While the arcuate shows the expected pattern of results - FA values increase with development - the CST shows the opposite pattern of developmental change (Figure 2). Similarly, exploratory data analysis of a group comparison between patients with multiple sclerosis and healthy controls (https://jyeatman.github.io/AFQ-Browser-MSexample/) helps identify MS-related white matter lesions to specific locations in the white matter (Figure 3) and localize them within individual patients (Figure 4). Moreover, because the results are publicly available, and published in an easy-to-access format, reanalysis of published data. For example data from a dMRI study of patients with Amyotrophic Lateral Sclerosis (9)(https://yeatmanlab.github.io/Sarica_2017/) can be read into a machine learning algorithm, and mined for features that discriminate between patients and controls (Figure 5).Discussion
We present here a software tool that visualizes results from the analysis of dMRI data in an interactive website. The software facilitates exploratory data analysis through the implementation of linked views of the data. The system also facilitates reproducible research by making it easy for researchers to publish these visualizations and the underlying data as an interactive website. The publication of these results and data will allow researchers, stakeholders and other members of the general public to explore large, important datasets through a web-browser, without having to download the data, or perform the complex, and often unwieldy, processing pipeline, and opens the possibility of aggregating data among hundreds of ongoing studies.Acknowledgements
The work was funded through a grant by the Gordon & Betty Moore Foundation and the Alfred P. Sloan Foundation to the University of Washington eScience Institute. A.R.H.'s work was supported by the Department of Energy Computational Science Graduate Fellowship Program of the Office of Science and National Nuclear Security Administration in the Department of Energy under contract DE-FG02-97ER25308. A.K is supported by a Washington Research Foundation fellowship through the University of Washington eScience Institute and through the University of Washington Institute for Neuroengineering. We would like to thank Jeff Heer, for providing the original impetus for this work, as an assignment in his class on data visualization. We thank Parmita Mehta and Zac Lin for their work on the prototype of AFQ-Browser. Finally, we would like to thank the authors that contributed the public datasets discussed in this abstract: Sarica A., Cerasa A., Valentino P., Trotta M., Barone S., Granata A., Nisticò R., Perrotta P., Pucci F., Quattrone A., Mezer A., Wandell B.A.References
1. Bostock M, Ogievetsky V, Heer J. D3: Data-Driven Documents. IEEE Trans. Vis. Comput. Graph. 2011;17:2301–2309.
2. Sherif T, Kassis N, Rousseau M-É, Adalat R, Evans AC. BrainBrowser: distributed, web-based neurological data visualization. Front. Neuroinform. 2014;8:89.
3. Hähn D, Rannou N, Ahtam B, Ellen Grant P, Pienaar R. Neuroimaging in the browser using the X Toolkit. 2012. doi: 10.7490/f1000research.1092491.1.
4. Lancaster JL, McKay DR, Cykowski MD, Martinez MJ, Tan X, Valaparla S, Zhang Y, Fox PT. Automated analysis of fundamental features of brain structures. Neuroinformatics 2011;9:371–380.
5. Yeatman JD, Dougherty RF, Myall NJ, Wandell BA, Feldman HM. Tract profiles of white matter properties: automating fiber-tract quantification. PLoS One 2012;7:e49790.
6. Poline J-B, Breeze JL, Ghosh S, et al. Data sharing in neuroimaging research. Front. Neuroinform. 2012;6:9.
7. Wickham H. Tidy Data. J. Stat. Softw. [Internet] 2014;59. doi: 10.18637/jss.v059.i10.
8. Yeatman JD, Wandell BA, Mezer AA. Lifespan maturation and degeneration of human brain white matter. Nat. Commun. 2014;5:4932.
9. Sarica A, Cerasa A, Valentino P, et al. The corticospinal tract profile in amyotrophic lateral sclerosis. Hum. Brain Mapp. 2017;38:727–739.
Figures