5212
Reproducibility of Human Diffusion Connectomes Generated from Different Atlases: A Multicenter Study1Center for Brain Imaging Science and Technology, Department of Biomedical Engineering, Zhejiang University, Hangzhou, China, 2Department of Radiology, Xuanwu Hospital, Capital Medical University, Beijing, China, 3MR Collaboration NE Asia, Siemens Healthcare, Beijing, China, 4MR Collaboration NE Asia, Siemens Healthcare, Shanghai, China
Synopsis
In a multicenter study, high reproducibility among centers is essential. However, the construction of diffusion connectomes requires multiple complex steps. Errors may be easily hidden in the connectome matrix and possible deteriorate the intrinsic neural network analysis. The registration and parcellation based on the brain template are the final steps and are vital to the connectome matrix. A different anatomical and functional image-based atlas may produce variable reproducibility in diffusion connectome matrices. In this work, seven frequently used atlases were compared to test the reproducibility of different templates.
Introduction
The construction of diffusion connectomes is generally complicated. However, the outcome in a matrix form is relatively simple, but can hide errors or biases and affect the reproducibility in subsequent analyses in multicenter studies. Researchers have previously compared different diffusion models,1 fiber-tracking algorithms,2 and resolutions of cortical parcellation3 when generating the connectivity matrix to find a robust processing pipeline. In the processing procedure, registration and fiber parcellation based on the cortical atlas are the final steps and are vital to generation of the connectome matrix. The application of templates generated from different populations could potentially produce improper registration to individual data. Moreover, different atlases may produce different reproducibility in the connectome matrices.
In this work, two typical templates and seven frequently used atlases were utilized for registration and cortical parcellation in order to evaluate the reproducibility of connectome matrices. The images were acquired from same subjects at eight MR facilities using the same hardware and software setup, and all the data were processed with same procedure before parcellation.
Methods
Data acquisition was performed at eight centers on MAGNETOM Prisma 3T scanners using a 64-channel head-neck coil (Siemens Healthcare, Erlangen, Germany). The same protocol and the same three healthy volunteers were scanned in all centers within a month.
Diffusion images were obtained using a prototype simultaneous-multi-slice diffusion EPI sequence4 (TR/TE=5.4s/71ms, voxel size=1.5x1.5x1.5mm3). The diffusion scheme contained 90 directions on three shells (b-value=1000, 2000, and 3000s/mm²) with global uniform coverage5. Pre-processing was implemented in FSL (FMRIB software library, University of Oxford, UK). MRtrix software (Brain Research Institute, Melbourne, Australia) was used for the multi-shell multi-tissue ODF calculation6, and anatomically-constrained tractography7 and spherical-deconvolution informed filtering8 were subsequently performed to track 500,000 fibers in the whole brain.
The T1-weighted images were normalized by FreeSurfer (Athinoula A. Martinos Center for Biomedical Imaging, Harvard-MIT, US), before being transformed into the diffusion space using FSL. Two templates were registered into individual space with 12 degrees of freedom. One was the CHINA2020, generated based on 2020 Chinese datasets9, and the other was the ICBM152, generated based on 152 European datasets10. Connectome matrices were then generated based on AAL11 and Brodmann12 atlases, before the connections were normalized by $$normC_{i,j}=\frac{2}{V_{i}+V_{j}}\sum_{f\in C_{i,j}}\frac{1}{l(f)}$$ to avoid linear bias13, where $$$i$$$ and $$$j$$$ denote two regions, $$$V$$$ denotes the area of the region, and $$$l$$$ denotes the length of the fibers connecting these two regions.
Moreover, other cortical atlases with different parcellations, including the Yeo201114, Desikan-Killiany15, Fan201616, Gordon201417, and Glasser201618 were also used to generate corresponding connectome matrices with identical templates for the registration. To compare the reproducibility of each atlas, the intra-class correlation coefficient (ICC) was calculated for all the matrices using the equation $$ICC=\frac{MS_{within}-MS_{mean}}{MS_{within}+(MS_{between}-MS_{mean})/n}$$ where $$$MS$$$ is the mean square, with the subscripts denoting the within-subject and between-subject, and $$$n$$$ denotes the number of scans. An ICC higher than 0.5 indicates good reproducibility.
Results and Discussion
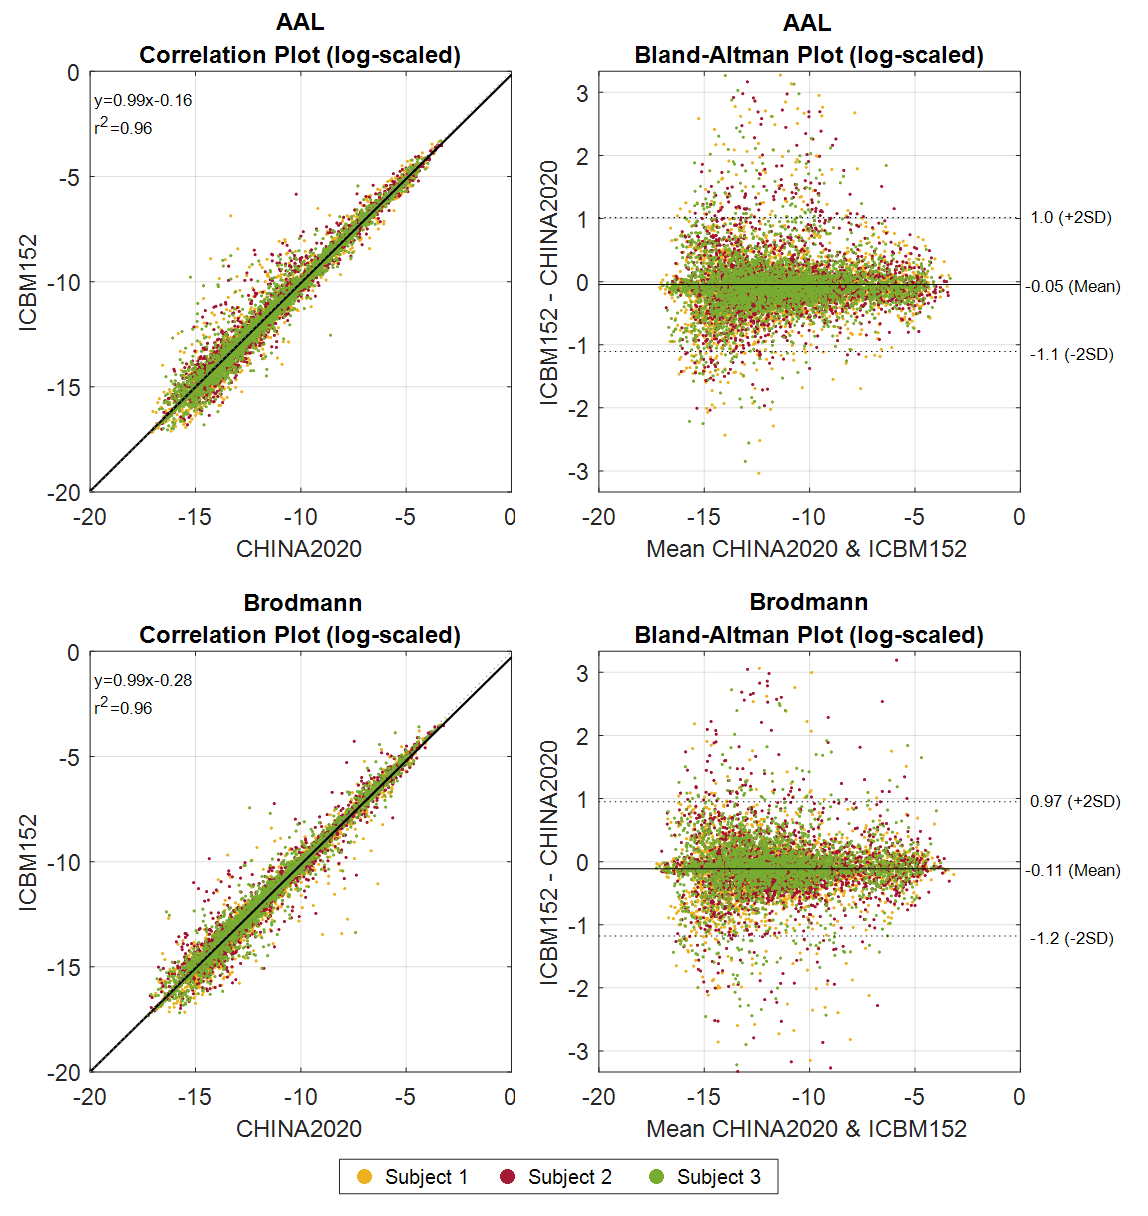
To compare the outcomes of the CHINA2020 and ICBM152 templates, the differences between the connectome matrices based on atlases from AAL and Brodmann parcellations are plotted in Figure 1. The connectivity is averaged among all the measures of each subject. Correlation plots for both atlas (left) show that the connectivity is linearly correlated between the ICBM152 and CHINA2020. In both Bland-Altman plots19, the connectivity values in ICBM152 are lower than in CHINA2020. Connections with high connectivity show less disparity than those with low connectivity. Since all subjects are Chinese in this study, this result indicates that using the CHINA2020 template, which is generated from the same race, would indeed preserve more fibers and shows a higher connectivity after the registration and parcellation.
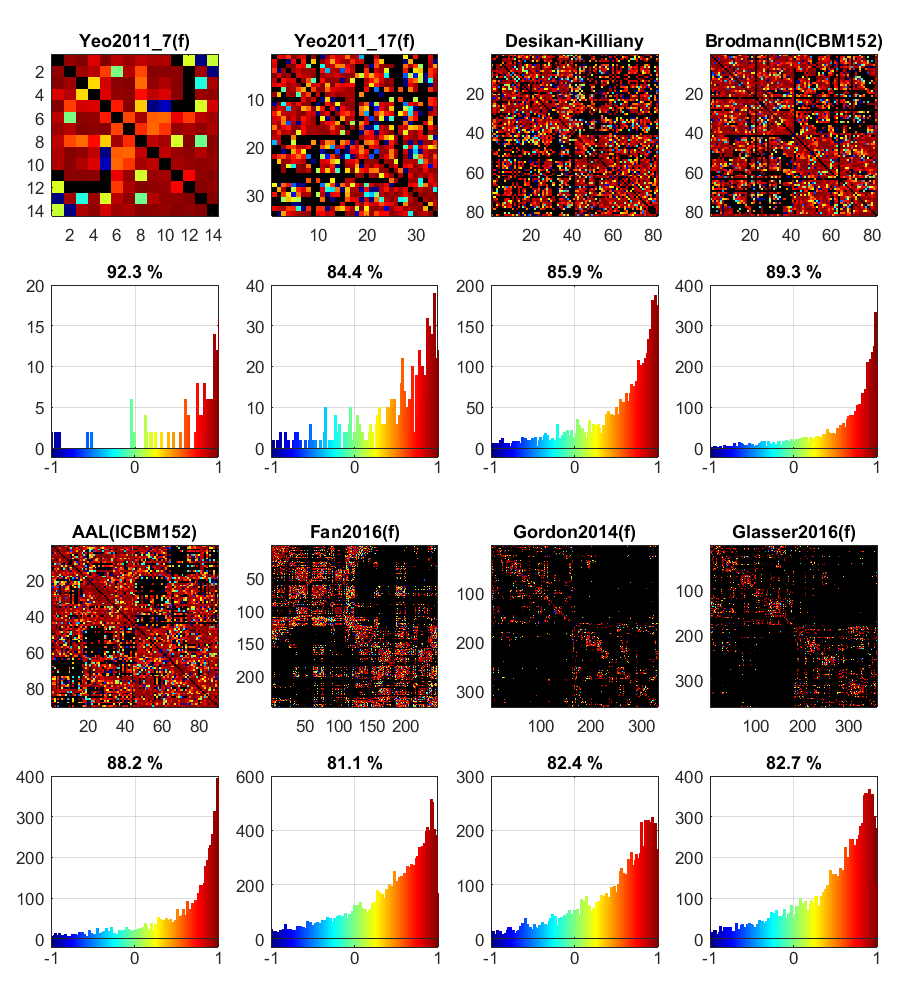
The ICC matrices of different cortical atlases and their corresponding histograms are shown in Figure 2. Comparing the two Yeo2011 atlases with different parcellation resolutions, the lower-resolution atlas shows a higher ratio of high-reproducibility connections. For regions with larger area, it is easier to avoid registration errors. As the number of parcellations increases, such as in the atlases with over 200 nodes, the ratio of high reproducibility would decrease, indicating occurrence of more registration errors. Moreover, the atlases based on the resting-state fMRI data are less reproducible than the anatomical atlases, since the pattern of fiber cluster likely represents different features with the pattern of functional activity, more effective fiber parcellation approaches are preferred for generating more robust diffusion connectivity networks.
Conclusion
For the generation of the diffusion connectome matrix, the proper template would have higher connectivity, and an atlas based on anatomical parcellations would generate the multicenter connectome with a higher reproducibility than that from fMRI-based atlas.Acknowledgements
This work was supported by the National Key R&D Program of China (2017YFC0909200), National Natural Science Foundation of China (81401473, 91632109) and the Fundamental Research Funds for the Central Universities (2017QNA5016).References
- Prčkovska V, Rodrigues P, Puigdellivol Sanchez A, et al. Reproducibility of the Structural Connectome Reconstruction across Diffusion Methods. J Neuroimaging. 2016;26(1):46-57.
- Bonilha L, Gleichgerrcht E, Fridriksson J, et al. Reproducibility of the structural brain connectome derived from diffusion tensor imaging. PLoS One. 2015;10(9):1-17.
- Cammoun L, Gigandet X, Meskaldji D, et al. Mapping the human connectome at multiple scales with diffusion spectrum MRI. J Neurosci Methods. 2012;203(2):386-397.
- Setsompop K, Gagoski BA, Polimeni JR, Witzel T, Wedeen VJ, Wald LL. Blipped-controlled aliasing in parallel imaging for simultaneous multislice echo planar imaging with reduced g-factor penalty. Magn Reson Med. 2012;67(5):1210-1224.
- Caruyer E, Lenglet C, Sapiro G, Deriche R. Design of multishell sampling schemes with uniform coverage in diffusion MRI. Magn Reson Med. 2013;69(6):1534-1540.
- Jeurissen B, Tournier JD, Dhollander T, Connelly A, Sijbers J. Multi-tissue constrained spherical deconvolution for improved analysis of multi-shell diffusion MRI data. Neuroimage. 2014;103:411-426.
- Smith RE, Tournier JD, Calamante F, Connelly A. Anatomically-constrained tractography: Improved diffusion MRI streamlines tractography through effective use of anatomical information. Neuroimage. 2012;62(3):1924-1938.
- Smith RE, Tournier JD, Calamante F, Connelly A. SIFT: Spherical-deconvolution informed filtering of tractograms. Neuroimage. 2013;67:298-312.
- Liang P, Shi L, Chen N, et al. Construction of brain atlases based on a multi-center MRI dataset of 2020 Chinese adults. Sci Rep. 2016;5(1):18216.
- Fonov V, Evans AC, Botteron K, Almli CR, McKinstry RC, Collins DL. Unbiased average age-appropriate atlases for pediatric studies. Neuroimage. 2011;54(1):313-327.
- Tzourio-Mazoyer N, Landeau B, Papathanassiou D, et al. Automated Anatomical Labeling of Activations in SPM Using a Macroscopic Anatomical Parcellation of the MNI MRI Single-Subject Brain. Neuroimage. 2002;15(1):273-289.
- Brodmann K. Vergleichende Lokalisationslehre der Grosshirnrinde. J Nerv Ment Dis. 1910;37(12):783-784.
- Hagmann P, Kurant M, Gigandet X, et al. Mapping human whole-brain structural networks with diffusion MRI. PLoS One. 2007;2(7).
- Yeo BTT, Krienen FM, Sepulcre J, et al. The organization of the human cerebral cortex estimated by intrinsic functional connectivity. J Neurophysiol. 2011;106:1125-1165.
- Desikan RS, Ségonne F, Fischl B, et al. An automated labeling system for subdividing the human cerebral cortex on MRI scans into gyral based regions of interest. Neuroimage. 2006;31(3):968-980.
- Fan L, Li H, Zhuo J, et al. The Human Brainnetome Atlas: A New Brain Atlas Based on Connectional Architecture. Cereb Cortex. 2016;26(8):3508-3526.
- Gordon EM, Laumann TO, Adeyemo B, Huckins JF, Kelley WM, Petersen SE. Generation and Evaluation of a Cortical Area Parcellation from Resting-State Correlations. Cereb Cortex. 2016;26(1):288-303.
- Glasser MF, Coalson TS, Robinson EC, et al. A multi-modal parcellation of human cerebral cortex. Nature. 2016;536(7615):171-178.
- Martin Bland J, Altman D. Statistical Methods for Assessing Agreement between Two Methods of Clinical Measurement. Lancet. 1986;327(8476):307-310.
Figures