5210
Are Brain Networks Reproducible across Sites?1Radiology, University of Pennsylvania, Philadelphia, PA, United States, 2Psychiatry, University of Pennsylvania, Philadelphia, PA, United States
Synopsis
The field of connectomics has introduced new computational tools to the system neuroscience domain, facilitating novel investigations into the mechanisms of the human brain. While methodological advancements in connectomics have found numerous applications with exciting interpretations, a systematic analysis on the reliability and reproducibility of the results and inferences drawn from the findings is still missing. We aim to fill this gap by studying the reproducibility of connectomics findings on diffusion data that has been collected at different sites with varying acquisition protocols. Structural network properties at local, meso, and global scales were investigated to determine what is different and what is preserved in the presence of site related variation. Our comprehensive investigation revealed that despite significant differences between local and global properties, the topological features were mostly preserved.
Purpose
Investigating the structural connectivity, non-invasively, using diffusion MRI has revealed features of brain architectures that prove to be related to learning, sex differences, and disease processes. However, there is a significant need to quantify the reliability of structural network markers in clinical studies and identify whether the interpretations made from the connectomic analysis are site dependent. Due to the well-known challenges in patients recruiting and strict regulations, utilizing data from different sites is key for increasing the validity of statistical conclusions about observations and biomarkers. Thus, a careful investigation of the variations across sites is necessary for meaningful and consistent interpretation of findings. That is, if similar data were collected across different sites, with the known variation in diffusion protocols, which connectomic measures provide similar interpretation across sites? What is expected to be preserved? At what level do changes emerge? In this study, we undertake a comprehensive investigation of properties of brain networks acquired at different sites using different acquisition protocols, in order to determine heterogeneity of findings in regards to local, meso and global scale features of the networks.Methods
1- Datasets: The network properties are investigated on two datasets that are age and sex matched:
Site1: 95 healthy subjects from the Philadelphia Neurodevelopmental Cohort1 (TR/TE=8100/82ms, b=1000s/mm2 , 64 weighted diffusion gradients, and a spatial resolution of 1.875x1.875x2mm).
Site2: 95 healthy subjects that served as controls for an autism spectrum disorder study2 (TR/TE=11,000/76ms, b=1000s/mm2, 30 weighted diffusion gradients, and 2mm isotropic spatial resolution).
2- Creation of Structural Connectomes: Brains were parcellated into 86 cortical and subcortical regions of the Desikan-Killiany atlas3. Probabilistic tracking was carried out between each pair of ROIs with default parameters (2 fibers per voxel, 5000 individual pathways). As such, an 86x86 connectivity matrix was constructed for each subject. The edge weights were the raw number of streamlines connecting ROIs. In order to study the dependence of results on thresholding choices, we used multiple threshold levels, resulting in network densities between 0.10 and 0.30. Binary representations at each density level were obtained.
3- Network Properties that are investigated: This analysis was carried at three levels: global, local, and meso scales, for both weighted and binary graphs:
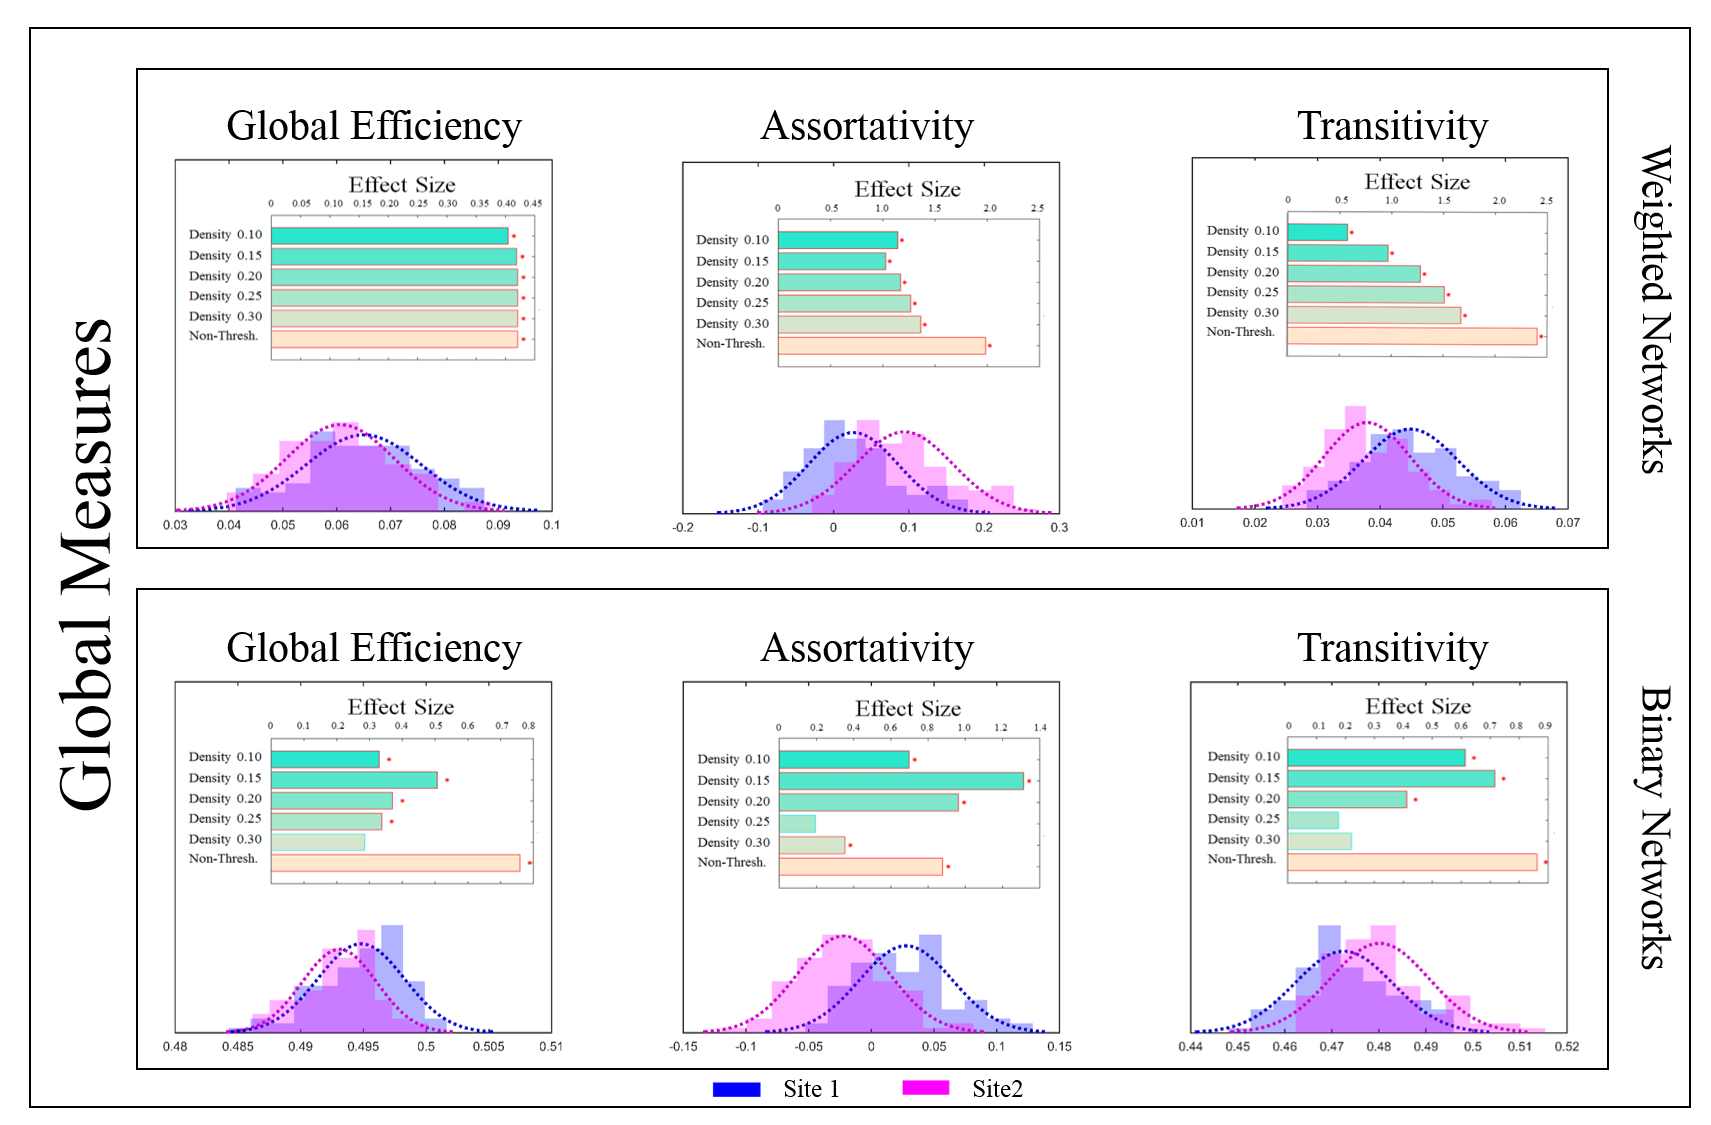
a-Global: We computed three measures: global efficiency, assortativity, and transitivity4 (Fig.1).
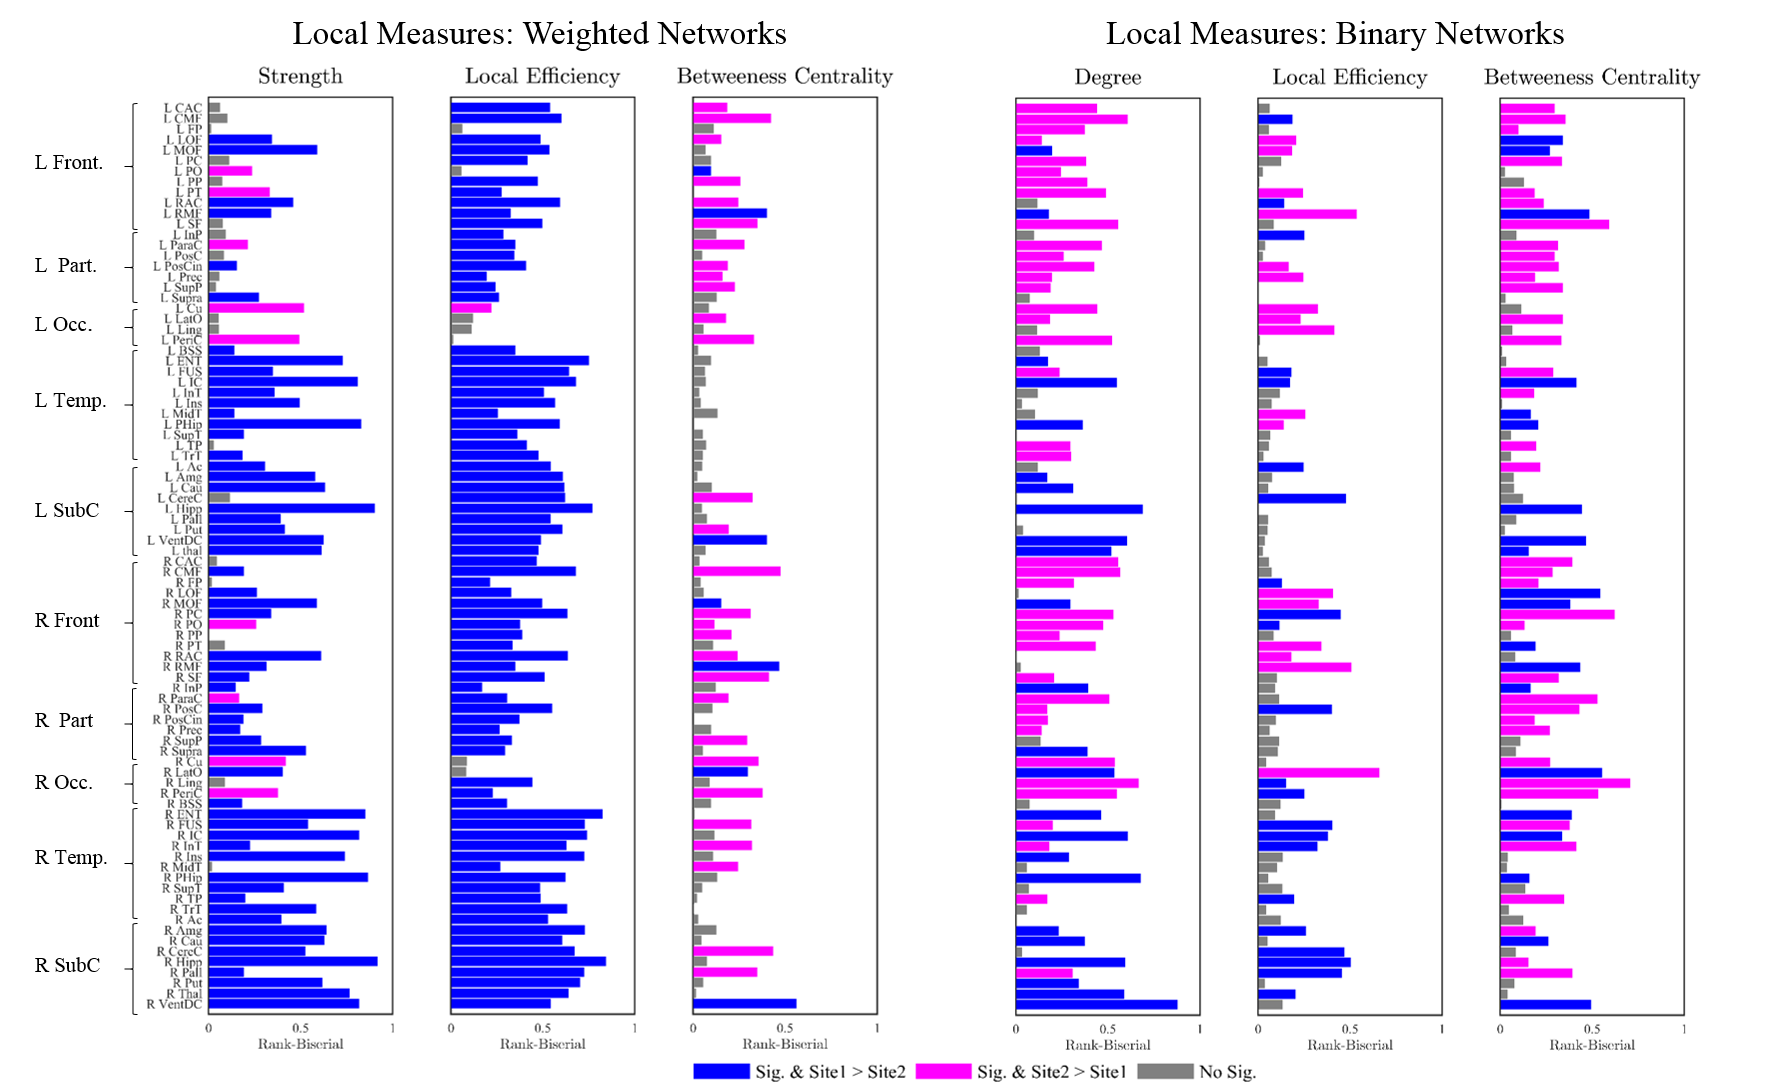
b-Local: We computed node degree/strength, local efficiency, and betweenness centrality for every node4 (Fig.2).
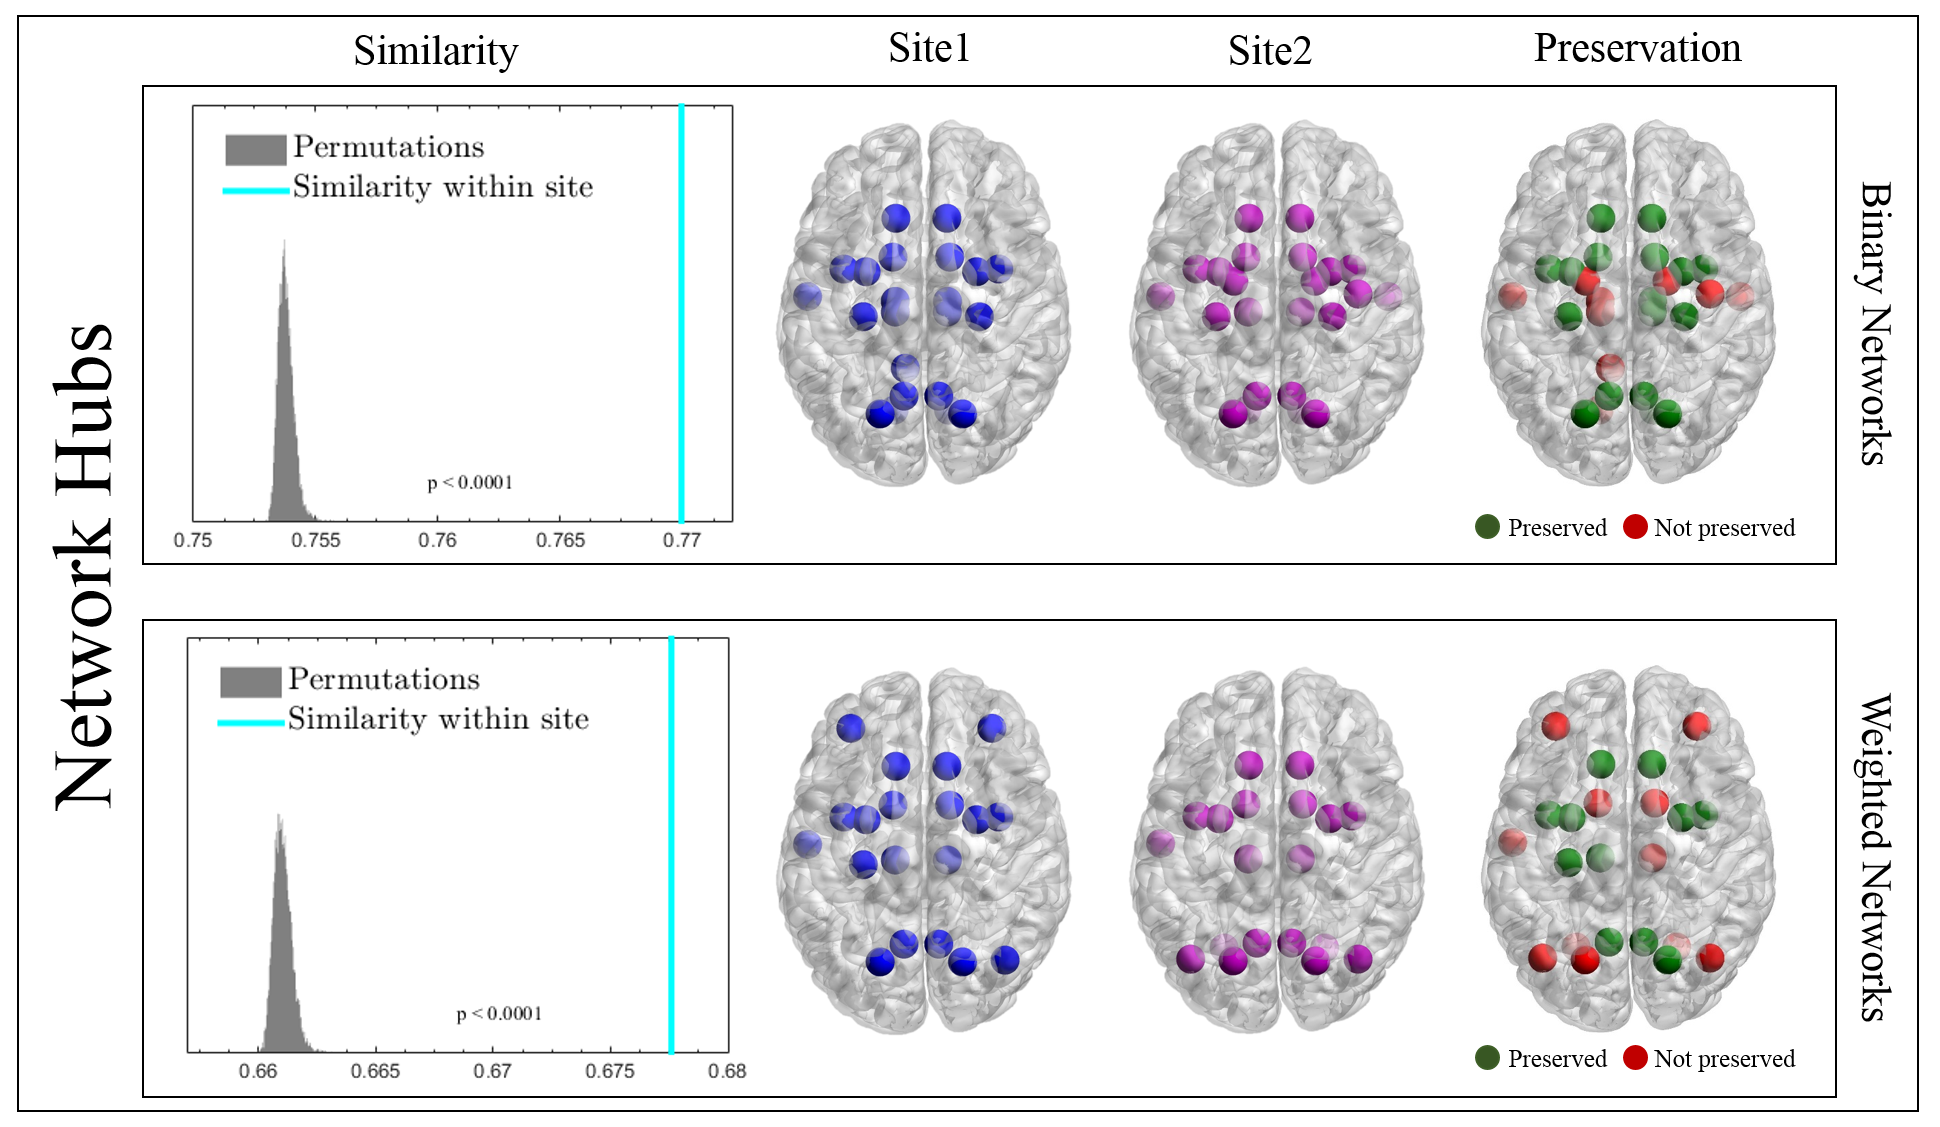
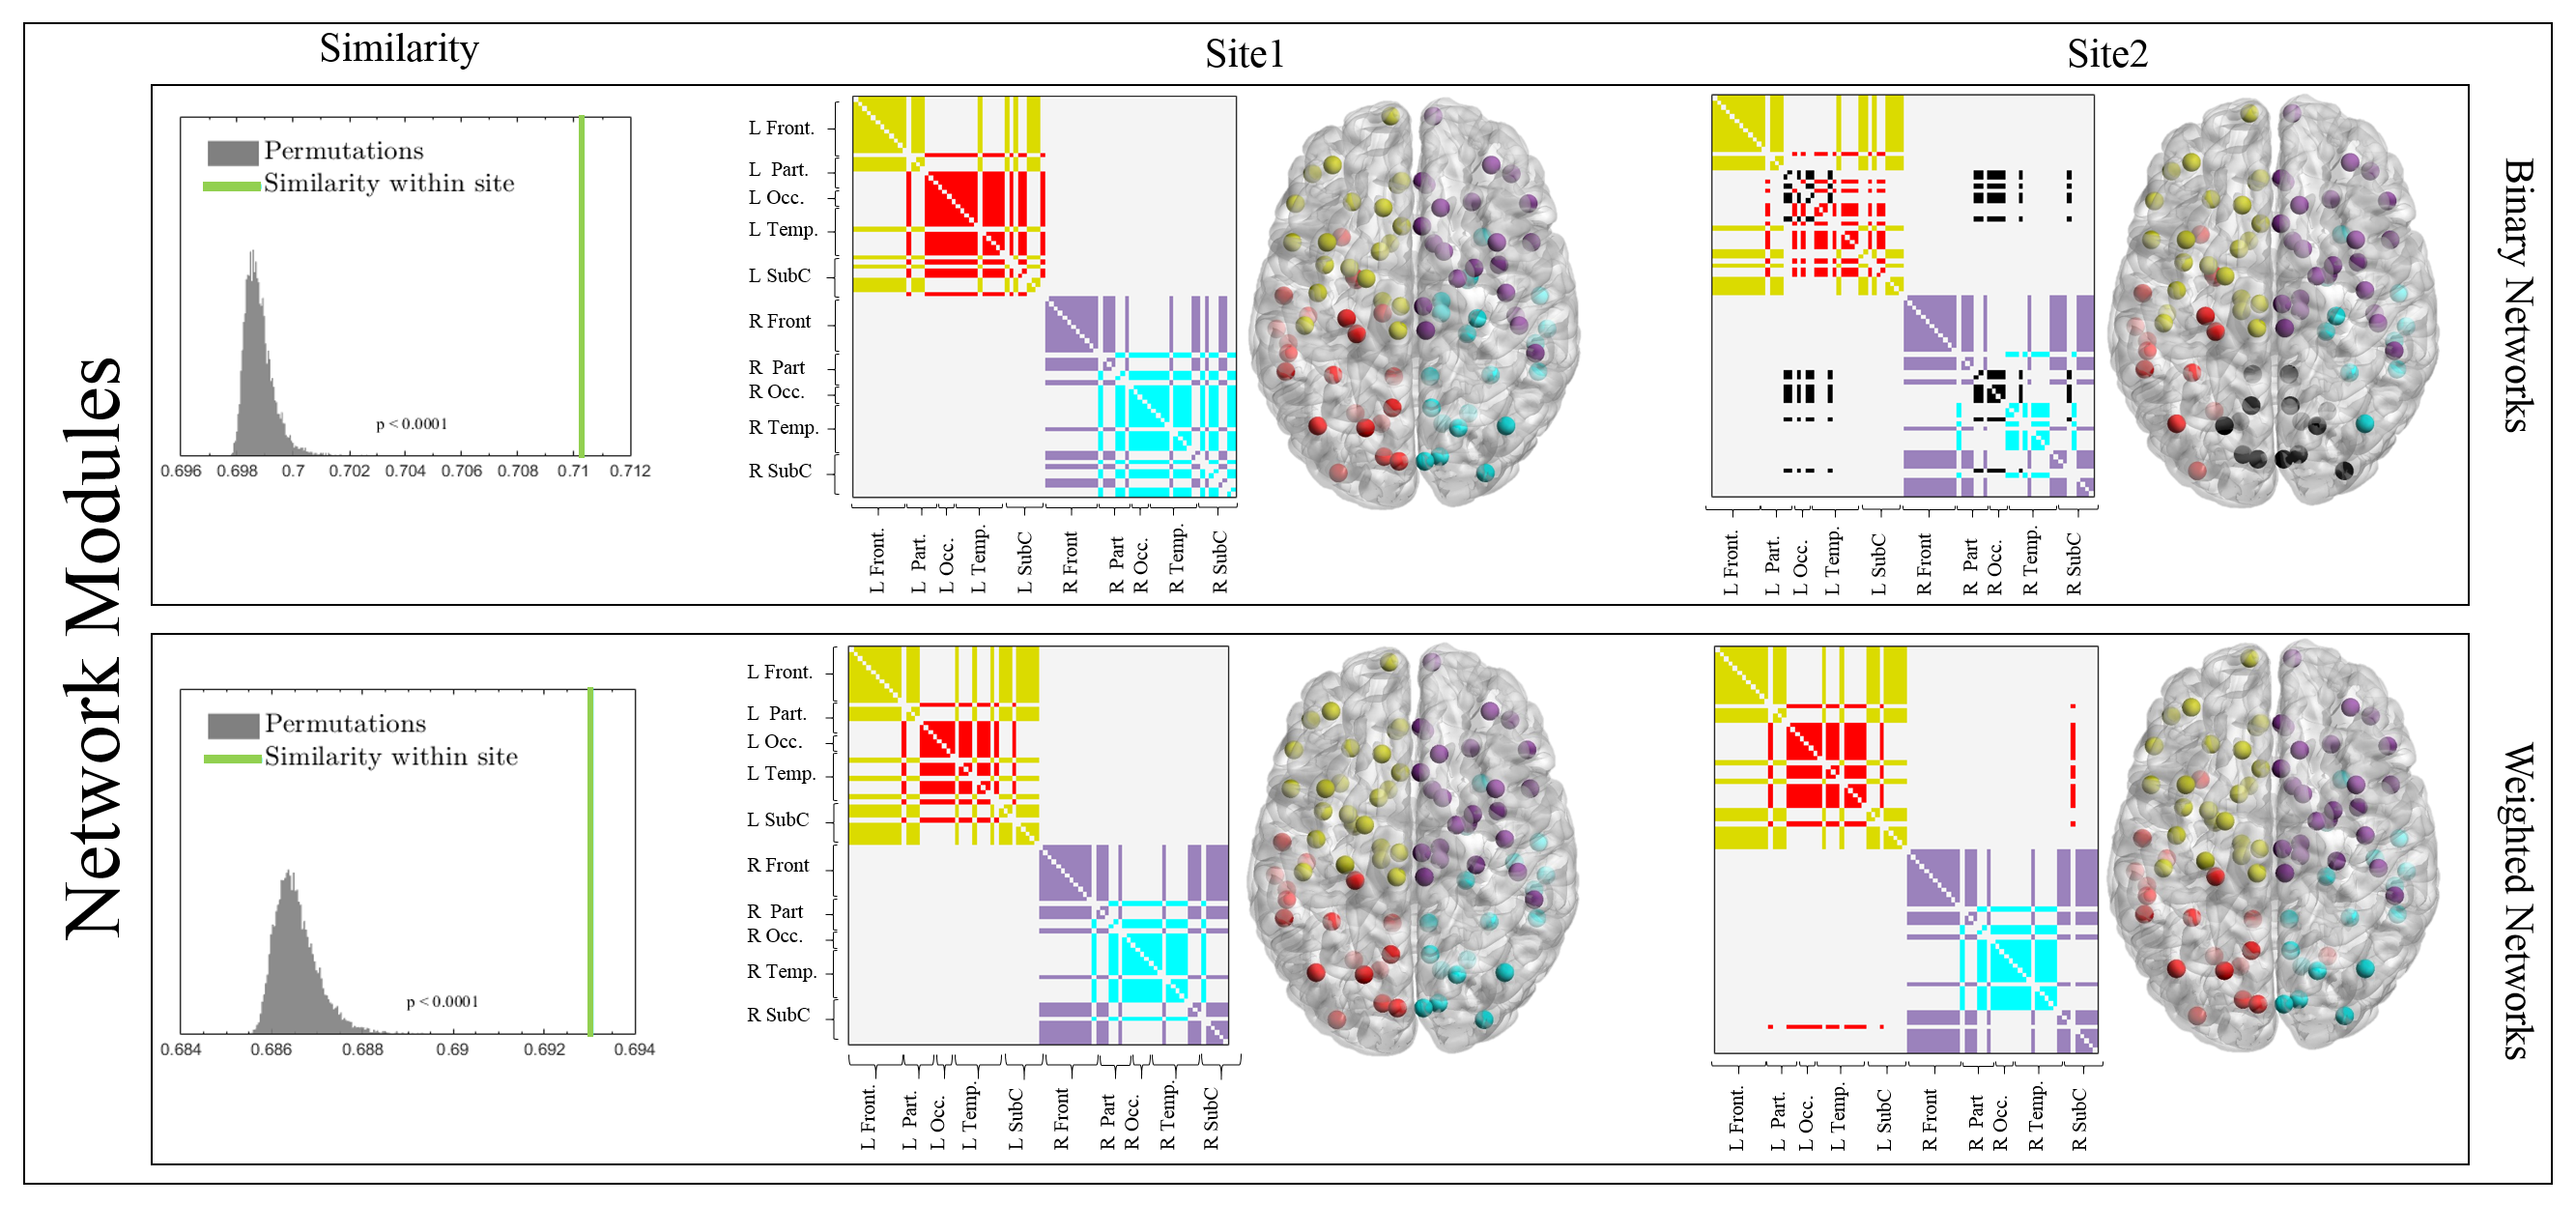
c-Mesoscale: Brain hubs were defined as nodes with high centrality and degree (Fig.3). We used community detection (Louvain method) to determine the brain subnetworks4 (Fig.4).
4- Statistical Analysis: Two-sample t-test was used to assess the difference in mean of global properties for both binary and weighted graphs (Fig.1). Due to the non-normal distribution of the local properties within sites, we used a nonparametric test, Mann-Whitney U, to quantify the observed differences (Fig.2). Additionally, we computed the Rank-Biserial correlation from the nonparametric test to present the effect size. With the brain hubs, we determined the significant network hubs in each site by testing the zero-median hypothesis to find significant hub-nodes. Using two-proportion z-test, the rate of success of each node as a brain-hub was compared between sites to quantify both preserved and non-preserved hubs. Regarding the brain subnetworks, we computed a consensus of brain subnetworks5 to obtain a representative for community structures in each site (Fig.4). Finally, we computed cosine similarities for both hubs and subnetworks, and compared the similarities observed to the distribution obtained from permuting subjects across sites.
Results and Discussion
Global properties were found to be significantly different between sites, both for binary and weighted graphs (Fig.1). Aside from density thresholds of 0.25 and 0.30 in binary graphs, the significance was observed across all density levels and for all measures. Interestingly, we observed a trend of increasing effect sizes as the density levels increase in weighted graphs (Fig.1). Investigating local properties, our analysis demonstrates that the vast majority of brain nodes were significantly different between sites (Fig.2). At the meso level, we observed significant differences (p<0.0001) between sites in terms of overall hub and subnetwork arrangements. However, the effect size was minimal (< 0.02 cosine similarity). Moreover, when investigating individual hubs and subnetworks, we observed that many hubs and subnetworks were preserved between sites (Figs.3,4). Conclusion
In this work, we investigated the properties of the structural connectome in diffusion data that was collected from different scanners. Our aim was to identify and quantify the preserved features of the brain network across sites. We report that although global and local measures varied between sites, the topological organizations were largely preserved, suggesting that disease related interpretations on global and local measures should be avoided unless the sample size is very large, with mostly the topological measure being used for interpretations.Acknowledgements
This research was supported by the National Institutes of Health (NIH) grant 1R01HD08939001A1 (PI: Ragini Verma).References
1- Satterthwaite, T.D., et al., The Philadelphia Neurodevelopmental Cohort: A publicly available resource for the study of normal and abnormal brain development in youth. Neuroimage, 2016. 124(Pt B): p. 1115-9.
2- Ghanbari, Y., et al., Identifying group discriminative and age regressive sub-networks from DTI-based connectivity via a unified framework of non-negative matrix factorization and graph embedding. Med Image Anal, 2014. 18(8): p. 1337-48.
3- Desikan, R.S., et al., An automated labeling system for subdividing the human cerebral cortex on MRI scans into gyral based regions of interest. Neuroimage, 2006. 31(3): p. 968-980.
4- Rubinov, M. and O. Sporns, Complex network measures of brain connectivity: uses and interpretations. Neuroimage, 2010. 52(3): p. 1059-69.
5- Doron, D., et al., Dynamic network structure of interhemispheric coordination. PNAS, 2012, 109 (46) 18627-18628.
Figures