5206
The impact of structure tensor informed fibre tractography (STIFT) on structural connectivity1Donders Centre for Cognitive Neuroimaging, Donders Institute for Brain, Cognition and Behaviour, Nijmegen, Netherlands
Synopsis
Structure tensor informed fibre tractography(STIFT) incorporating white matter morphology from gradient echo data to diffusion data is beneficial in the presence of kissing and highly curved fibres. However, previous demonstrations of STIFT provide only qualitative results and its performance beyond the initial targets (optic radiation and cingulum) is still unknown. This study investigated the quantitative effects of STIFT through structural connectivity comparison between diffusion tractography and STIFT. We found that there is no change of connectivity with STIFT in major structural connections.
Introduction
Structure tensor informed fibre tractography (STIFT) based on diffusion images at 3T and gradient echo (GRE) images at 7T has shown improved fibre tractography accuracy when analysing “kissing”, “crossing” and highly-curved fibres1. It exploits the heterogeneity in GRE images across different fibre bundles to provide extra information for diffusion-based tractography. Previously we have shown that similar tracking performance compared to original study can be achieved by using 3T diffusion and GRE data2. However, the previously demonstrated applications of STIFT were not quantitative and the impact of STIFT has hitherto been limited to two applications1,2. In this study, we examine in a larger population of the impact of STIFT in optic radiation tractography and whole-brain tractography by means of a connectivity comparison.Methods
Data acquisition
All scans were performed at 3T (Magnetom Prisma, Siemens, Erlangen, Germany) using 32-channel array head coil in 5 healthy volunteers. The imaging protocol consisted of: (1) Whole brain T1-weighted images using MPRAGE res=1mm isotropic, Tacq=5mins; (2) DWI using a spin-echo EPI sequence with multiband factor of 4, 84 slices, TR/TE=3460/97.6ms, res=1.5mm isotropic, b=2000s/mm2 and 100 diffusion directions (and 11 b=0 measurements), Tacq=7mins; (3) multi-echo 3D GRE (mGRE) with 5 echoes, TR/TE=52/5.6:9.8:44.8ms, res=0.75mm isotropic and 2D GRAPPA=4, Tacq=11mins.
Data processing
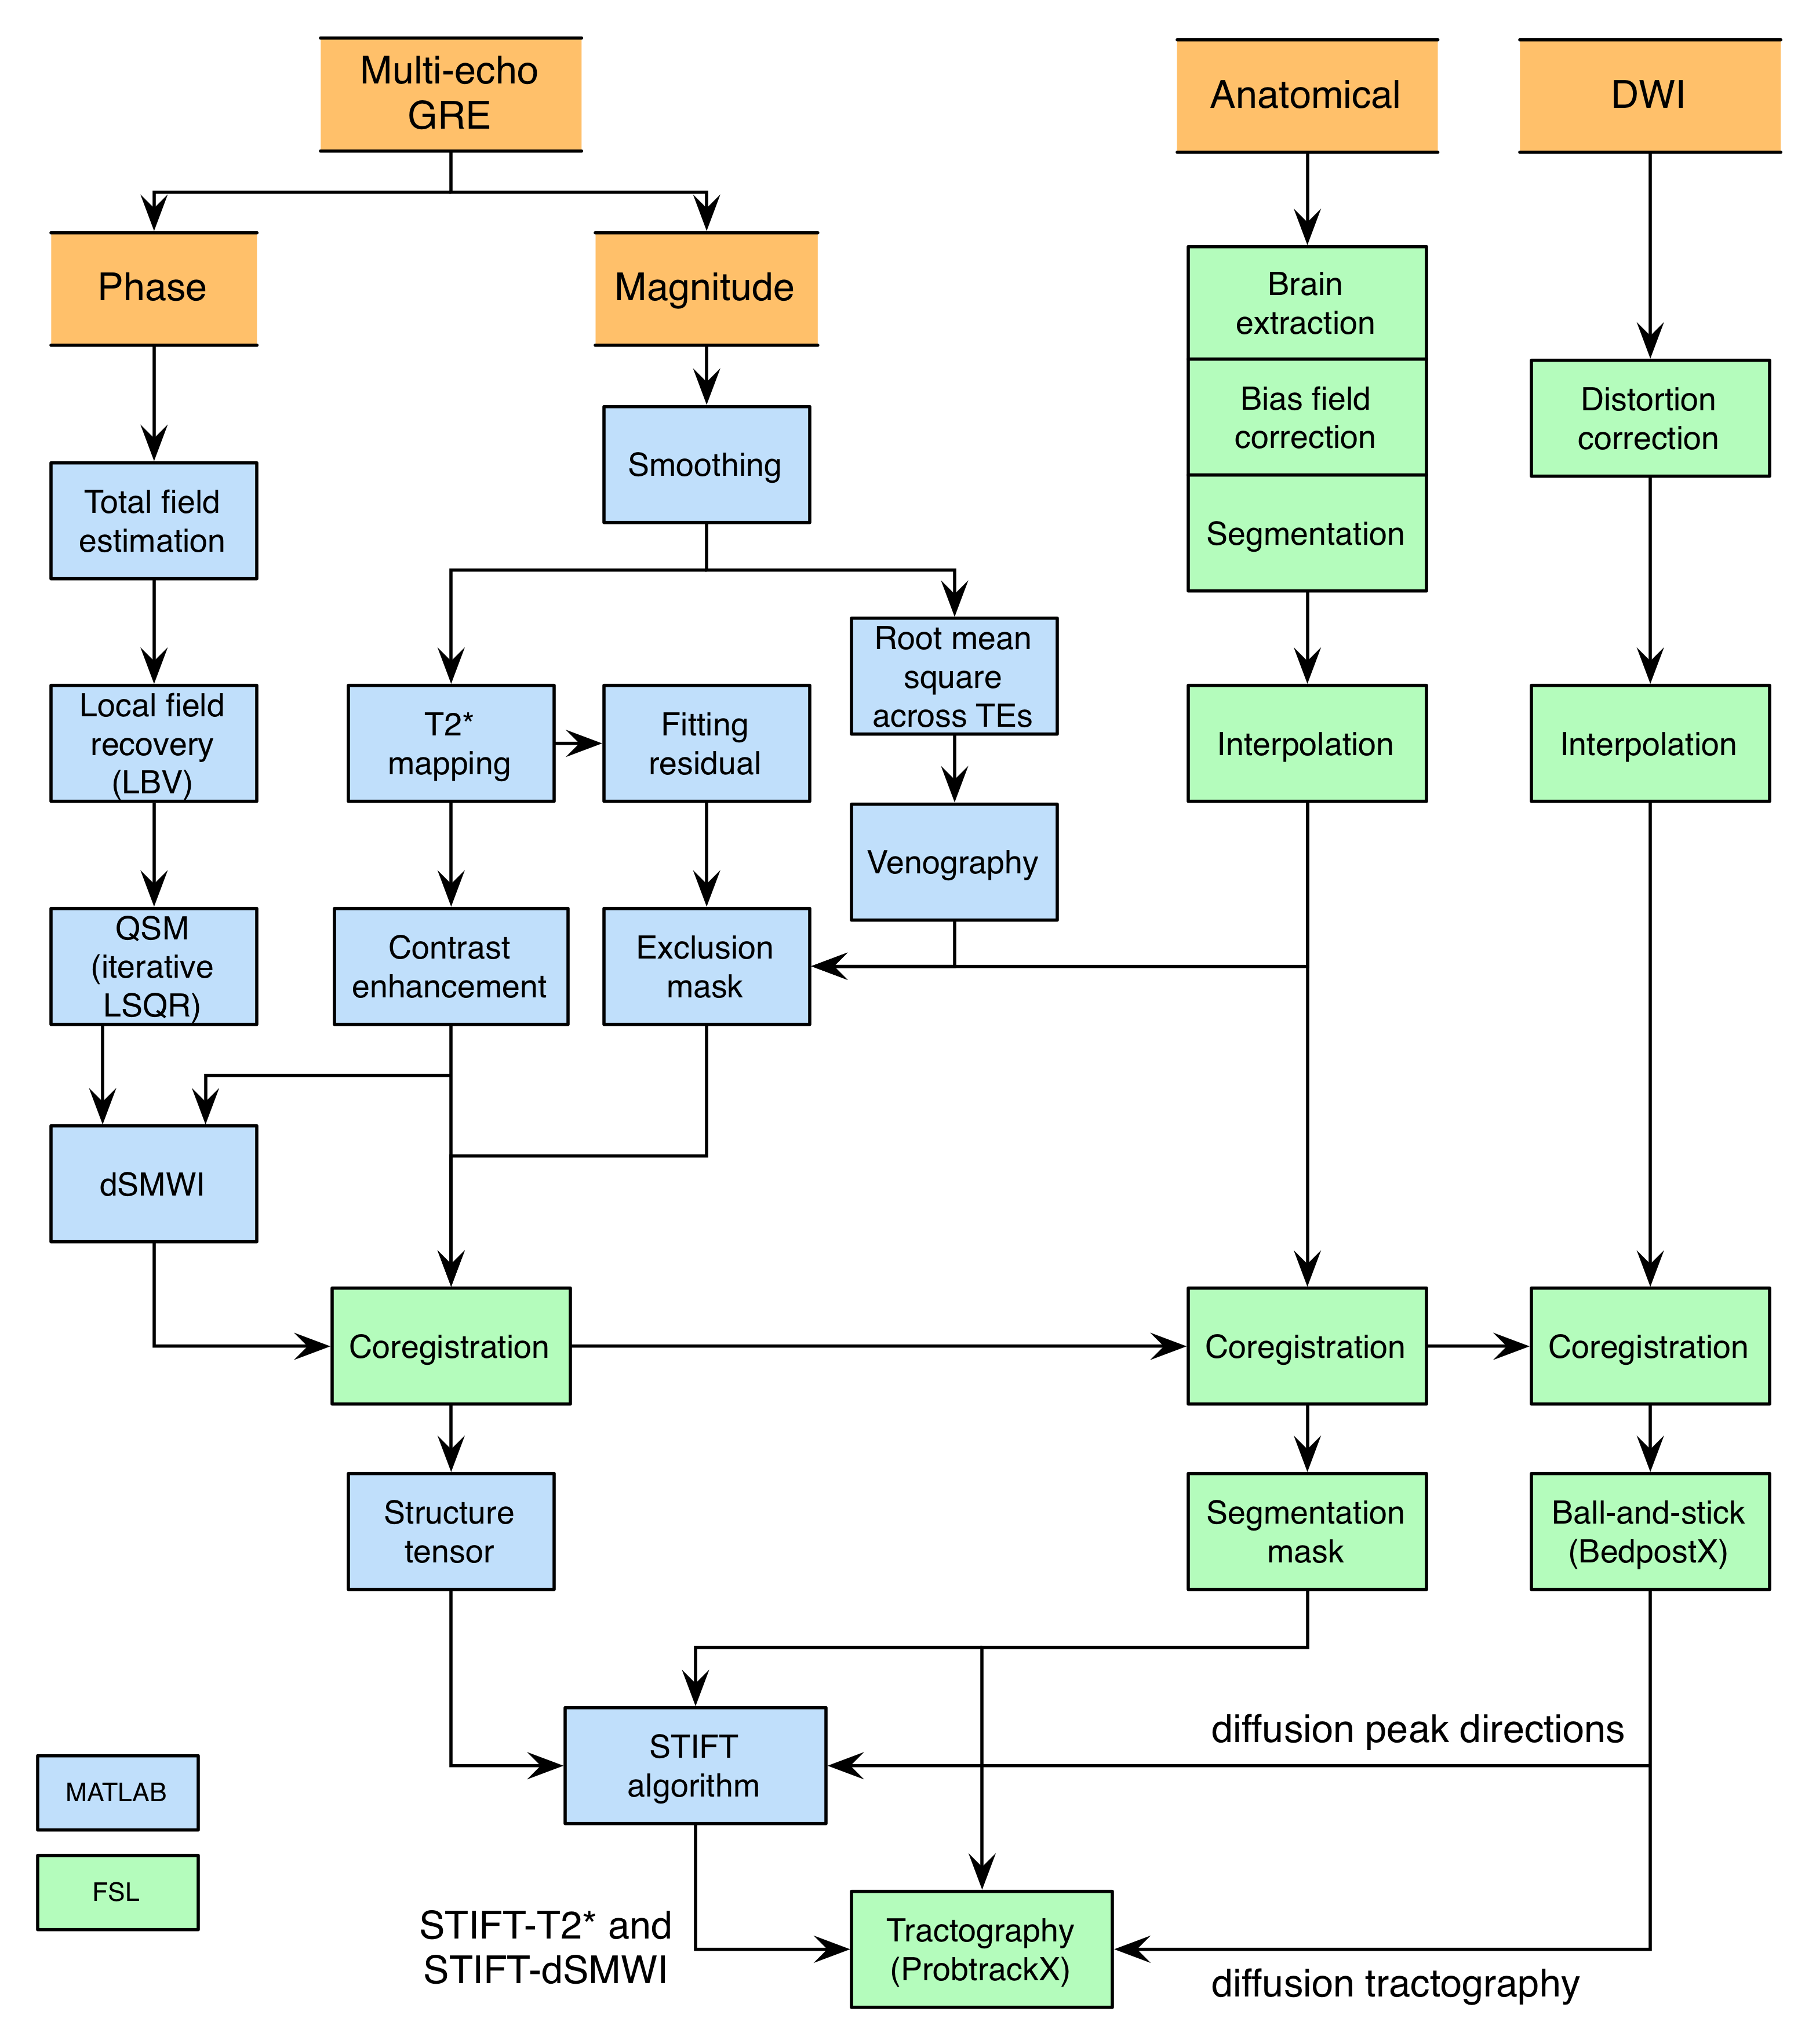
A summary of the data processing pipeline can be found in Fig.1. T2* and field maps were computed from the mGRE data3,4. QSM was then derived using the iterative LSQR algorithm5 and subsequently combined with the T2* map to create susceptibility-weighted images that enhance diamagnetic features (dSMWI)6. To reduce noise propagation into the structure tensor, an ANLM filter7 was applied to the mGRE data before computing the T2* maps.
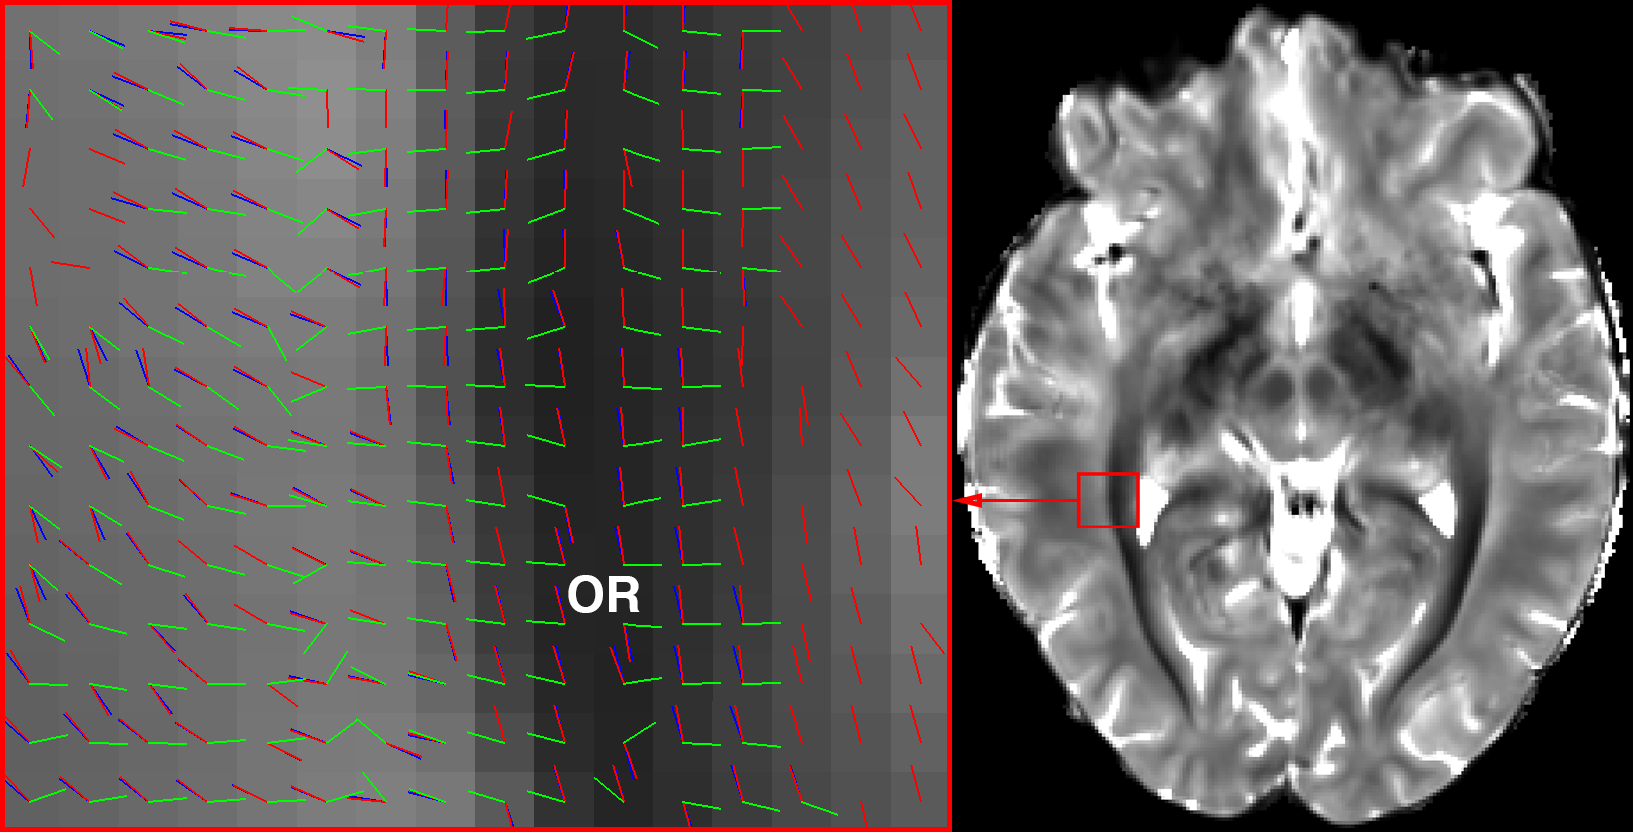
DWI images and T1-weighted images were interpolated to 0.75mm isotropic resolution to match with the spatial resolution of mGRE images. Cortical/subcortical parcellation was performed by registration of the Jülich histological atlas8 to diffusion space, providing network nodes for the connectivity matrix. DWI images were corrected for eddy current distortion9. ODF were resolved by using a ball-and-stick model in FSL, allowing maximum 3 diffusion directions to be extracted from each voxel. The diffusion peak directions in WM voxels (segmented using T1-w images) were adapted by STIFT, rotating the diffusion peak directions towards the plane orthogonal to the local structure tensor (see Fig.2)1. To evaluate the impact of STIFT in structural connectivity, Bayesian-based probabilistic tractography10 was conducted on diffusion peak directions, T2* and dSMWI structure tensor adapted directions (namely STIFT-T2* and STIFT-dSMWI) with the following strategies:
(1) As the clearest STIFT improvements were found in tracking optic radiation, we tested the hypothesis of improved connectivity between the lateral geniculate nucleus (LGN) and primary visual cortex (V1) by seeding at entire LGN.
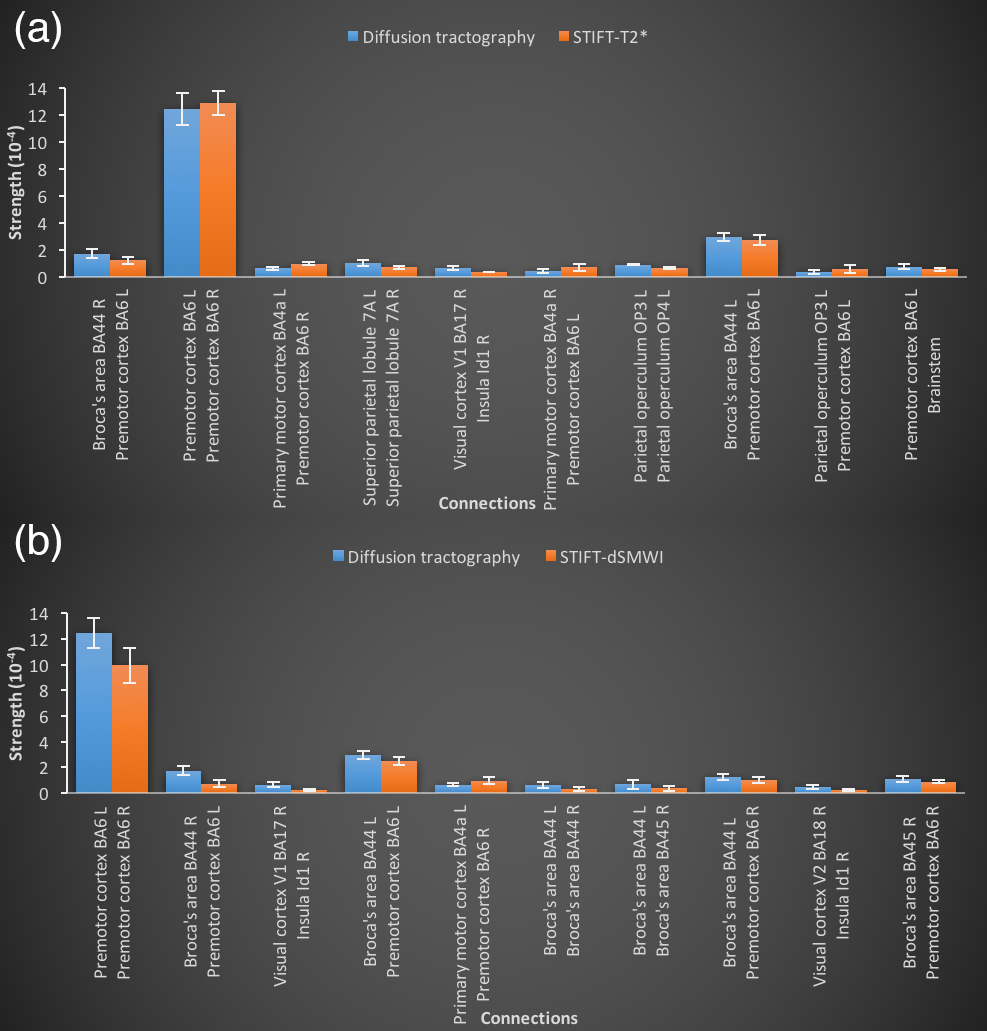
(2) Whole-brain tractography was performed using all WM voxels as seeds to evaluate the change of structural connectivity with STIFT beyond the regions initially targeted. The effects of STIFT on the ten strongest connections were evaluated and the connections with the greatest change in connectivity between diffusion tractography and STIFT were compared.
Connectivity strength was defined as the ratio of the number of streamlines connecting the nodes to the total streamlines generated. Two-sample t-tests were conducted to compare the connectivity between diffusion tractography and STIFT in MATLAB. Statistical significant finding was defined for p<0.05 for LGN-V1 connectivity comparison and p<0.005 for whole-brain connectivity study based on Bonferroni correction of 10 comparisons.
Results
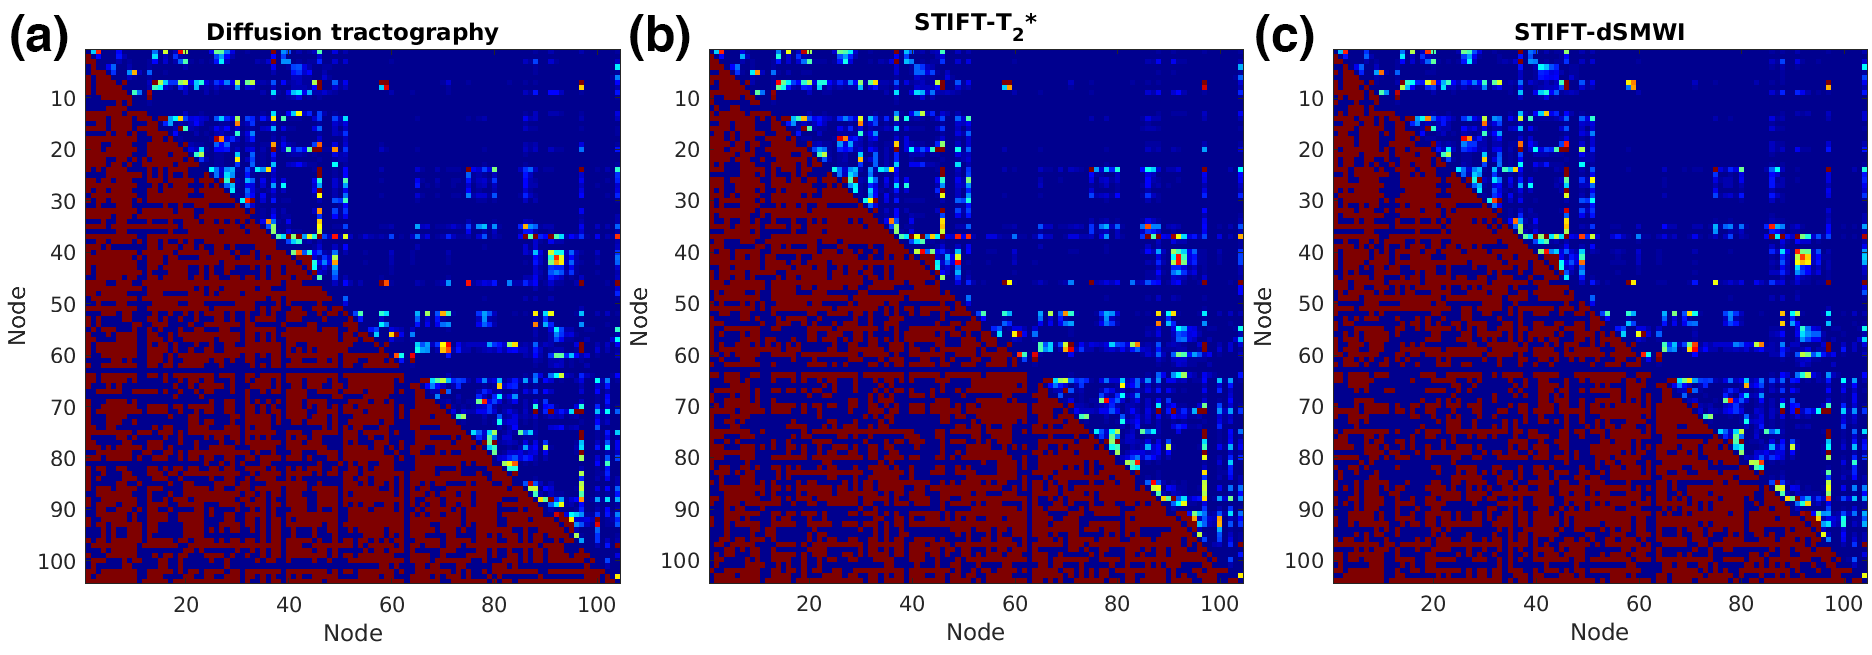
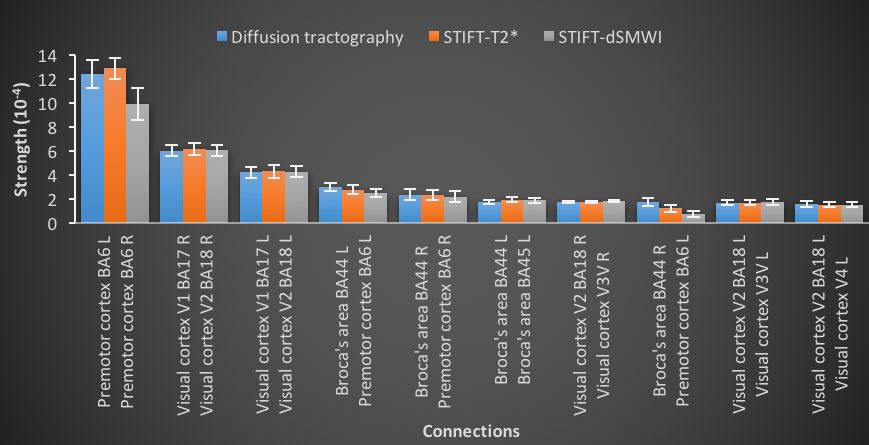
The LGN-V1 connectivity in left and right hemispheres of diffusion tractography are 0.068±0.013 (mean±standard error) and 0.077±0.008, while for STIFT-T2* are 0.086±0.022 and 0.073±0.011, and for STIFT-dSMWI are 0.071±0.016 and 0.064±0.006 respectively. No connectivity improvement was found with STIFT in contrast to the benefits shown in previous results with seeds at the boundary of the optic radiation that are not generalizable to the whole fibres1,2. Fig.3 shows the average whole-brain connectivity matrices and a mask of consistent connections of diffusion tractography(Fig.3a), STIFT-T2*(Fig.3b) and STIFT-dSMWI(Fig.3c) across subjects. Fig.4 shows the connectivity results corresponding to the 10 strongest connections in diffusion tractography. Fig.5 shows the connectivity results corresponding to 10 greatest change in connectivity between diffusion tractography and STIFT-T2*(Fig.5a)/STIFT-dSMWI(Fig.5b). No significant difference in structural connectivity was found in any of the comparisons.Discussion and Conclusion
STIFT using 3T-only data does not alter the connectivity of LGN-V1 and major connections found in diffusion tractography. However, the atlas-based network nodes used are not subject specific and could limit the impact observed in the connectivity matrix. Nevertheless, it was possible to observe that both STIFT implementations resulted in a decrease of significant connections – which can be interpreted as a removal of false positives.Acknowledgements
This study is part of the Advanced Brain Imaging with MRI (ABRIM) project and funded by EU-Marie Curie Actions.References
1.Kleinnijenhuis M, Barth M, Alexander DC, van Cappellen van Walsum A-M, Norris DG. Structure Tensor Informed Fiber Tractography (STIFT) by combining gradient echo MRI and diffusion weighted imaging. Neuroimage 2012;59:3941–3954. doi: 10.1016/j.neuroimage.2011.10.078.
2. Chan K-S, Norris DG, Marques JP. Structure tensor informed fibre tractography at 3T. In Proceedings of the 25th Annual Meeting of the International Society for Magnetic Resonance in Medicine, Honolulu, HI, USA; 2017.
3. Khabipova D, Wiaux Y, Gruetter R, Marques JP. A modulated closed form solution for quantitative susceptibility mapping--a thorough evaluation and comparison to iterative methods based on edge prior knowledge. Neuroimage 2015;107:163–174. doi: 10.1016/j.neuroimage.2014.11.038.
4. Robinson SD, Bredies K, Khabipova D, Dymerska B, Marques JP, Schweser F. An illustrated comparison of processing methods for MR phase imaging and QSM: combining array coil signals and phase unwrapping. NMR Biomed 2016. doi: 10.1002/nbm.3601.
5. Li W, Wang N, Yu F, Han H, Cao W, Romero R, Tantiwongkosi B, Duong TQ, Liu C. A method for estimating and removing streaking artifacts in quantitative susceptibility mapping. Neuroimage 2015;108:111–122. doi: 10.1016/j.neuroimage.2014.12.043.
6. Gho S-M, Liu C, Li W, Jang U, Kim EY, Hwang D, Kim D-H. Susceptibility map-weighted imaging (SMWI) for neuroimaging. Magn Reson Med 2014;72:337–346. doi: 10.1002/mrm.24920.
7. Manjón JV, Coupé P, Martí-Bonmatí L, Collins DL, Robles M. Adaptive non-local means denoising of MR images with spatially varying noise levels. J Magn Reson Imaging 2010;31:192–203. doi: 10.1002/jmri.22003.
8. Eickhoff SB, Stephan KE, Mohlberg H, Grefkes C, Fink GR, Amunts K, Zilles K. A new SPM toolbox for combining probabilistic cytoarchitectonic maps and functional imaging data. Neuroimage 2005;25:1325–1335. doi: 10.1016/j.neuroimage.2004.12.034.
9. Andersson JLR, Skare S, Ashburner J. How to correct susceptibility distortions in spin-echo echo-planar images: application to diffusion tensor imaging. Neuroimage 2003;20:870–888. doi:
10.1016/S1053-8119(03)00336-7. 10. Behrens TEJ, Berg HJ, Jbabdi S, Rushworth MFS, Woolrich MW. Probabilistic diffusion tractography with multiple fibre orientations: What can we gain? Neuroimage 2007;34:144–155. doi: 10.1016/j.neuroimage.2006.09.018.
Figures