5205
Exploring peritumoral neural tracts by using Neurite Orientation Dispersion and Density ImagingShin Tai Chong1, Hung-Wen Kao2, Chien-Yuan Eddy Lin3, Chiao-Chi Chen4, Chun-Yi Zac Lo5, Ching-Po Lin1, and Chen Chang4
1Institute of Neuroscience, National Yang-Ming University, Taipei, Taiwan, 2Tri-Service General Hospital, National Defense Medical Center, Taipei, Taiwan, 3GE Healthcare MR Research China, Beijing, China, People's Republic of, Taipei, Taiwan, 4Institute of Biomedical Sciences, Academia Sinica, Taipei, Taiwan, 5Institute of Science and Technology for Brain-Inspired Intelligence, Fudan University, Shanghai, China
Synopsis
We hypothesized that the Neurite Orientation Dispersion and Density Imaging (NODDI)-based tractography could improve the reconstruction of the fiber tracts that by tracking through regions of peritumoral edema. In visual comparison with diffusion tensor imaging (DTI), this model provided similar performance in healthy side and better performance in the corticospinal tract (CST) of the affected side. This technique may help neurosurgeons to define an optimal safe margin for total resection.
Introduction
DTI is a non-invasive method to investigate the structure of human neuronal fibers that help neurosurgical planning and intra-operative decision making. However, the complexity of white matter architecture, for example, peritumoral edema may poses a major challenge to DTI model [1]. The effect of peritumoral edema increase the uncertainty of fractional anisotropy (FA) and impede the correct identification of fiber tracts [2]. The recently proposed NODDI model is promising in characterizing microstructures of the brain tissue. This multi-compartment model provides fiber orientation information [3], which has the potential to improve tractography in the peritumoral edema. In this study, NODDI-based tractography was used to show improved reconstruction of the corticospinal tract (CST) by tracking through regions of peritumoral edema.Methods
A total of 4 patients with brain tumors and severe peritumoral edema (1 WHO grade I meningioma, 1 WHO grade II meningioma, and 2 metastatic adenocarcinomas from lung and rectum respectively) underwent 3T MRI scanning (Discovery MR 750, GE Healthcare, Milwaukee, USA) with a diffusion scheme of multiple b values in 99 directions (TR/TE = 6000/88 ms, maximal b-value = 2000s/mm2, voxel size = 2.5x2.5x2.5 mm3). All DWI images were processed with motion and distortion correction by using FSL (https://fsl.fmrib.ox.ac.uk/fsl/fslwiki) and fitted into both DTI (only low b-values images were used and computed by dtifit in FSL) and NODDI model (processed with matlab NODDI toolbox, http://mig.cs.ucl.ac.uk/mig/mig/index.php/?n=Tutorial.NODDImatlab/). All the tractography was performed with FACT algorithm in Diffusion Toolkit from the directions identified by DTI with 60˚of turning angle threshold. For DTI-based tractography, FA threshold of 0.1 (higher sensitivity but less specificity) and 0.2 (less sensitivity but more specificity) were used. For determining a threshold in orientation dispersion index (ODI) that is comparable to FA , five more healthy subjects were recruited. We reconstructed NODDI-based tractography by using different ODI threshold between 0.01 and 1 (every 0.01 interval) and compared with DTI-based tractography with FA threshold of 0.2. An Inclusive region of interest (ROI) for the extraction of the corpus callosum was delineated and applied to all the reconstructions. Dice similarity index (shape comparison) and correlation coefficient (tracts number comparison) were used to quantify the overlap between DTI- and NODDI-based tractography. The optimal ODI threshold was chosen as the mean of comparison that maximized of the overlap and applied to NODDI-based tractography. All the tractography were converted into normalized probability map. For comparison, both healthy and affected CST were extracted in NODDI-base tractography by an experienced neuroradiologist and labeled as ROIs. Correlation coefficient among these tracking criteria were computed in both healthy and affected side of CST. Nonparametric Kruskal-Wallis test was employed to compare the similarity of the extracted CST.Results
The maximum dice similarity index and correlation coefficient for the reconstruction were found with ODI threshold of 0.436 ± 0.0219 and 0.424 ± 0.0089. An optimal threshold of ODI = 0.43 was finally chosen (Figure 1). In visual comparison with DTI-based tractography (FA threshold = 0.2), the NODDI-based tractography shows significantly higher tract density in the peritumoral edema and similar density in healthy hemispheres (Figure 2, Figure 3). However, statistical tests showed no significant differences between the correlations of the probabilistic values of the CST (p = 0.491 in healthy side; p = 0.246 in the affected side; Figure 4).Discussion and conclusion
Although there are no significant statistical differences between the correlations of the CST probabilistic values, NODDI-based tractography demonstrates high sensitivity and specificity in both healthy and affected hemispheres. Although the findings should be verified with more cases and follow-up data, our results suggested that NODDI-based tractography, reconstructed by an optimal ODI threshold, has great potential to improve the reconstruction of the CST in tracking through regions of peritumoral edema. This technique may help neurosurgeons to better define a safe margin for tumor resection.Acknowledgements
No acknowledgement found.References
- Chen Z, Tie Y, Olubiyi O, et al. Corticospinal tract modeling for neurosurgical planning by tracking through regions of peritumoral edema and crossing fibers using two-tensor unscented Kalman filter tractography. Int J CARS.2016;11(8): 1475–1486.
- Lecoeur J, Caruyer E, Elliott M, et al. Addressing the Challenge of Edema in Fiber Tracking. Hal. 2014; 01072222.
- Zhang H, Schneider T, Wheeler-Kingshott CA, and Alexander DC. NODDI: Practical in vivo neurite orientation dispersion and density imaging of the human brain. NeuroImage. 2012;61(4):1000–1016.
Figures
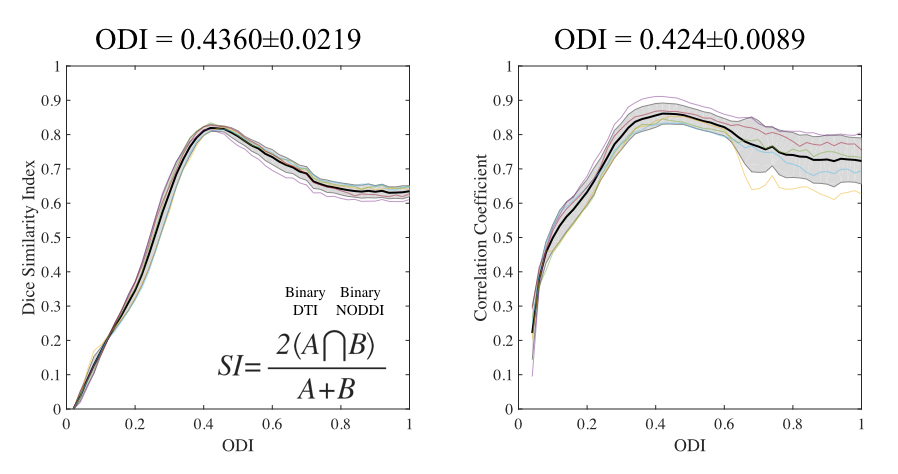
Figure 1. The overlap comparison of dice similarity index (shape
comparison, left) and correlation coefficient (tracts number comparison, right)
at each ODI threshold for the reconstruction of the corpus callosum. An optimal
threshold of ODI was determined at 0.43 for NODDI-based tractography.

Figure 2. An example of visual comparison between NODDI-based (left),
and DTI-based (middle and right) tractography. Brain tumor was drawn as red
color and peritumoral edema with sky-blue color. NODDI-based tractography shows
significantly higher tract density in the peritumoral edema. In the in healthy
hemisphere, the two models are comparable (ODI and FA thresholds = 0.43 and 0.2
respectively). A DTI-based tractography with FA threshold set at 0.1 (right) demonstrates
significantly higher tracts density in both hemispheres with presence of significant
amount of unrecognized tracts, as a drawback.
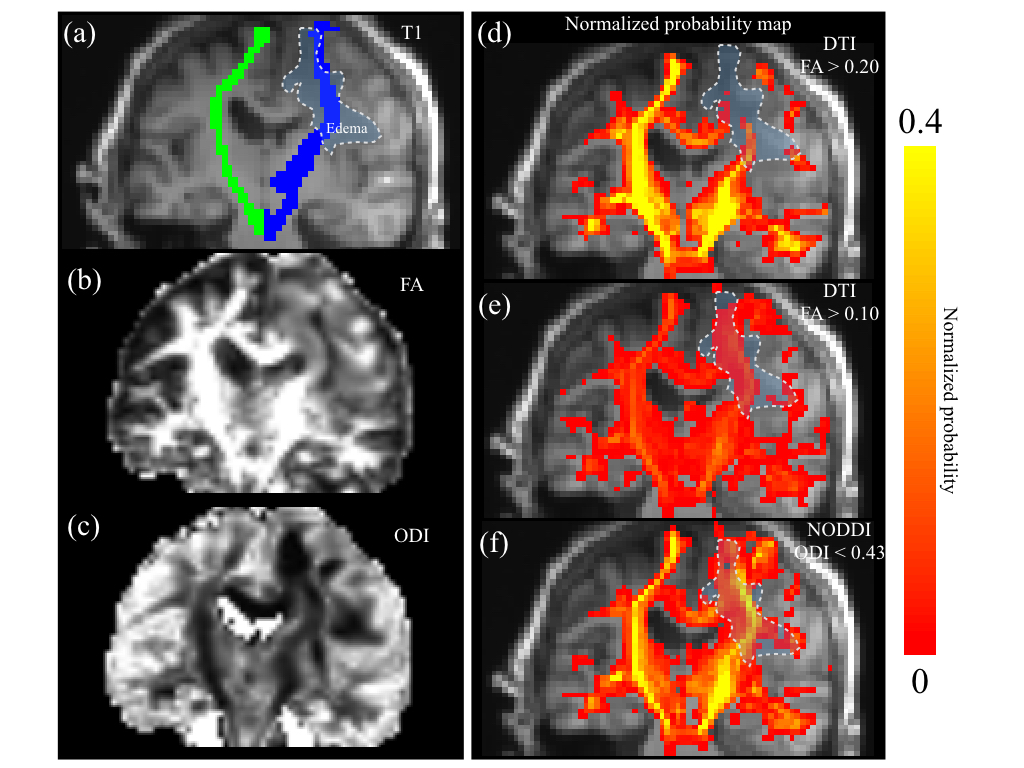
Figure 3. An example of visual comparisons of normalized probability map. Peritumoral edema
(area bordered by white dash-line), healthy side and affected side of CST (green
and blue respectively) were highlighted on T1-weighte images (a). NODDI-based tractography
(f) shows higher probability on both sides of the CST in comparison with DTI-based
tractography in different FA thresholds (d, 0.2; e, 0.1).
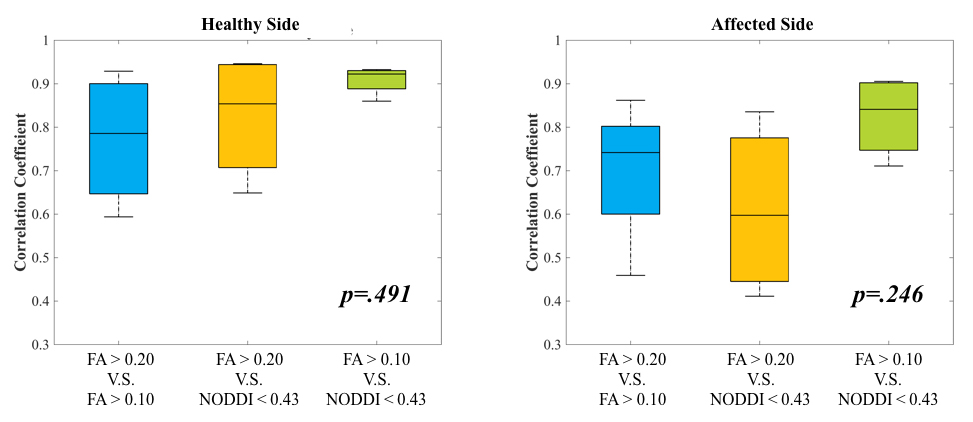
Figure 4. Correlations of the probabilistic values of the CST on healthy
and affected sides.