5203
Bootstrapping Fibre Orientation Distributions: Accuracy advantages and other benefits of estimating shape uncertainty1Natbrainlab & Centre for Neuroimaging Studies, Institute of Psychiatry, Psychology and Neuroscience, King's College London, London, United Kingdom, 2Natbrainlab, Institute of Psychiatry, Psychology and Neuroscience, King's College London, London, United Kingdom
Synopsis
Inherently low signal-to-noise ratio in diffusion-MRI results in high uncertainty in the estimated underlying fibre orientation distributions. True bootstrapping and model- based residual bootstrapping approaches have been proposed to estimate the uncertainty in the estimated peak directions. Here we compare the two methods using simulations and observe that more information can be extracted by looking at the variation in the entire shape of the FOD, as opposed to just the peak direction. Results also suggest that, in this case, residual bootstrapping might not provide a representative estimation of directional uncertainty due to non-negligible model bias.
INTRODUCTION
Inherently noisy diffusion-MRI results in considerable uncertainty in fibre orientation estimation is propagated in tractography. Probabilistic tractography tries to account for this uncertainty either by sampling from the underlying fibre orientation distribution (FOD)1,2 or applying Bayesian model to estimate the local uncertainty of the FOD3,4. Bootstrapping – a non-parametric statistical approach for estimating uncertainty of a given statistic by resampling from repeated measures - has been proposed to estimate the local uncertainty in derived fibre orientations5. Residual bootstrapping6–8 provides a plausible alternative to avoid signal repetitions where only residuals of the modelled signal are resampled and added back to the signal. Here we investigate how true/conventional and model-based residual bootstrapping methods perform in challenging fibre configurations by evaluating the accuracy of the average peak direction, and propose additional information can be extracted from the variation in the entire shape of the FOD, as opposed to just the local maxima.METHODS
Numerical Simulations: Two-fibre crossing configurations at 90°, 60° and 45° angles were simulated as a sum of two tensors with diffusivity profile of [1.7 0.2 0.2]x10-3mm2/s plus an additional isotropic compartment of [0.7 0.7 0.7]x10-3mm2/s representing grey-matter partial volume. To simulate a challenging scenario each compartment was assigned the same volume fraction. Rician noise was added to the simulated signal of 60 diffusion-weighted directions and b=3000s/mm2 (at SNR 15 and 10). Residual bootstrapping (resBOOT)7 was then performed on the noised signal. Similarly, signal generation was repeated 10 times for the ideal/true bootstrapping (trueBOOT), generating 500 bootstrap realisations with both.
Bootstrap realisations were analysed using dampened Richardson-Lucy spherical deconvolution method9,10 to estimate individual FODs and the mean-FOD across realisations. The local maxima were extracted using gradient descent optimisation. Additionally, a coefficient of variation (CV) threshold was defined to identify and discard FOD components with high uncertainty (CV>1) from the mean profile. All experiments were repeated 20 times to calculate the Root-mean-square-error (RMSE) of mean-FOD peak directions.
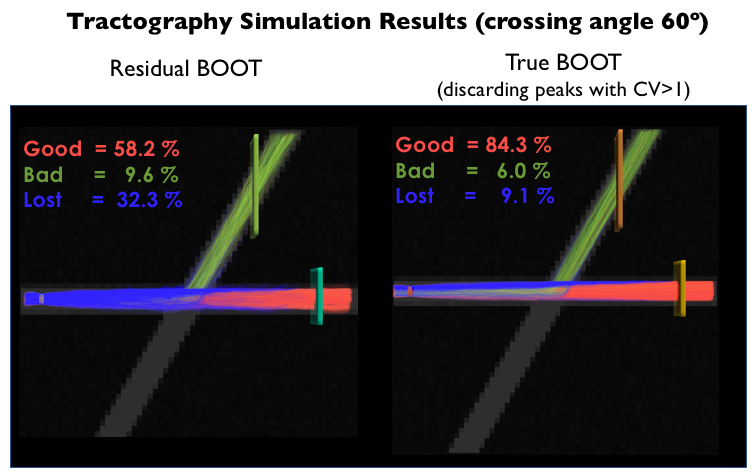
Tractography simulations: Straight crossing tracts at 60° angle were simulated with the same signal characteristics as above. Probabilistic tractography was performed by sampling mean-FOD profiles using an angular and FOD amplitude threshold, 25º and 0.003 respectively, and CV<1 to propagate tractography only along directions with low uncertainty. The proportion of good, bad and lost connections were calculated by counting the number of streamlines reaching correct or wrong target, or ending beforehand.
RESULTS & DISCUSSION
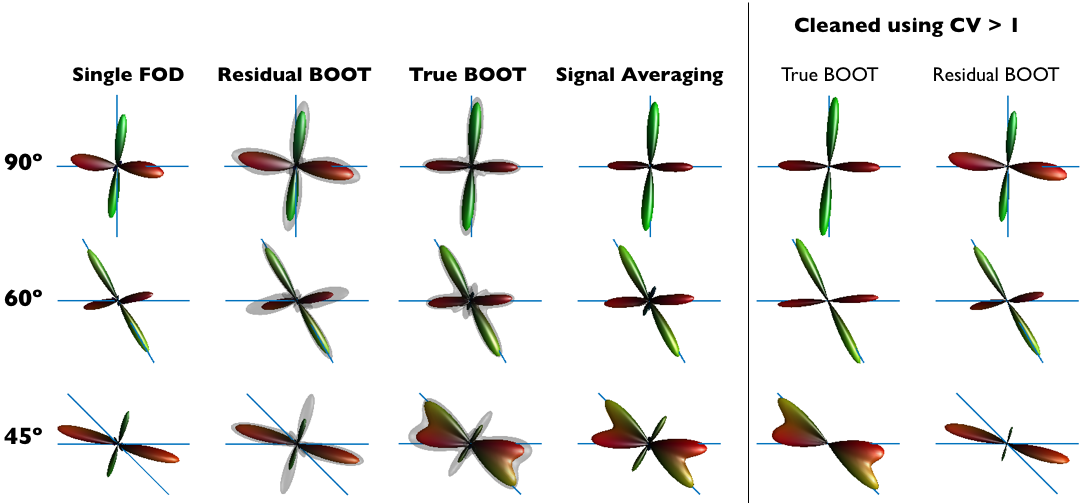
Figure 1 shows in a representative example how each bootstrapping method performs in challenging fibre configurations and SNR=10 (note that the relative high volume fraction of the isotropic compartment worsens the effects of SNR). The first striking observation is that the mean-FOD profile of resBOOT is no different than the single FOD estimation without bootstrapping. Similarly, the mean-FOD from trueBOOT is similar to the single FOD estimation based on signal averaging of all repeated acquisitions, suggesting trueBOOT-FOD is better aligned with ground truth simply due to more acquisitions. However, the added information of the standard deviation profile obtained allows for the estimation of a coefficient of variation which can be used to eliminate (clean) FOD vertices with CV>1. We observe that this consistently removes odd spikes from trueBOOT-FOD, but is not always successful in resBOOT-FODs since the mean-FOD direction is likely false to start with in low SNR.
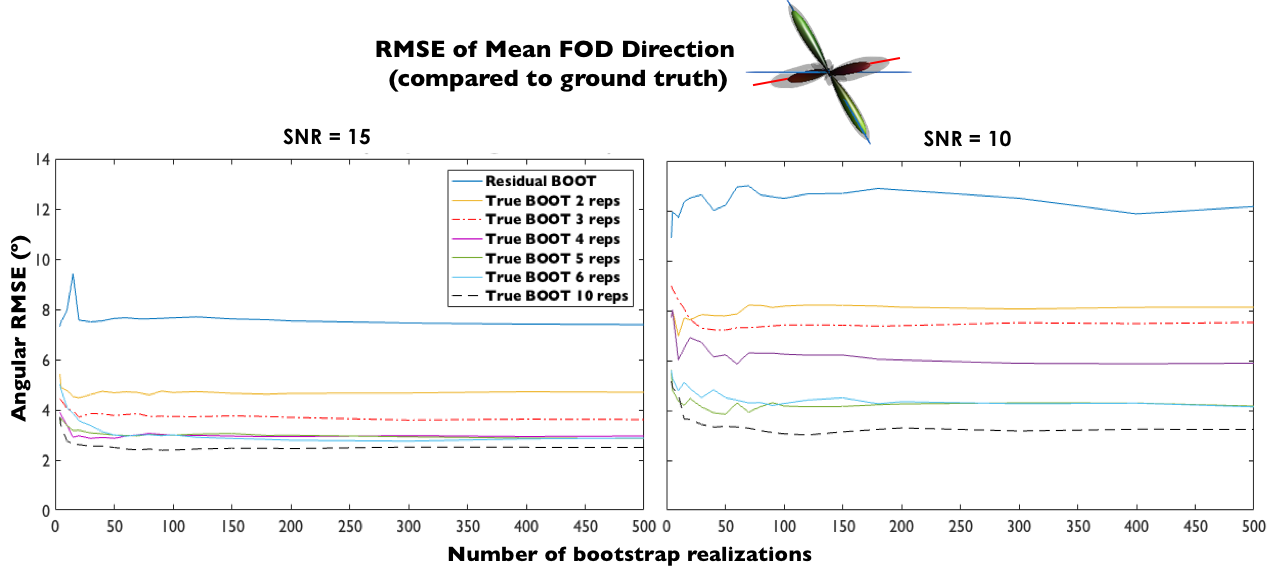
Figure 2 demonstrates how the root-mean-square-error (RMSE) of the mean fibre direction changes with the number of bootstrapping runs and the number of signal acquisition repetitions in trueBOOT. In the case of SNR=15, three repetitions (red dot-dashed line) already show a good compromise between potential imaging time and improved FOD estimates as the RMSE is halved compared to resBOOT. Increasing the repetitions past 4 produces only marginal improvement.
These results are also confirmed by tractography simulations. Figure 3 shows the proportion of streamlines that reach the correct ending (red streamlines) and the improvement is noticeable for probabilistic tractography using the CV threshold.
CONCLUSION
This study investigates the uncertainty in the shape of the estimated FOD with the conventional and residual bootstrapping methods by simulating challenging crossing fibre and SNR configurations. Residual bootstrapping appears to give no additional benefit compared to single non-bootstrapped FOD, and the additional uncertainty based on residuals resampling does not improve the fibre orientation estimation. Conventional/true bootstrapping is required with at least 3 signal repetitions (easily achievable with new accelerated MRI methods) in order to improve the fibre orientation and gain representative uncertainty information. Coefficient of variation threshold can then be used as a means of improving tractography. Probabilistic tractography based on modelled noise distribution is not a solution for noisy data and anatomically complex regions.Acknowledgements
No acknowledgement found.References
1. Descoteaux, M., Deriche, R., Knösche, T. & Anwander, A. Deterministic and Probabilistic Tractography Based on Complex Fiber Orientation Distributions. IEEE Trans. Med. Imaging 28, 269–286 (2009).
2. Tournier, J. D., Calamante, F. & Connelly, A. Robust determination of the fibre orientation distribution in diffusion MRI: Non-negativity constrained super-resolved spherical deconvolution. Neuroimage 35, 1459–1472 (2007).
3. Behrens, T. E. J. et al. Characterization and Propagation of Uncertainty in Diffusion-Weighted MR Imaging. Magn. Reson. Med. 50, 1077–1088 (2003).
4. Behrens, T. E. J., Berg, H. J., Jbabdi, S., Rushworth, M. F. S. & Woolrich, M. W. Probabilistic diffusion tractography with multiple fibre orientations: What can we gain? Neuroimage 34, 144–155 (2007).
5. Pajevic, S. & Basser, P. J. Parametric and non-parametric statistical analysis of DT-MRI data. J. Magn. Reson. 161, 1–14 (2003).
6. Berman, J. I. et al. Probabilistic streamline q-ball tractography using the residual bootstrap. Neuroimage 39, 215–222 (2008).
7. Jeurissen, B., Leemans, A., Jones, D. K., Tournier, J. D. & Sijbers, J. Probabilistic fiber tracking using the residual bootstrap with constrained spherical deconvolution. Hum. Brain Mapp. 32, 461–479 (2011). 8. Haroon, H. A., Morris, D. M., Embleton, K. V., Alexander, D. C. & Parker, G. J. M. Using the model-based residual bootstrap to quantify uncertainty in fiber orientations from q-ball analysis. IEEE Trans. Med. Imaging 28, 535–550 (2009).
9. Dell’Acqua, F. et al. A modified damped Richardson-Lucy algorithm to reduce isotropic background effects in spherical deconvolution. Neuroimage 49, 1446–1458 (2010).
10. Dell’Acqua, F., Simmons, A., Williams, S. C. R. & Catani, M. Can spherical deconvolution provide more information than fiber orientations? Hindrance modulated orientational anisotropy, a true-tract specific index to characterize white matter diffusion. Hum. Brain Mapp. 34, 2464–2483 (2013).
Figures