5202
Tractography-Based Atlas of the Healthy Cortico-Spinal Tract1Dpt. of Mathematics, Politecnico di Milano, Milan, Italy, 2Dpt. of Radiology, Boston Children's Hospital, Harvard Medical School, Boston, MA, United States, 3Center for Analysis, Decisions, and Society, Human Technopole, Milan, Italy, 4Politecnico di Milano, Milan, Italy
Synopsis
The corticospinal tract is a critical white matter pathway as it connects the primary motor cortex to the spinal cord and handles voluntary motion. Atlases of major brain connections do exist, but, surprisingly, atlases that depict the actual localisation of a specific pathway are missing. In this work, we propose a comprehensive statistical methodology for generating an atlas of the healthy CST. This should help designing efficient statistical tests for detecting damaged tissue along the CST and consequently improving patient outcome in a number of brain pathologies (tumors, strokes, Parkinson and related disorders, etc.).
Introduction
The corticospinal tract (CST) connects the primary motor cortex with the spinal cord and is responsible for voluntary motion. Knowledge of its anatomic location is of paramount importance for many clinical applications such as presurgical planning for patients with brain tumor because resection of living CST tissues can yield irreversible devastating consequences [1]. In particular, it is known since Penfield's work [2] that the motor cortex is segmented into distinct areas handling voluntary motion of specific body parts. It is then critical to identify the tree structure of the CST. In this work, we propose the construction of an atlas of the healthy CST from diffusion MR tractography data. Specifically, we compare two statistical approaches, namely multivariate and functional data analysis (MDA and FDA), for generating such an atlas.Methods
Diffusion MR tractography enables the reconstruction of the CST as a set of streamlines, which are sequences of 3D points. Assuming we have a collection of $$$n$$$ healthy CSTs (left and right), our scope is to provide an atlas of the healthy CST, accounting for its challenging tree structure. We propose two solutions based on MDA and FDA. The general pipeline includes 4 steps: (S1) streamline parametrisation using the arc length over a uniform grid of size 50, (S2) streamline representation, (S3) outlier detection and (S4) streamline clustering for recovering the tree structure. S1 is common to both MDA and FDA approaches. Also, we performed the clustering mirroring the right CST onto the left CST and pulling all CSTs together. This avoids dealing with a computationally expensive label matching problem and offers a natural way of defining the optimal number of clusters as the minimal value above which a cluster sample size is less than a given threshold $$$n_\min$$$ in at least one subject and one hemisphere. MDA and FDA differ in the following aspects:
- (S2) Streamline are represented as a vector of shape features (including barycentre, spatial median, curvature, torsion, length and so on) in MDA while, in FDA, as a sequence of 3D points truncated to the length of the smallest one after removing length outliers.
- (S3) Streamline outliers are detected via the distance-based approach described in [3] applied to both barycenters and spatial medians in MDA while, in FDA, via functional boxplot [4] (amplitude outliers) and outliergram [5] (shape outliers).
- (S4) Clustering is performed using the clara algorithm [6] applied to the first principal component of the initial points (on the cortex) of the streamlines in MDA while, in FDA, using the k-medoid alignment algorithm [7] with a weighted $$$L^2$$$ distance that puts more weights on points near the cortex. Subsequently, within-cluster means of streamlines for generating atlases are obtained by first computing the mean feature vector and then identifying the streamline with feature vector at minimal Euclidean distance to the mean vector in MDA and by pointwise mean of aligned streamlines in FDA.
Results
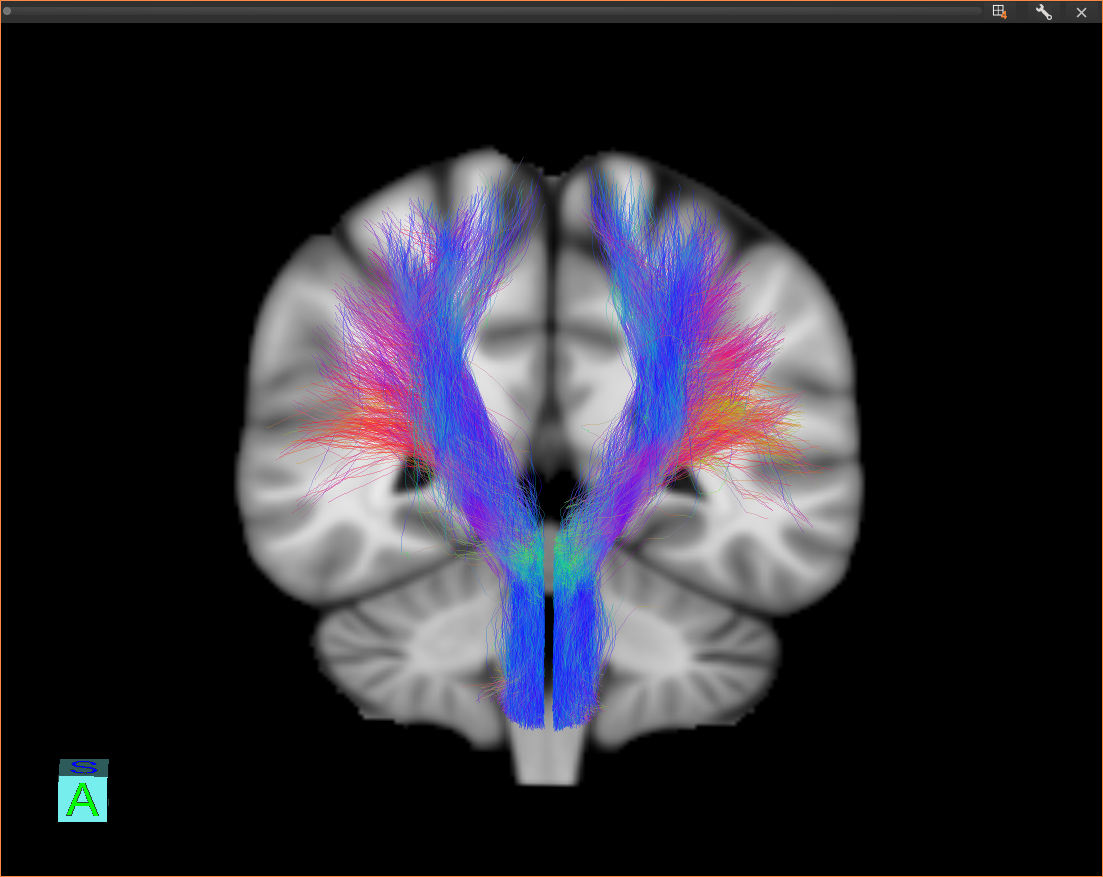
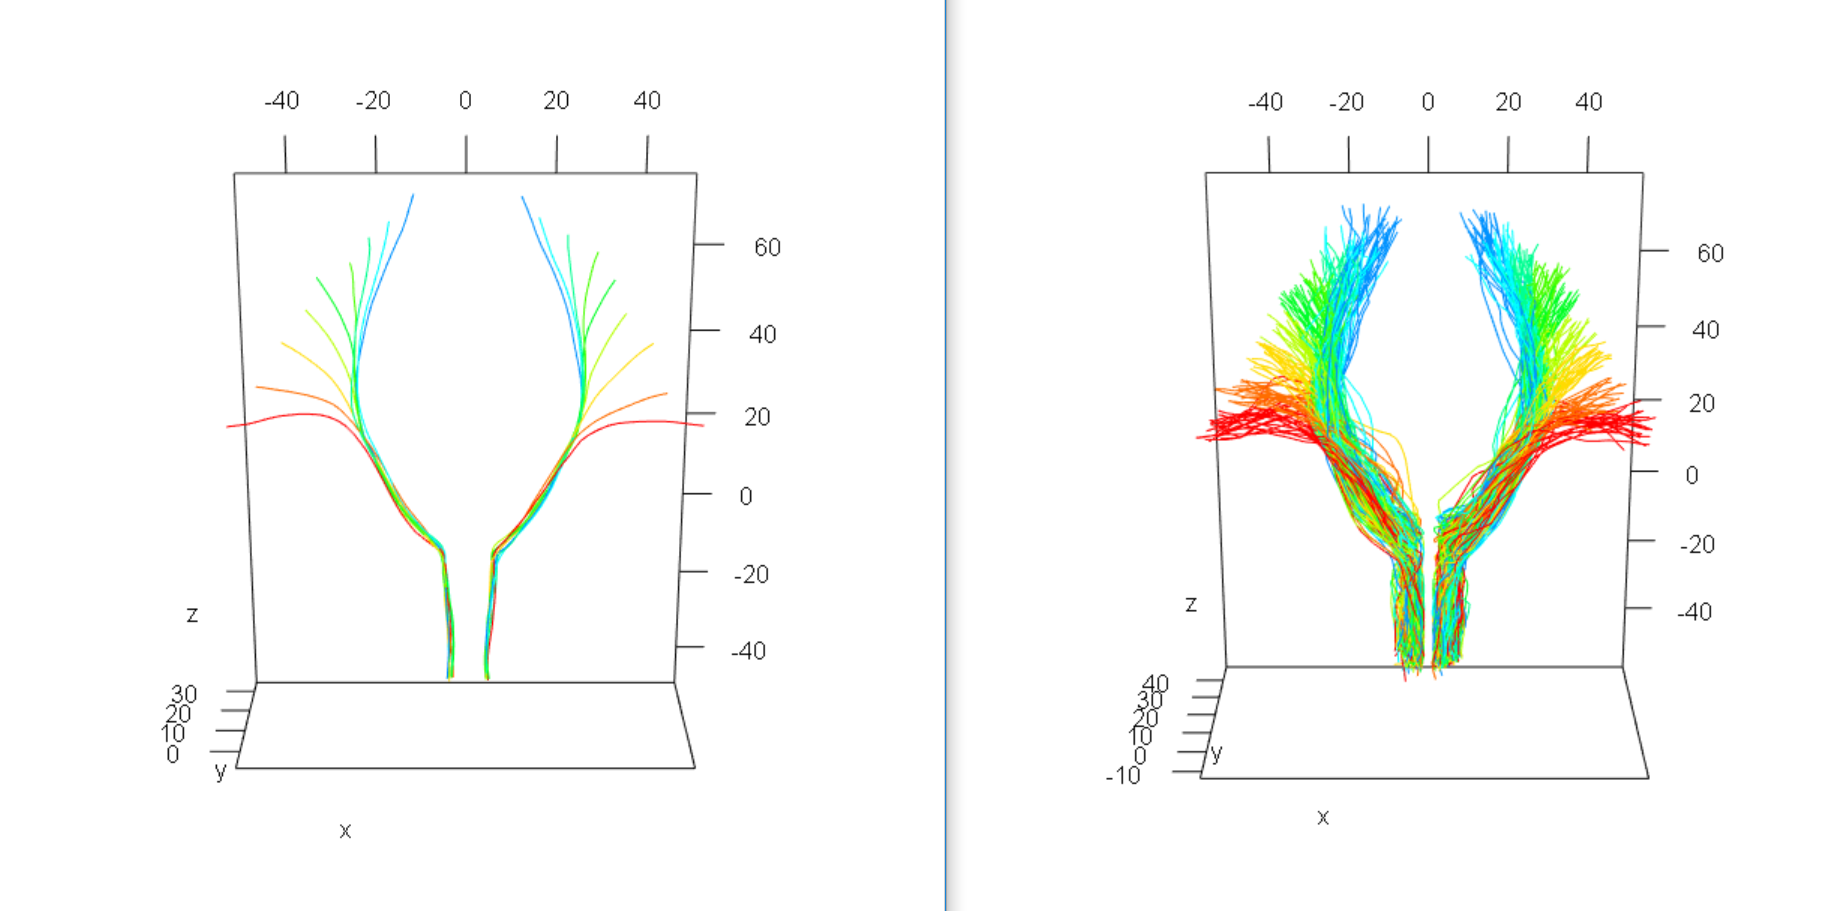
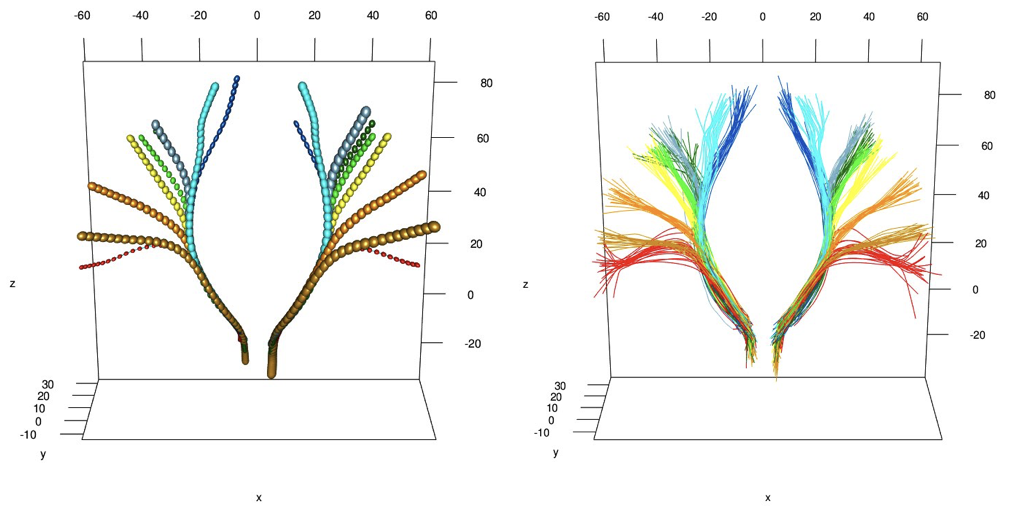
We scanned $$$n=20$$$ healthy subjects on a 3T Siemens Verio scanner using a 32-channel head coil. We collected single-shot EPI diffusion data at 2mm$$$^3$$$ resolution with 30 gradient-encoding directions at b-value $$$b=1000$$$s/mm$$$^2$$$ and one image at $$$b=0$$$. We included a T1 MPRAGE image at 1mm$$$^3$$$ resolution. We modeled diffusion using the single tensor model, projected the tensors onto MNI space [8-9] and ran a tractography algorithm [10] for tracing the CST, using the precentral gyrus as seed region and a hand-drawn region at the level of the spinal cord as filtering region. Figure 1 shows resulting tractography data for subject #1. Figures 2 & 3 shows atlas results using MDA and FDA respectively with $$$n_\min=20$$$.Discussion
Both MDA and FDA approaches lead to an optimal number of clusters of 9 and we can appreciate from Fig. 2 & 3 that the atlas nicely depicts cortical areas as one would expect according to Penfield's homunculus. The FDA approach, by focusing, in (S4), on the entire streamlines and not only on the points on the cortex, better exhibits the known twist in mid-height of the CST where streamlines coming from the lateral motor cortex cross with the ones coming from the upper cortex. The clustering on the cortex only however seems to better span the cortex.Conclusion
The obtained CST atlas is key for understanding CST alterations within patients suffering from brain disorders, ultimately improving patient outcome. The proposed atlases are promising and could be used to further develop statistical tests for comparing patient CSTs to this reference, with the goal of detecting CST parts damaged either in shape or in microstructure. The next critical step is validation by medical experts. Also, better tractography data and more subjects should yield an even finer segmentation of the motor cortex area.Acknowledgements
This work was partly supported by the 2014 Polimi International Fellowship program. MRI data were partly acquired on the Neurinfo MRI research facility from the University of Rennes I. Neurinfo is supported by the the European Union (FEDER), the French State, the Brittany Council, Rennes Metropole, Inria, Inserm and the University Hospital of Rennes.References
[1] Pujol, S., Wells, W., Pierpaoli, C., Brun, C., Gee, J., Cheng, G., Vemuri, B., Commowick, O., Prima, S., Stamm, A., Goubran, M., Khan, A., Peters, T., Neher, P., Maier-Hein, K. H., Shi, Y., Tristan-Vega, A., Veni, G., Whitaker, R., Styner, M., Westin, C.-F., Gouttard, S., Norton, I., Chauvin, L., Mamata, H., Gerig, G., Nabavi, A., Golby, A. and Kikinis, R. (2015) ‘The DTI Challenge: Toward Standardized Evaluation of Diffusion Tensor Imaging Tractography for Neurosurgery’, Journal of Neuroimaging, 25(6), pp. 875-82.
[2] Schott, G. D. (1993). Penfield's homunculus: a note on cerebral cartography. Journal of Neurology, Neurosurgery & Psychiatry, 56(4), pp. 329-33.
[3] Knorr, E. M. and Ng, R. (1997) ‘A Unified Notion of Outliers: Properties and Computation.’, KDD, pp. 219-22.
[4] Sun, Y. and Genton, M. G. (2012) ‘Adjusted functional boxplots for spatio-temporal data visualization and outlier detection’, Environmetrics, 23(1), pp. 54-64.
[5] Arribas-Gil, A. and Romo, J. (2014) ‘Shape outlier detection and visualization for functional data: the outliergram.’, Biostatistics (Oxford, England), 15(4), pp. 603-19.
[6] Kaufman, L. and Rousseeuw, P.J. (2008) ‘Clustering Large Applications (Program CLARA)’, In: Finding Groups in Data. John Wiley & Sons, Inc, pp. 126-63.
[7] Sangalli, L. M., Secchi, P., Vantini, S. and Vitelli, V. (2010) ‘-mean alignment for curve clustering’, Computational Statistics & Data Analysis. Elsevier B.V., 54(5), pp. 1219-33.
[8] Commowick, O., Wiest-Daessle, N. and Prima, S. (2012) ‘Block-matching strategies for rigid registration of multimodal medical images’, in 2012 9th IEEE International Symposium on Biomedical Imaging (ISBI). IEEE, pp. 700-3.
[9] Commowick, O., Wiest-Daesslé, N. and Prima, S. (2012) ‘Automated Diffeomorphic Registration of Anatomical Structures with Rigid Parts: Application to Dynamic Cervical MRI’, in Ayache, N., Delingette, H., Golland, P., and Mori, K. (eds) Medical Image Computing and Computer-Assisted Intervention – MICCAI 2012. Berlin, Heidelberg: Springer Berlin Heidelberg (Lecture Notes in Computer Science), pp. 163-70.
[10] Stamm, A., Commowick, O., Barillot, C. and Pérez, P. (2013) ‘Adaptive Multi-modal Particle Filtering for Probabilistic White Matter Tractography’, in Gee, J. C., Joshi, S., Pohl, K. M., Wells, W. M., and Zöllei, L. (eds) Information Processing in Medical Imaging. Berlin, Heidelberg: Springer Berlin Heidelberg (Lecture Notes in Computer Science), pp. 594-606.
Figures