5201
Ischemic optic neuropathy: Using Track-Weighted Imaging to detect changes in the neuroretina1Grenoble University Hospital, Grenoble, France, 2Inserm US 17 - CNRS UMS 3552 - Univ. Grenoble Alpes & CHU Grenoble Alpes, UMS IRMaGe, Grenoble, France
Synopsis
Track-Weighted Imaging was recently introduced as a qualitative tractography-based method with super-resolution properties and high anatomical contrast. We report the use of this method to explore the human retina. In healthy volunteers, we showed that reconstructions of neuroretinal fascicles were influenced by diffusion acquisition parameters, ocular laterality, and ocular dominance. We have raised the hypothesis that patients with anterior ischaemic optic neuropathy, a disease that leads to degeneration of neuroretinal cells, could present with specific neuroretinal fascicle injuries. We demonstrated that presence of the temporal fascicle in the affected eye provides an objective outcome radiological sign correlated with visual recovery.
Introduction
Using optical coherence tomography, ophthalmologists have defined the papillomacular bundle as a connection between the optic disc and the macula, an important structure in determining visual field integrity in anterior ischemic optic neuropathy (AION)(1). Calamante et al.(2) used Track-Weighted Imaging (TWI) to increase spatial resolution of diffusion-weighted imaging. In DWI (Diffusion-weighted imaging), the number of diffusion-weighting directions influences the quality of tractographic reconstructions. The analysis of diffusion imaging to explore the normal neuroretina should also take into account inherent anatomical variability, such as ocular laterality (i.e left or right eye) and ocular dominance, defined as the unconscious preference of visual input from one eye compared to the other for monovision taks. We aimed:
(i) To test the effect of number of diffusion-weighting directions, ocular laterality and ocular dominance on healthy retinal fascicles distribution as evaluated using TWI.
(ii) To evaluate neuroretinal tractography to diagnose anterior ischaemic optic neuropathy.
(iii) To correlate neuroretinal fascicle injuries with visual field defect at the baseline examination and at the 6-month visit.
Material and Methods
20 healthy volunteers (12 women, 8 men; mean age 56.5 years; SD±10.8 years) and 20 patients with a clinical diagnosis of unilateral AION (10 women, mean age 62.7 years; SD±9.4 years) were included. MRI was performed on a Philips Achieva® 3.0T TX.
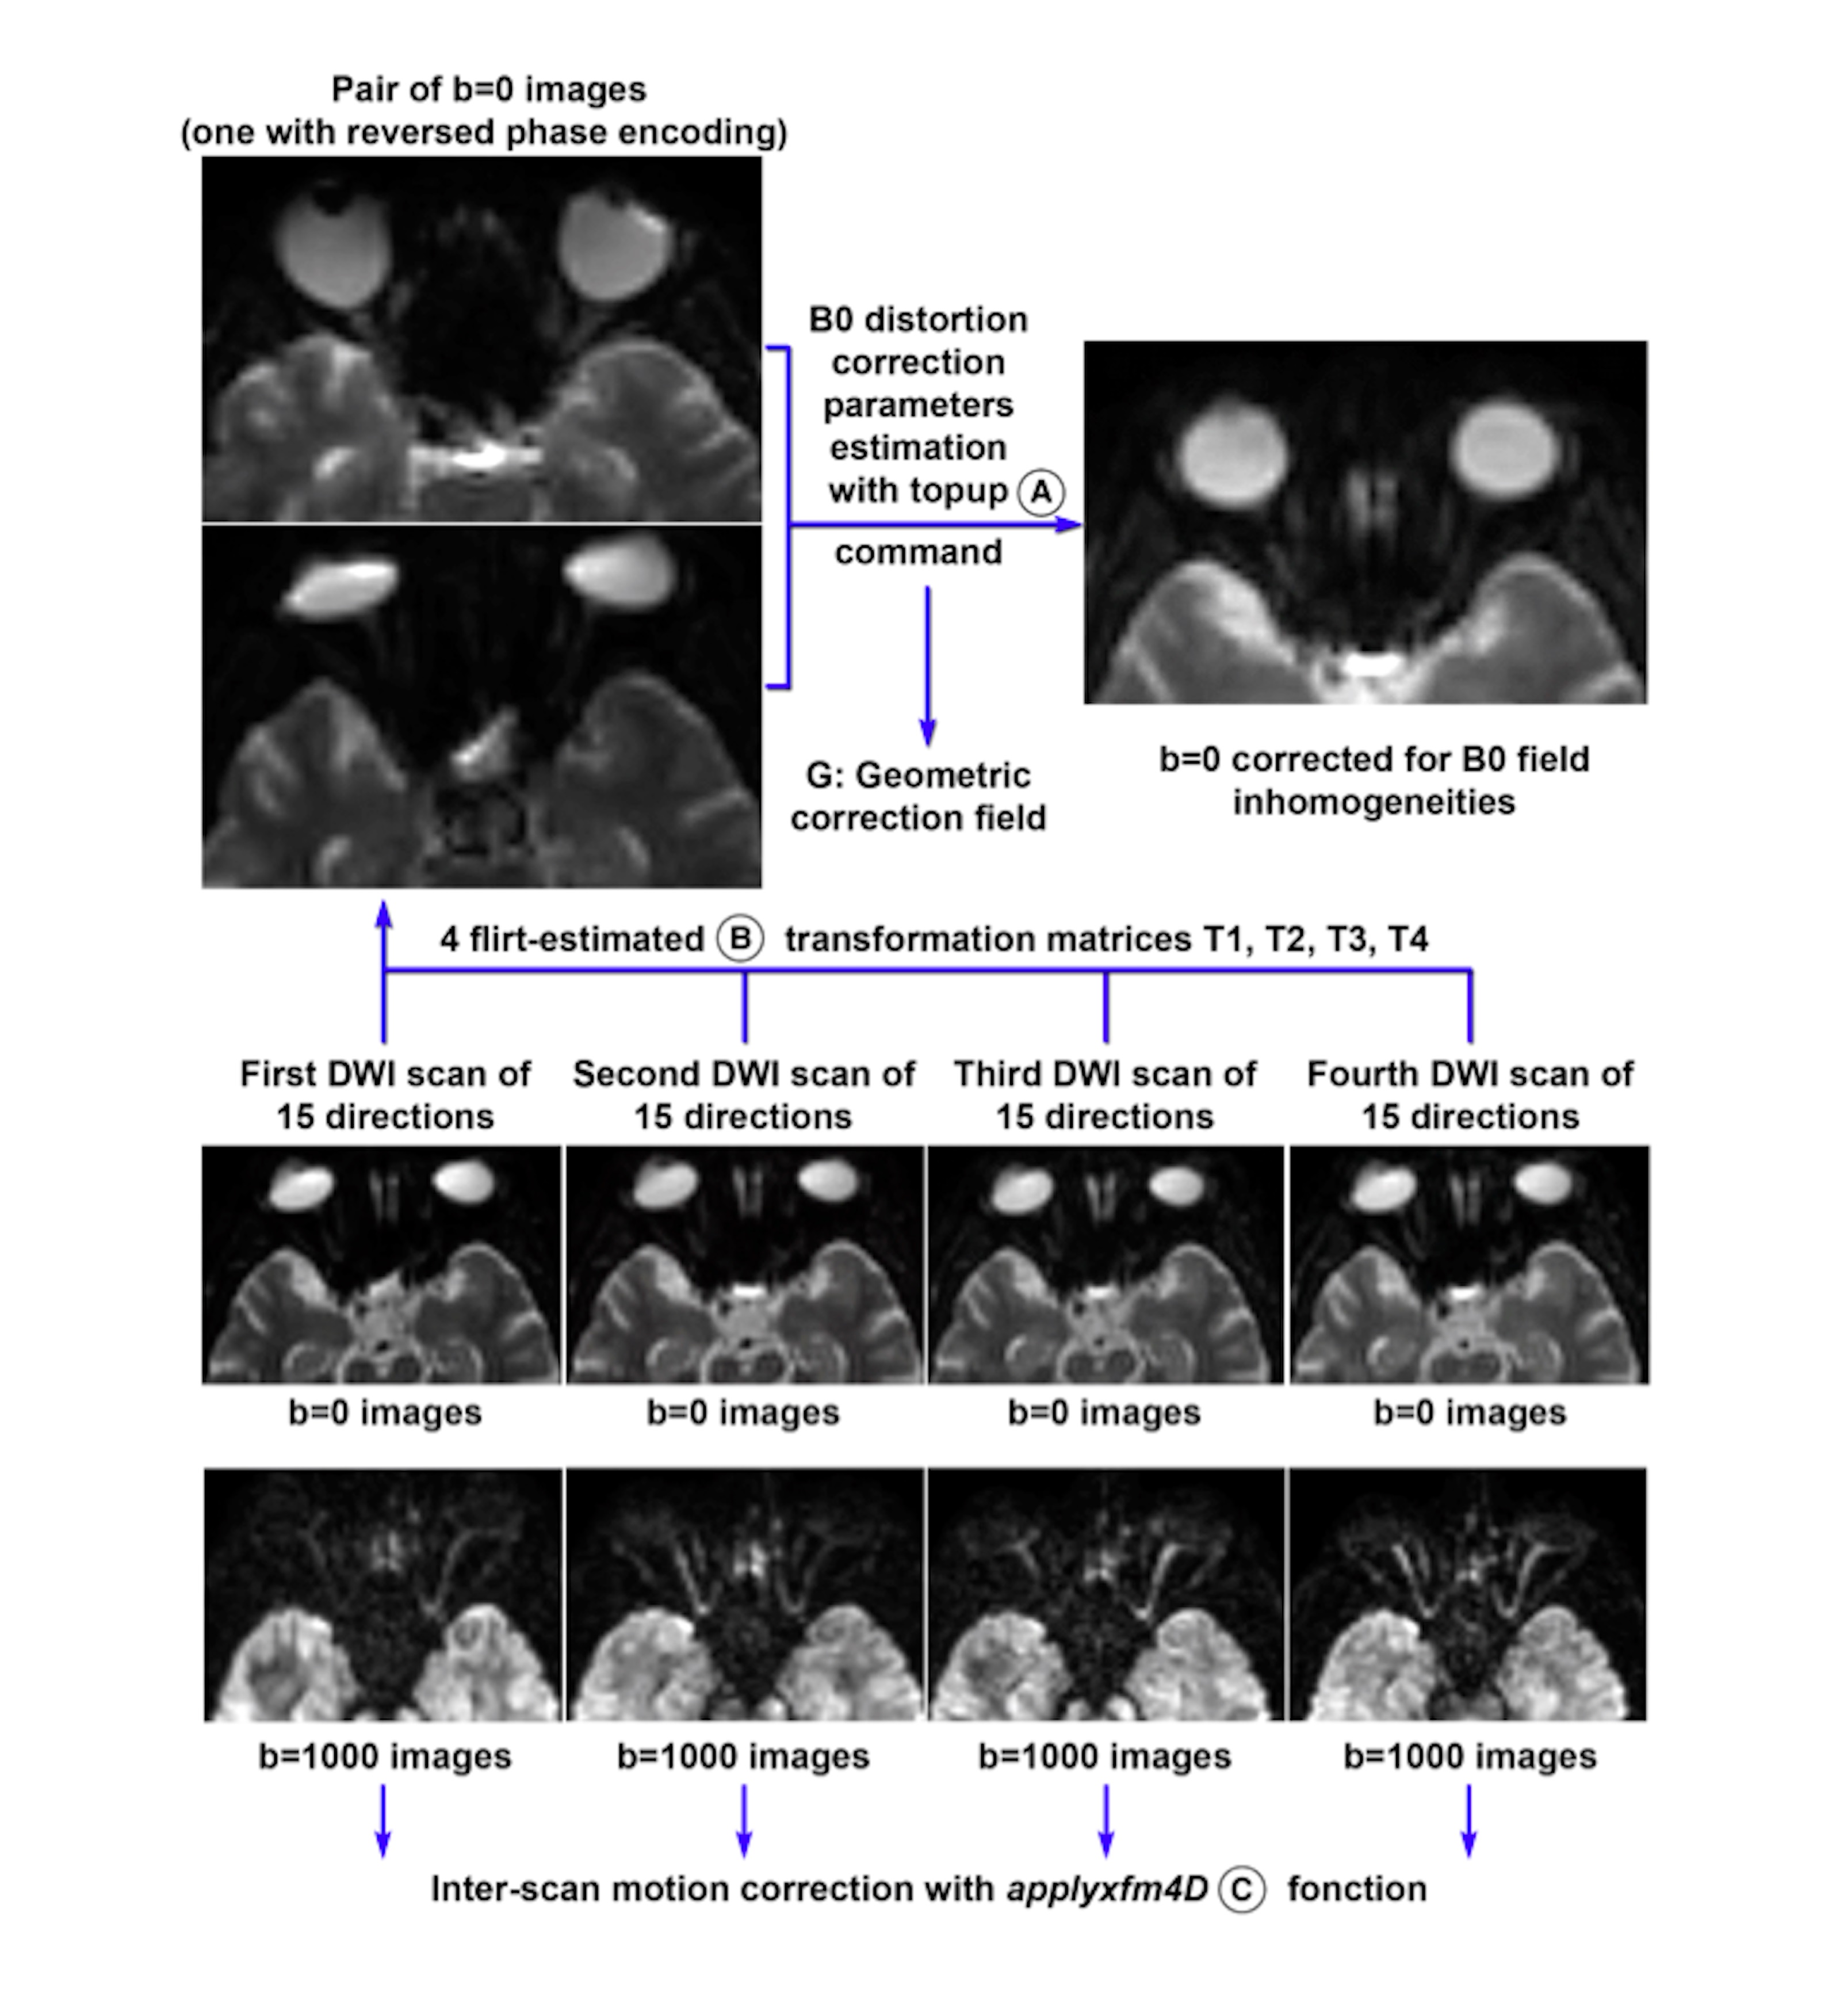
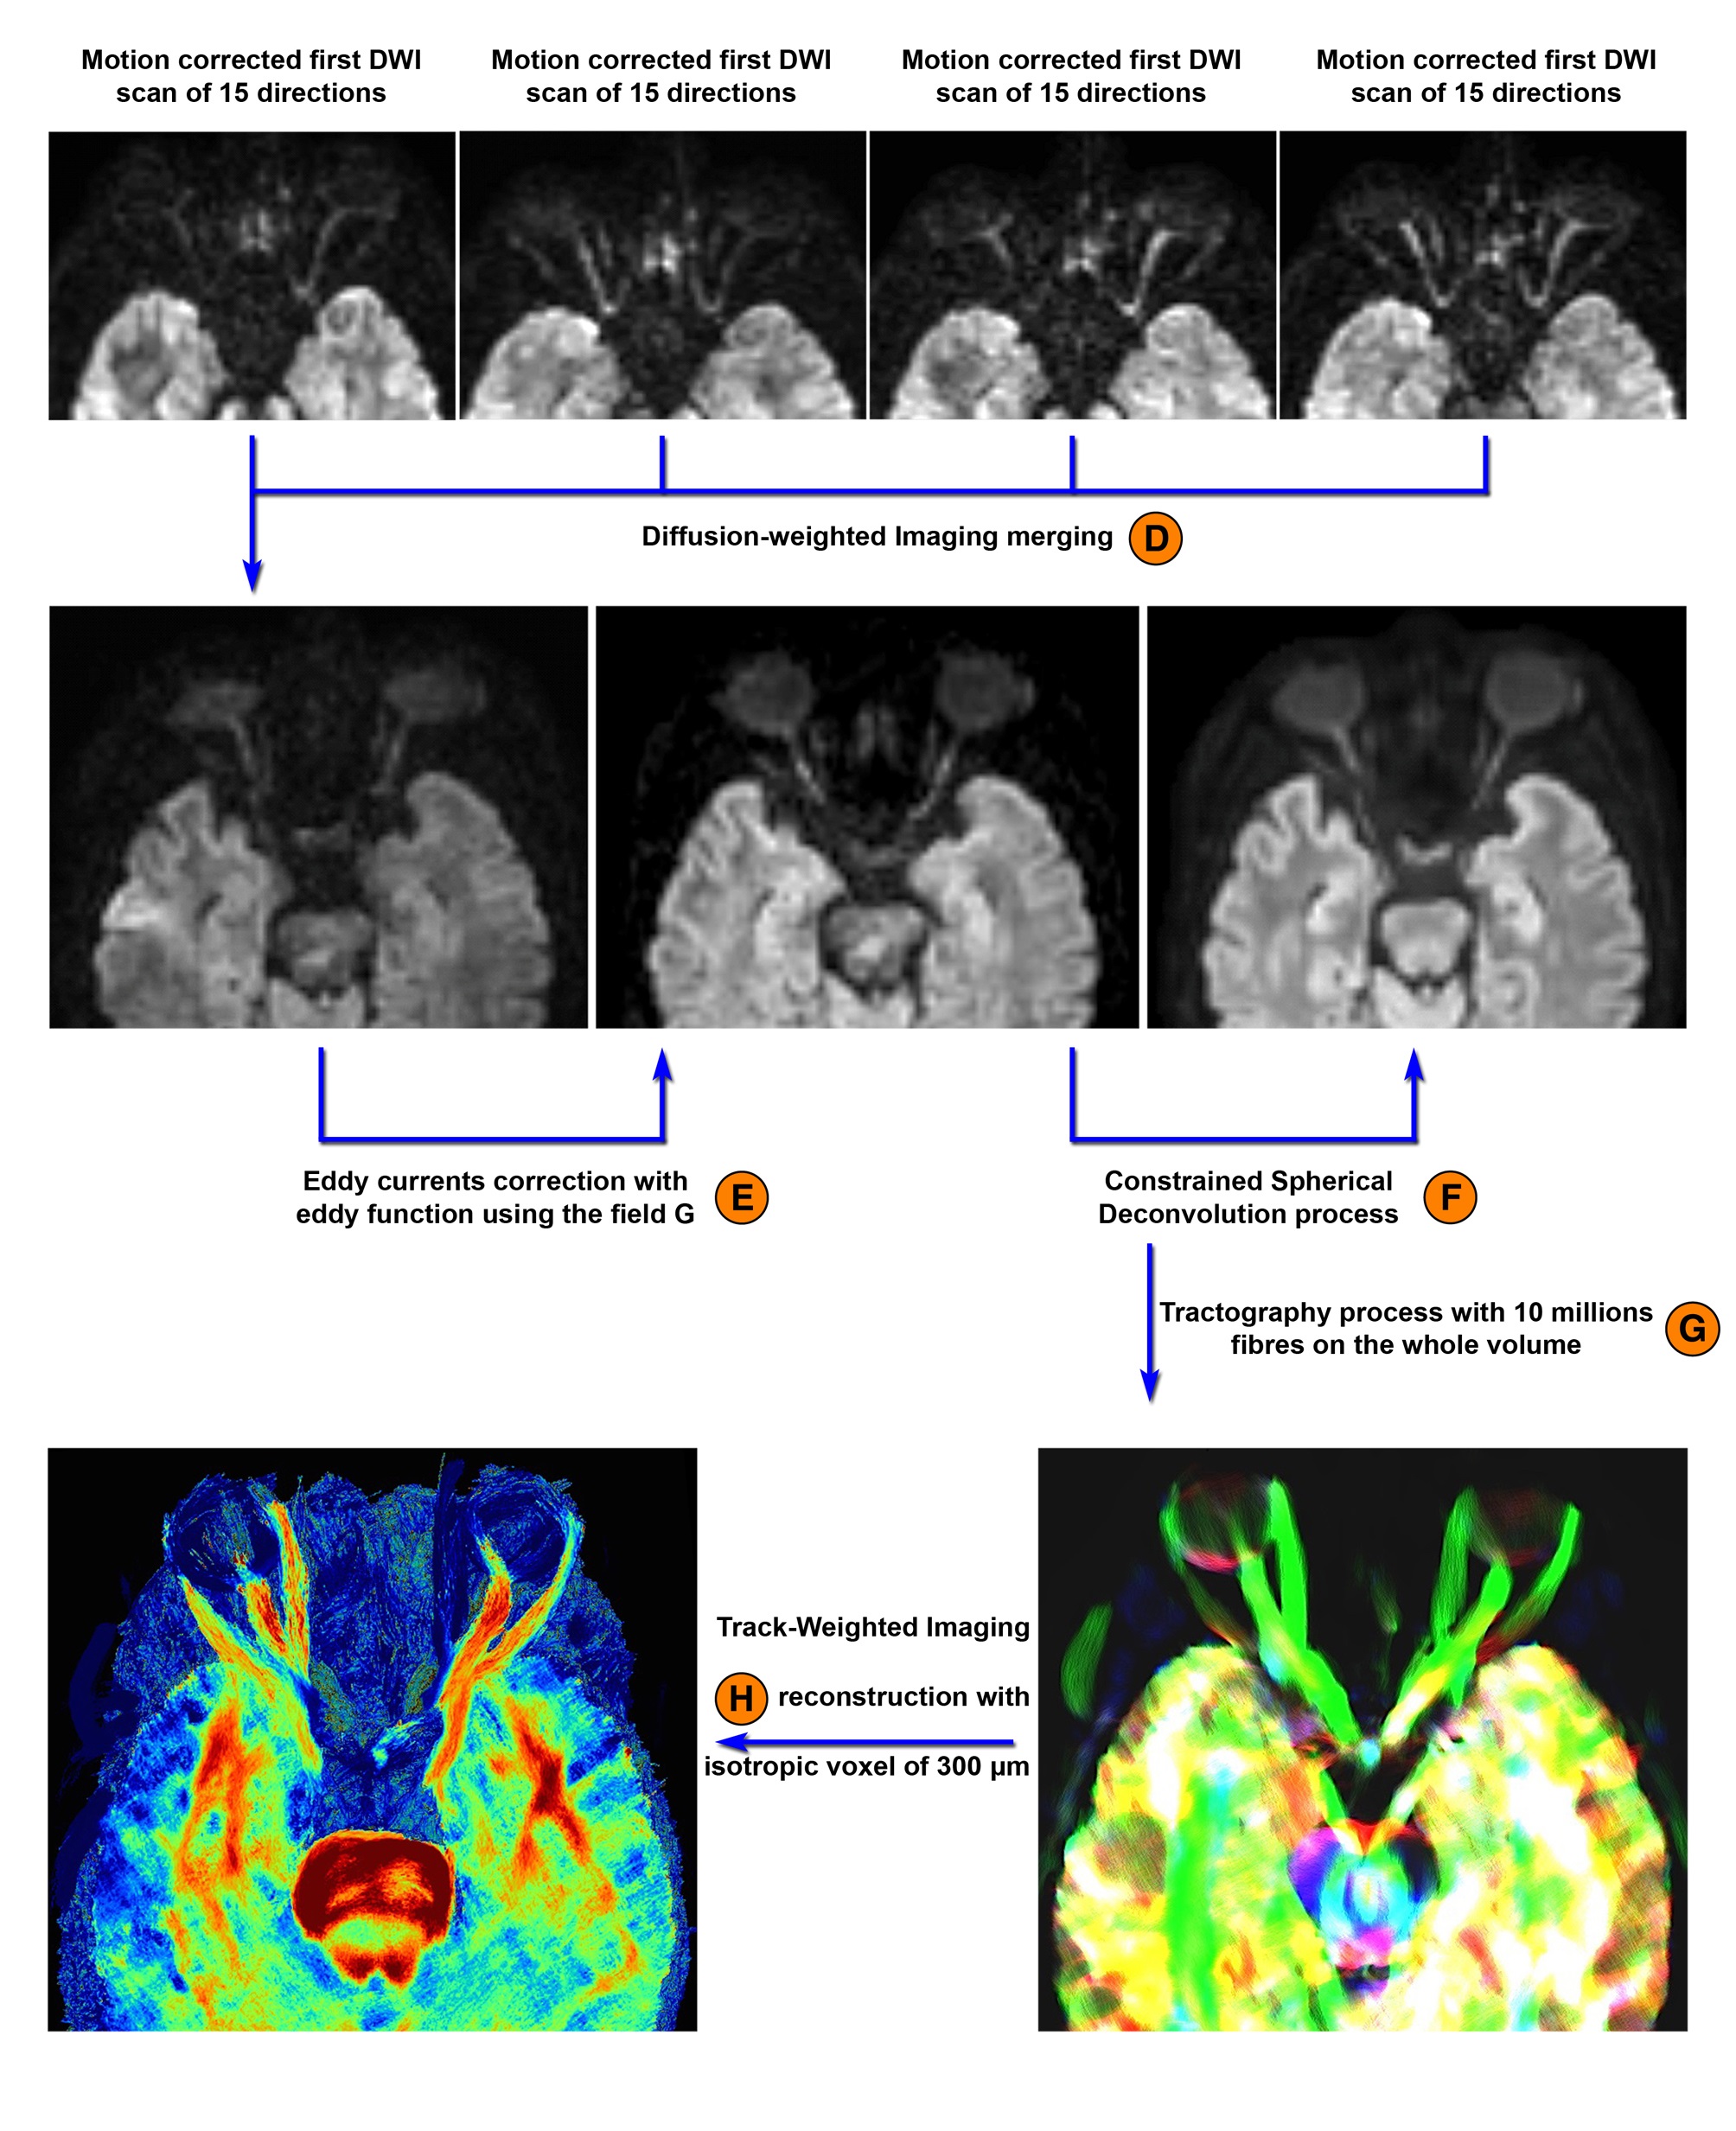
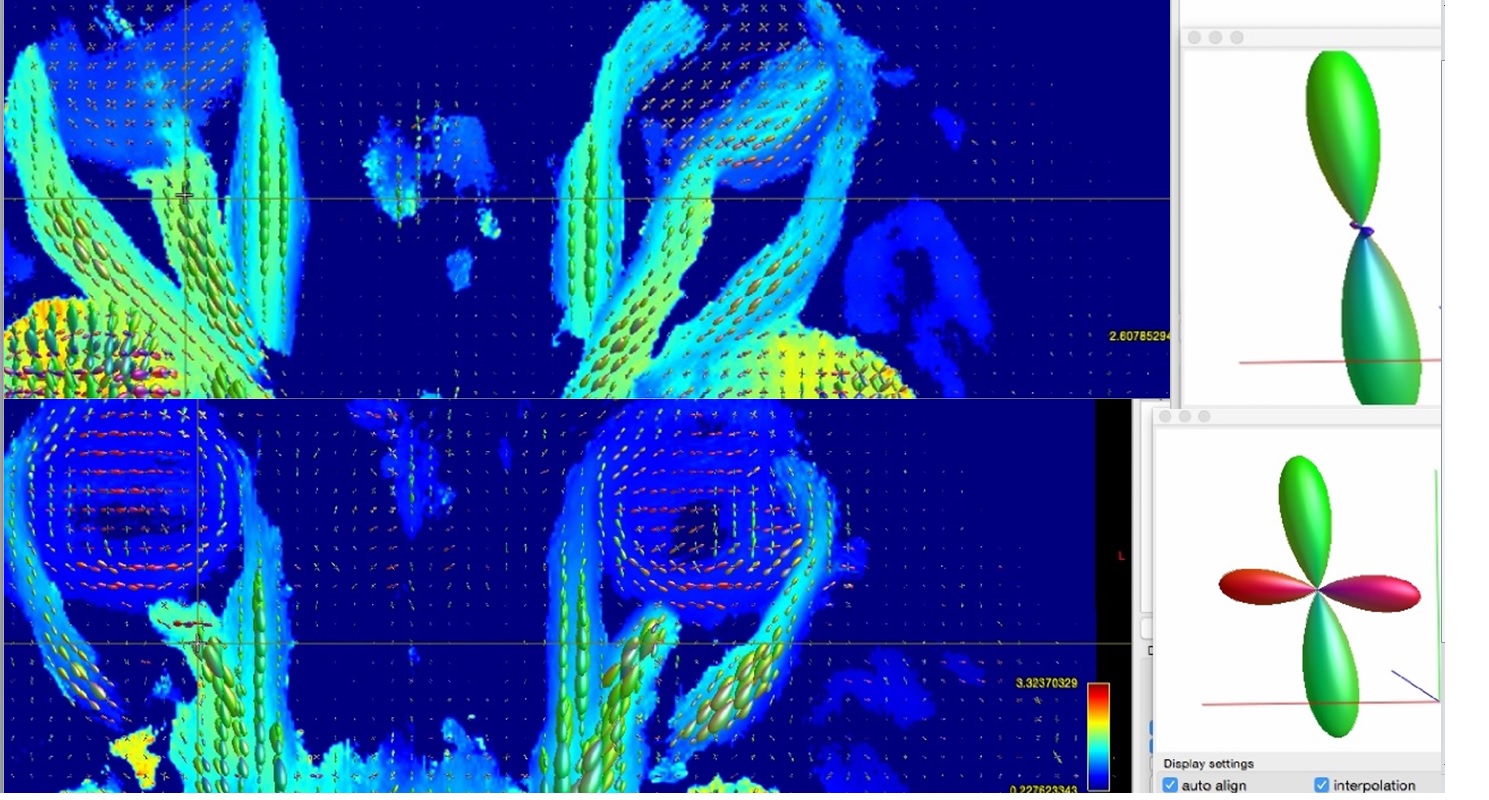
For the diffusion-weighted acquisition, a b-value of 1000 s/mm2 was used with 60 diffusion-weighting non-collinear directions distributed over four scans, each with 15 directions and one b=0 acquisition. Each 15 directions-subset used a method for generating orientation acquisition schemes yielding an optimal spatial distribution of the orientations. For each subject, a multiplicative bias factor was estimated using the b=0 s/mm2 images to take into account automatic receiver gain adjustement between scans. Intra-scan and inter-scans movements, susceptibility and eddy currents artifacts were estimated and corrected for (Figures 1 and 2). We estimate fiber orientation distributions using the Constrained Spherical Deconvolution (CSD) model(3), producing tractography maps for the neuroretina based on 30, 45 and 60 diffusion-weighted directions.
Post-processing steps were performed using MRtrix3 (http://www.mrtrix.org). To estimate fiber orientation distributions using the CSD model, we calculated the response function by an axially symmetric tensor with a FA threshold, appropriate at low b-values. We used the same response function for all subjects. The number of spherical harmonic terms was set to 6.
We performed a volumetric tractography method, whereby 10 million streamlines are initiated from seed points randomly distributed throughout the orbital area in each individual’s own space (Label G on Figure 2). We set the initial fractional anisotropy cutoff for terminating tracks to 0.3 and the minimum length of fibers to 10 mm. We then reconstructed TWI maps with isotropic voxel size of 300 µm for reconstructions using super-resolution properties. TWI maps were performed to produce an image of the mean length of fibers through each voxel rather than their count(4). We performed factorial analysis of variance (ANOVA) to test the main effects of the presence/absence or location of the fascicles on the visual field defect at the baseline examination and at the 6-month visit.
Results
In healthy volunteers, tractography maps based on 30 directions detected significantly fewer fascicles than those based on 60 directions (p=6×10⁻⁷) and 45 directions (p=9×10⁻⁸). We found no significant difference between the number of fascicles in the right and the left eyes, with the exception of the temporal fascicle (p=0.001). There were significantly more superior fascicles in dominant eyes than in non-dominant eyes (p=0.014).
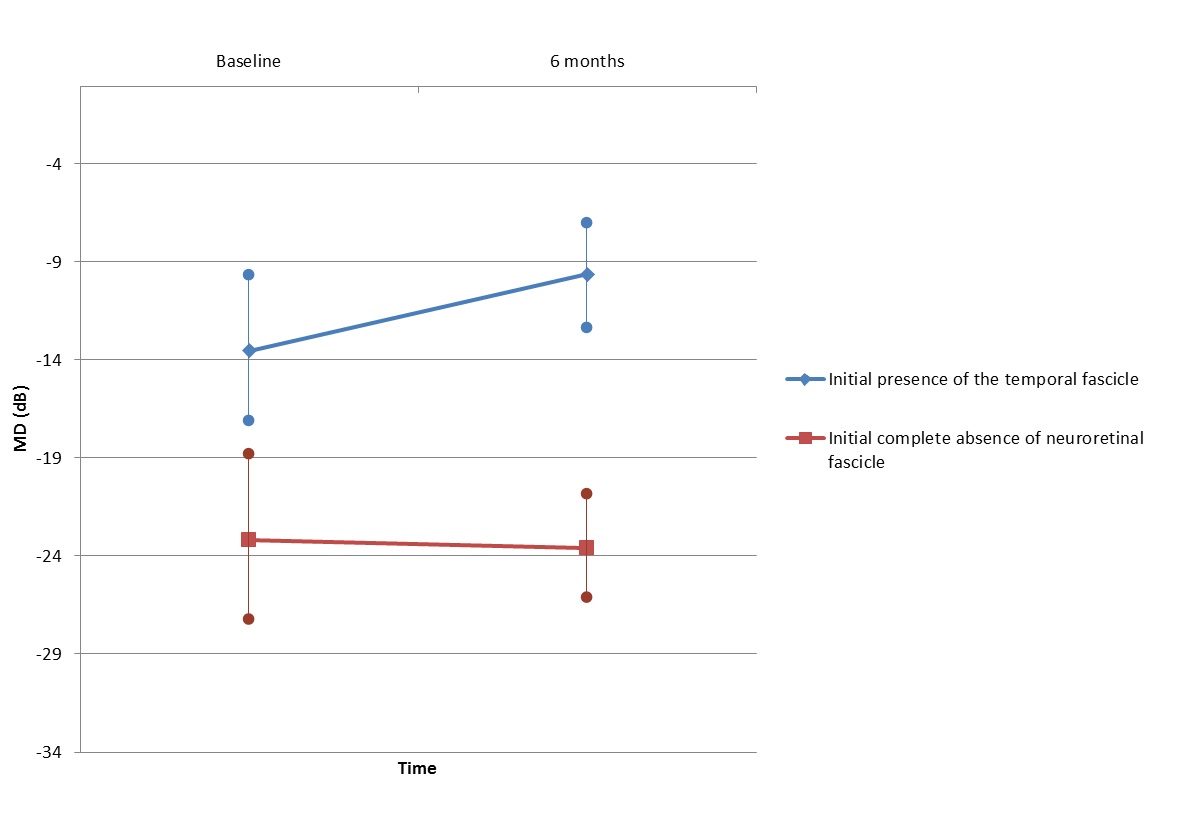
8 out of 20 AION patients presented with complete absence of neuroretinal fascicle, side of the disease, which was correlated with visual field mean deviation at the 6 month-visit [F(1, 17) = 6.97, p= 0.016]; with visual field defects estimated with a mean of -23.57 dB (±10.9). 7 patients presented with a temporal fascicle in the injured eye. This fascicle presence was linked to visual field mean deviation at the 6 month-visit [F(1, 17) = 8.43, p= 0.009]. In these patients, visual field defects were estimated with a mean of -9.62 dB (±5.6) at follow-up.
Discussion
The identification of neuroretina fascicles distribution in healthy volunteers greatly facilitated the identification of AION in patients with complete absence of neuroretinal fascicle, which is specific to the disease and to exclude other differential diagnosis.TWI reconstructions potentially aid understanding of the pathophysiological mechanism; visual field outcome at the 6-month visit was linked with presence of the neuroretinal temporal fascicle.
Conclusion
The role of the temporal fascicle, as identified using Track-Weighted Imaging, is in accordance with anatomical knowledge of the importance of temporal neuroretina integrity for the vision process in the AION disease.Acknowledgements
Authors acknowledge the assistance of Patrice Jousse for the work in editing MR images.References
(1)Rebolleda G, Sánchez-Sánchez C, González-López JJ, Contreras I, Muñoz-Negrete FJ. Papillomacular bundle and inner retinal thicknesses correlate with visual acuity in nonarteritic anterior ischemic optic neuropathy. Invest Ophthalmol Vis Sci. 2015;56(2):682-692. doi:10.1167/iovs.14-15314.
(2)Calamante F, Tournier J-D, Jackson GD, Connelly A. Track-density imaging (TDI): super-resolution white matter imaging using whole-brain track-density mapping. Neuroimage. 2010;53(4):1233-1243. doi:10.1016/j.neuroimage.2010.07.024.
(3)Tournier J-D, Calamante F, Connelly A. Robust determination of the fibre orientation distribution in diffusion MRI: non-negativity constrained super-resolved spherical deconvolution. Neuroimage. 2007;35(4):1459-1472. doi:10.1016/j.neuroimage.2007.02.016.
(4)Pannek K, Mathias JL, Bigler ED, Brown G, Taylor JD, Rose SE. The average pathlength map: a diffusion MRI tractography-derived index for studying brain pathology. Neuroimage. 2011;55(1):133-141. doi:10.1016/j.neuroimage.2010.12.010.
Figures
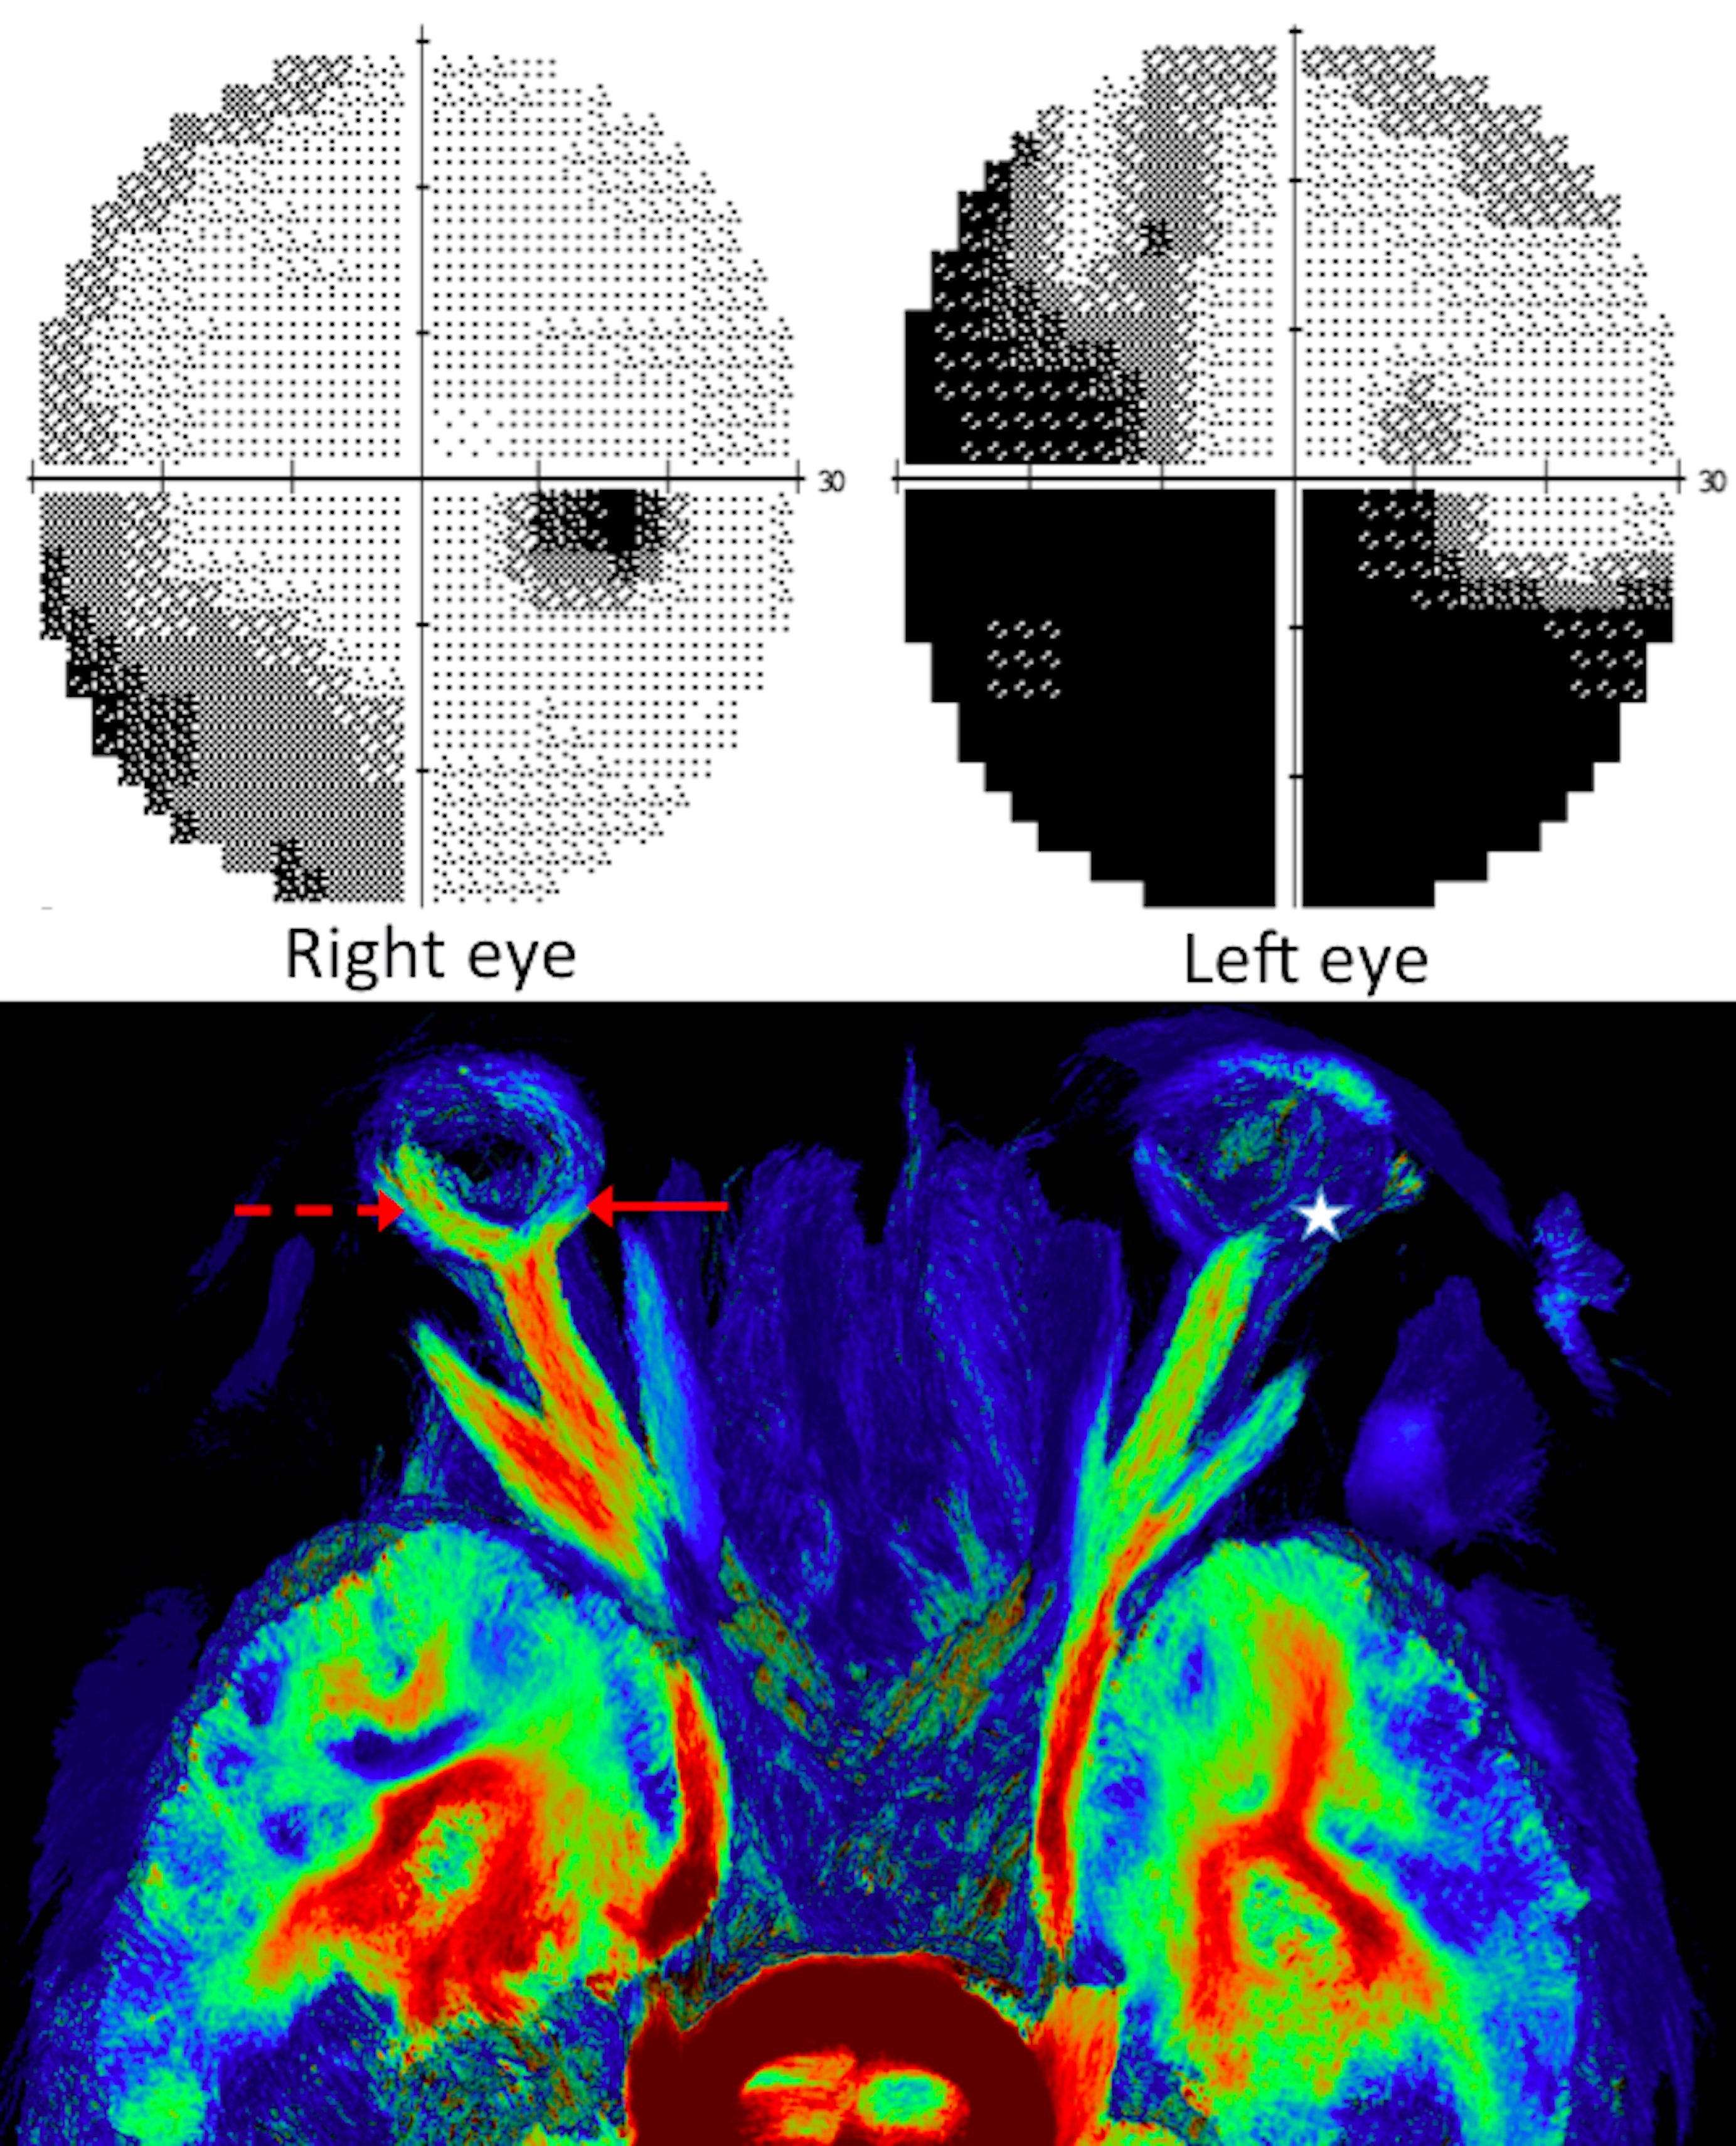
Visual field exploration and associated tractography map in a patient presenting with left-sided AION related to Giant Cell Arteritis.
On the 6-month visual field, the mean deviation was estimated to be -19 dB on the left side (upper left) and -5 dB on the right side (upper right). On the tractography map, we did not see neuroretinal fascicle (white star) on the disease-affected side, by contrast with the fellow eye with temporal fascicle (dotted red arrow) and nasal fascicle (red arrow). All healthy volunteers presented with at least one neuroretina fascicle in both eyes, opposite to this AION patient.