5200
The uncinate fasciculus: hemispheric asymmetries of DTI metrics and curvature mapping1Department of Biomedical and NeuroMotor Sciences, University of Bologna, Bologna, Italy, 2Functional MR Unit, Policlinico S.Orsola-Malpighi, Bologna, Italy, 3Department of Physics and Astronomy, University of Bologna, Bologna, Italy, 4Centro Enrico Fermi, Roma, Italy
Synopsis
We reconstructed the uncinate fasciculus bilaterally by probabilistic tractography in a group of 29 healthy subjects, in order to quantitatively investigating hemispheric asymmetries. We evaluated tract volume and DTI metrics. Our tract Laplacian parameterization successfully described curving bundles and allowed the calculation of along-tract measures and curvature mapping. Group variability maps showed a more dorsal route in the left hemisphere, towards the lateral fronto-orbital cortex. We also found a higher fractional anisotropy on the right compared to the left and different tract curvature. These asymmetries could be associated to specific tract functions as semantic and emotional processing, selectively affected in pathologies.
Introduction
Methods
29 healthy subjects (F/M= 14/15, age [mean±sd]= 38±18 y) underwent a standardized brain MRI protocol (1.5T GE scanner), including T1-weighted volumetric imaging (FSPGR sequence, TI = 600 ms, TE = 5.1 ms, TR = 12.5 ms, voxel=1x1x1 mm3) and DWI (TR=10 s, b=900 s/mm2, 7 volumes with null b-value, 64 diffusion gradient directions , voxel=1.25x1.25x3 mm3). The UF tractography was performed using a probabilistic method based on constrained spherical deconvolution modelling (ifod2, http://www.mrtrix.org).3 We used the tractographic ROIs suggested in the AutoPtx toolbox (https://fsl.fmrib.ox.ac.uk/fsl/fslwiki/AutoPtx). Tractography results were thresholded at 10% of the maximum of connectivity within each voxel. We used group variability maps and three dimensional rendering in the MNI standard space. Along-tract evaluation was restricted to the UF portion between the tractographic ROIs (Fig1-A), labelled UF core. We parameterized the UF volume by modeling its volume surface with a triangular mesh and evaluating the graph Laplacian on the mesh edge matrix. We evaluated the Laplacian Fielder vector to establish an intrinsic coordinate system and we divided the UF in eight segments. We evaluated volume and DTI metrics (FA, MD, λ1, λ2 and λ3) both in the whole UF core and along-tract, and we measured centroid coordinates of each UF segment. The non-parametric paired Wilcoxon signed-rank test, was used for left-right comparisons, with a significant level set at p<0.05 and corrected by the FDR (False Discovery Rate) method for multiple comparisons across UF segments. We implemented this procedure in Matlab (R2017a).Results
For
all subjects we were able to bilaterally reconstruct the UF and to perform
along-tract parameterization (Fig1-B). Group variability maps showed different cortical
terminations towards the frontal lobe in particular, the left UF was more
dorsally located projecting towards the lateral FOC, whereas the right UF was
more ventrally located targeting the right medial FOC and frontal pole (Fig2). At
the whole-tract level, we found significant left-right differences only in the FA
measure, with a left hemisphere values being higher (Fig3). At the along-tract level,
we found significant hemispheric asymmetries in both volume and diffusion
measures (Fig4). Evaluating UF segments coordinates, we found significant
differences in tract localization and curvature (Fig5). Discussion
We chose to perform UF tractography by probabilistic constrained spherical deconvolution, since it models crossing fibers and allows a more accurate description of the white matter. The Laplacian parameterization, which we previously implemented for the arcuate fasciculus,4 allowed a good description of along-tract measures, well describing curving bundles. A two-component model for the left UF has previously been described in the literature both in-vivo and ex-vivo, identifying one ventral and one dorsal component. 5,6 In our bilateral UF evaluation, we found that the dorsal component was most present on the left, in agreement with Hau et al. 7. We measured an FA greater on the left than the right, although there is not a consensus in the literature on this directionality; our findings support the hypothesis of a stronger route in the left hemisphere, often dominant in language processing. The FA profile was bilaterally higher in the frontal segments, where the UF fibers are highly packed under the subinsular structures. 8,9 The UF curvature was significantly different between the hemispheres, and this asymmetry reflects different cortical projections: the UF terminations are more dorsal in the frontal left hemisphere, whereas the right UF curved more sharply towards a more superior and anterior portion of the ATL.Conclusion
Asymmetries in tract structure between the right and left UF may reflect different hemispheric roles in cerebral functions, in particular regarding semantic language processing or emotional processing, which could be selectively damaged in clinical variants of primary progressive aphasia.10,11 To our knowledge this is the first study that describes the UF along-tract coordinates; this could be informative in pre-surgical planning and in the evaluation of white matter reorganization after damage or during rehabilitation planning.Acknowledgements
No acknowledgement found.References
- Von Der Heide RJ, Skipper LM, Klobusicky E, Olson IR. Dissecting the uncinate fasciculus: disorders, controversies and a hypothesis. Brain. 2013;136(Pt 6):1692-707. Review.
- Dick AS, Bernal B, Tremblay P. The language connectome: new pathways, new concepts. Neuroscientist. 2014;20(5):453-67. Review.
- Tournier JD, Calamante F, Connelly A. Improved probabilistic streamlines tractography by 2nd order integration over fibre orientation distributions. Proc. Intl. Soc. Mag. Reson. Med. 2010.
- Talozzi L, Testa C, Zanigni S, Evangelisti S, Gramegna LL, Bianchini C, Fantazzini P, Tonon C, Manners DN, Lodi R. Hemispheric asymmetries and grey matter projections of the arcuate fasciculus: an along-tract study of diffusion and localization properties with deterministic and probabalistic tractography. Proc. Intl. Soc. Mag. Reson. Med. 2017.
- Catani M, Howard RJ, Pajevic S, Jones DK. Virtual in vivo interactive dissection of white matter fasciculi in the human brain. Neuroimage. 2002; Sep;17(1):77-94.
- Kier EL, Staib LH, Davis LM, Bronen RA. MR imaging of the temporal stem: anatomic dissection tractography of the uncinate fasciculus, inferior occipitofrontal fasciculus, and Meyer's loop of the optic radiation. AJNR Am J Neuroradiol. 2004 May;25(5):677-91.
- Hau J, Sarubbo S, Houde JC, Corsini F, Girard G, Deledalle C, Crivello F, Zago L, Mellet E, Jobard G, Joliot M, Mazoyer B, Tzourio-Mazoyer N, Descoteaux M, Petit L. Revisiting the human uncinate fasciculus, its subcomponents and asymmetries with stem-based tractography and microdissection validation. Brain Struct Funct. 2017; 222(4):1645-1662.
- Rodrigo S, Naggara O, Oppenheim C, Golestani N, Poupon C, Cointepas Y, Mangin JF, Le Bihan D, Meder JF. Human subinsular asymmetry studied by diffusion tensor imaging and fiber tracking. AJNR Am J Neuroradiol. 2007; 28(8):1526-31.
- Yeatman JD, Dougherty RF, Myall NJ, Wandell BA, Feldman HM. Tract profiles of white matter properties: automating fiber-tract quantification. PLoS One. 2012;7(11):e49790.
- Agosta F, Galantucci S, Canu E, Cappa SF, Magnani G, Franceschi M, Falini A, Comi G, Filippi M. Disruption of structural connectivity along the dorsal and ventral language pathways in patients with nonfluent and semantic variant primary progressive aphasia: a DT MRI study and a literature review. Brain Lang. 2013;127(2):157-66.
- Multani N, Galantucci S, Wilson SM, Shany-Ur T, Poorzand P, Growdon ME, Jang JY, Kramer JH, Miller BL, Rankin KP, Gorno-Tempini ML, Tartaglia MC. Emotion detection deficits and changes in personality traits linked to loss of white matter integrity in primary progressive aphasia. Neuroimage Clin. 2017; 26;16:447-454.
Figures
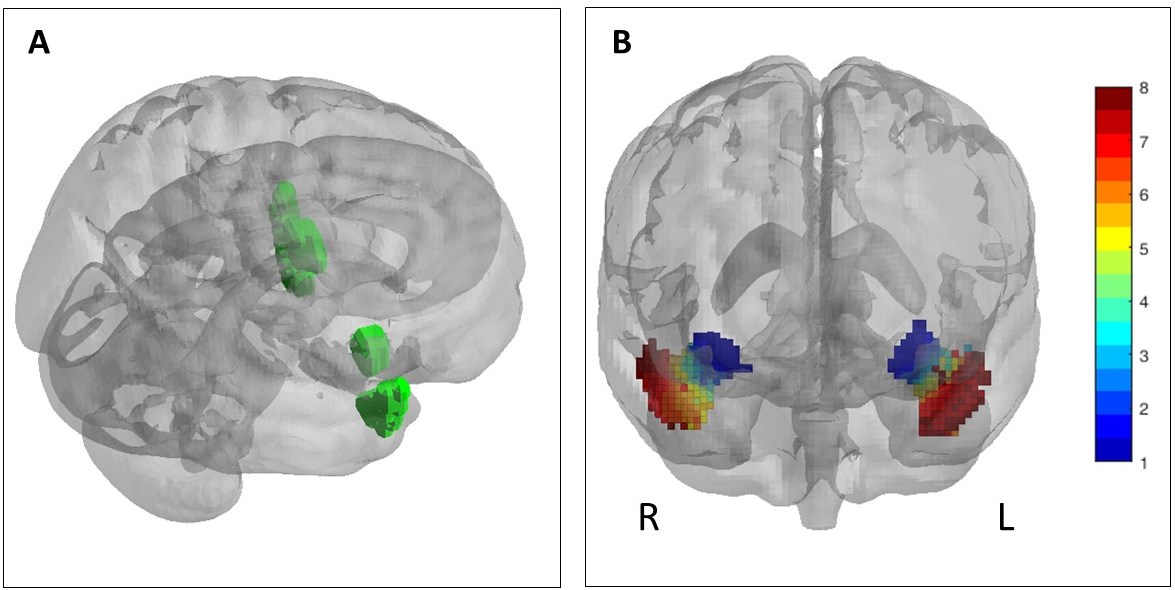
Figure 1
A: 3-dimensional rendering of the tractographic ROIs (green) used for the UF tractography, on the MNI-152 brain. These ROIs were also used to define the UF core within which we compared volume and diffusion measures between hemispheres.
B: 3-dimensional rendering of the mean Laplacian parameterization across all the subjects, dividing the UF into eight segments (blue=1st frontal segment, red = 8th temporal segment), projected onto the MNI-152 brain.
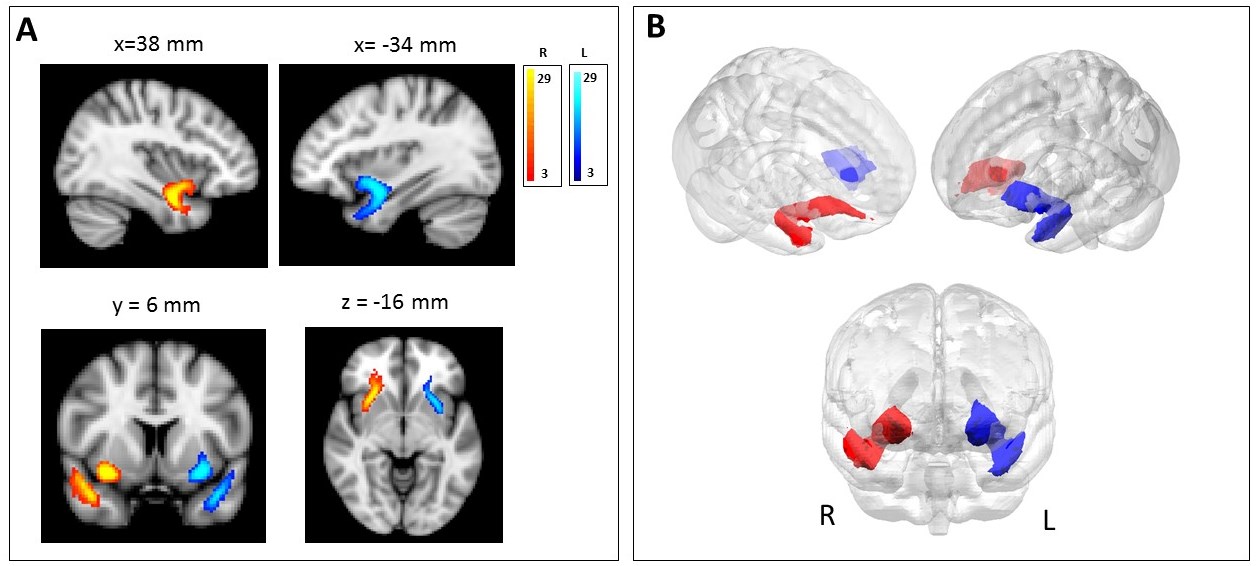
Figure 2
A: Sagittal, coronal and axial views of the Group Variability (GV) maps, thresholded at the 10% of subjects; the intensity scales of the maps are scaled to the minimum and maximum of the subjects represented by the GV maps. Coordinates of the projections shown were reported in mm in the MNI-152 standard space.
B: 3-dimensional rendering of GV maps volume on the MNI-152 brain, thresholded at the 10% of subjects. The left UF was colored in blue, the right UF in red.
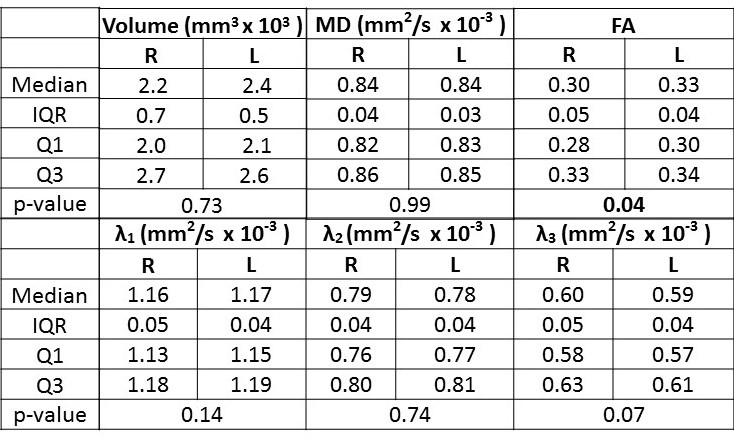
Figure 3
Table showing median, interquartile (IRQ), 25th (Q1) and 75th (Q3) percentile values of volume and diffusion parameters (FA, MD, λ1, λ2 and λ3) for the right and left UF core. Corresponding p-values of the Wilcoxon signed rank test comparing the right and left is also reported, with significant differences in bold.
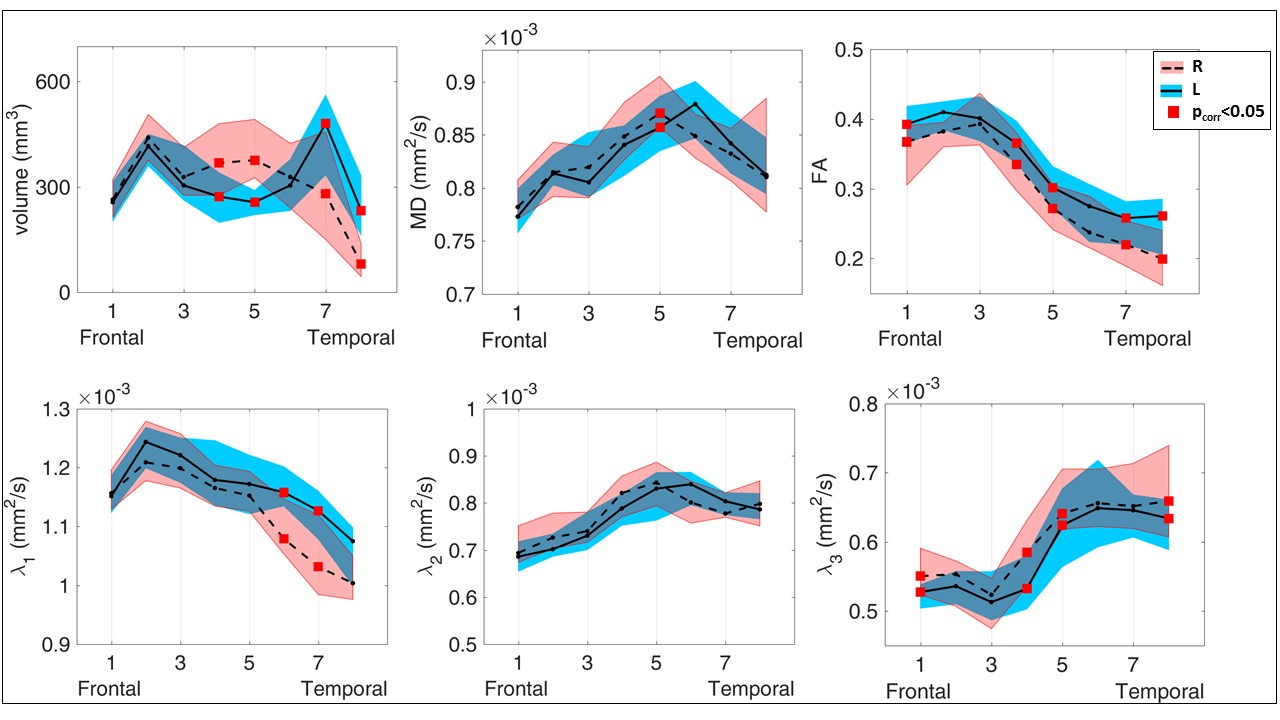
Figure 4
Along-tract comparison between the right (dashed line) and left (continuous line) UF tractography results. Median volume and diffusion parameter values are displayed along with the interquartile range (shaded area). The red squares marked significant left-right differences with p-value<0.05 after FDR correction. We found a greater volume at right compared to left (R>L) in the medial part of the UF core, and the opposite (L>R) in temporal segments. Along the UF an FA ‘L>R’ was measured, corresponding with: an ‘R>L’ MD in one medial segment, an ‘L>R’ λ1 in some temporal segments and an ‘R>L’ λ3 along the UF.
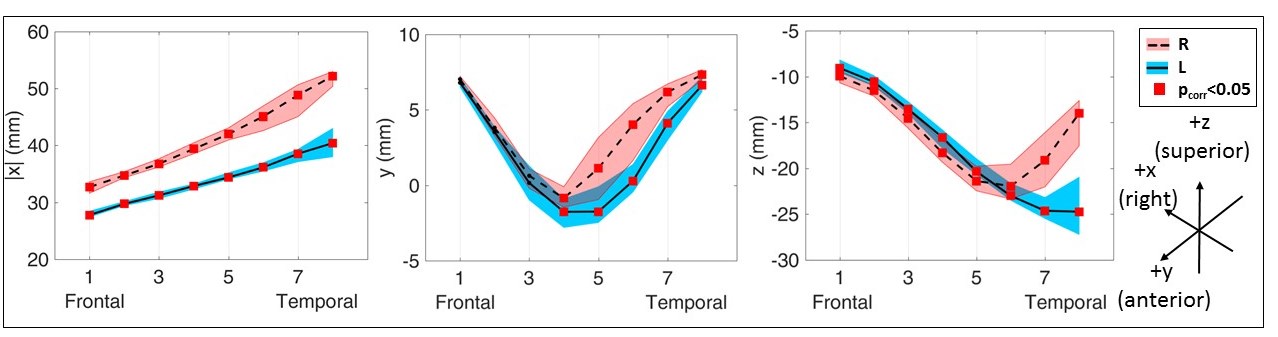
Figure 5
Centroid coordinates of along-tract segments were reported in the MNI-152 standard space. Right (dashed line) and left (continuous line) tractography results were compared. Median coordinate values were displayed along with the interquartile range (shaded area). The red squares marked significant left-right differences with p-value<0.05 corrected with FDR for multiple comparisons. The left UF segments were located more medially with respect to the right (lower |x|); frontal UF segments were more superiorly located (higher z), whereas temporal segments of the left UF were more posteriorly (lower y) and inferiorly (lower z) located with respect to the right.