5197
SNR Optimization of Simultaneous Multi-Slice Accelerated TSE Sequences for Diabetic Foot Imaging1Radiology and Imaging Sciences, Indiana University School of Medicine, Indianapolis, IN, United States, 2Department of Radiology, University of Minnesota, Minneapolis, MN, United States
Synopsis
To optimize Simultaneous Multi-Slice (SMS) accelerated TSE sequences for ultra-fast imaging of patients with diabetic neuropathy, a phantom study was performed to determine the optimal Field of View Shift (FOVS) which is a key parameter for SMS, but depend on other imaging parameters and coil configuration. SNR maps for different FOVS were measured using a subtraction method combined with shifting ROI. The optimal selections of FOVS based on quantitative SNR measurement are in good agreement with the selections derived from visual evaluation of clinical images by radiologists. Such agreement provides additional confidence.
PURPOSE
Diabetes occurs in nearly 10% of the U.S. population and pedal osteomyelitis is a common complication. Many of these patients develop painful feet secondary to diabetic neuropathy which impedes their ability to remain motionless for imaging. Development of a Simultaneous Multi-Slice (SMS) accelerated Turbo Spin Echo (TSE) sequence facilitates ultra-fast imaging of these patients [1]. However, the quality of SMS-TSE images depends on unique SMS parameters like the CAIPIRINIA field of view (FOV) shift [2]. In this work, we performed phantom studies to measure the SNR maps with different FOV shifts in addition to visual comparison in-vivo images to optimize the SMS-TSE sequences in a fast diabetic foot imaging protocol.METHODS
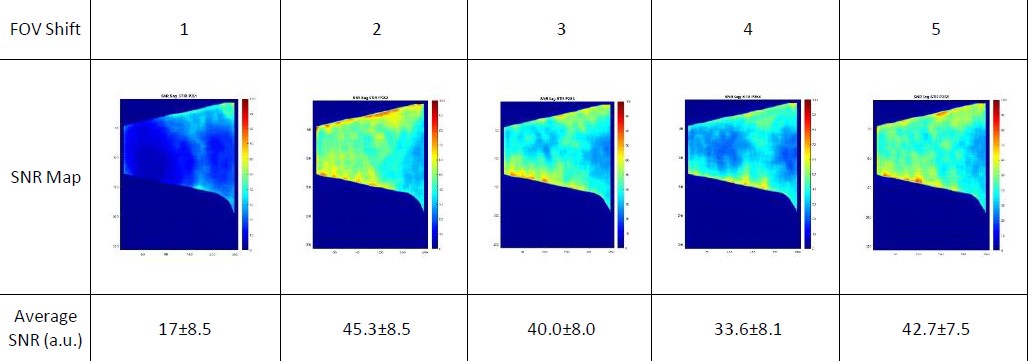
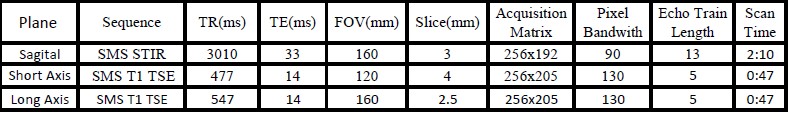
Both clinical and phantom studies were performed on a 1.5T scanner (Siemens Magnetom Aera) using a 16-channel ankle/foot coil. A set of SMS‑accelerated diabetic foot imaging protocols (Table 1) was developed based on a conventional TSE sequence protocol and optimized empirically [1]. To confirm the optimal choice of FOV shift selection and to quantify its impact on image quality, SNR measurements for different FOV shifts were performed. For each FOV shift, an SNR map was generated using the difference method [3]. In this approach, two images - Im1 and Im2 - were acquired with identical scan settings. A sliding 7x7 ROI was used to calculate the local signal in the summed image and the local standard deviation in the difference image as described elsewhere [4]. Additionally, the average SNR for the entire phantom region was calculated for each slice using the derived SNR map.RESULTS
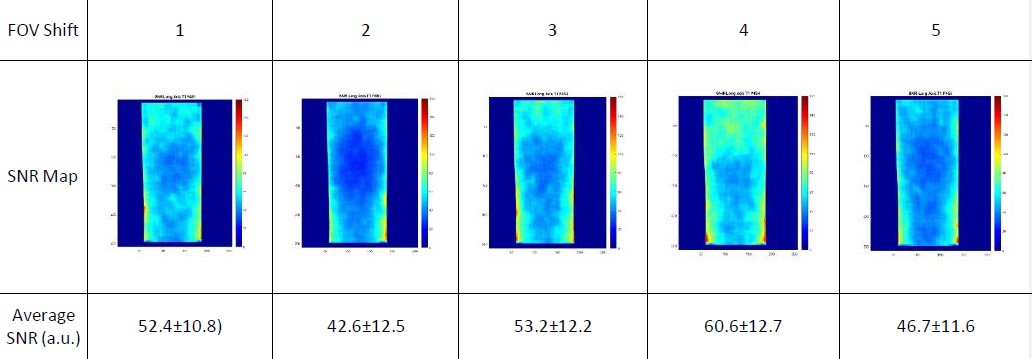
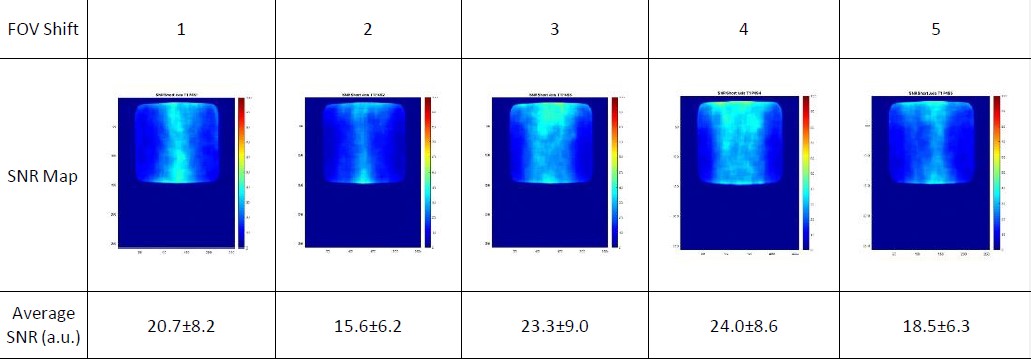
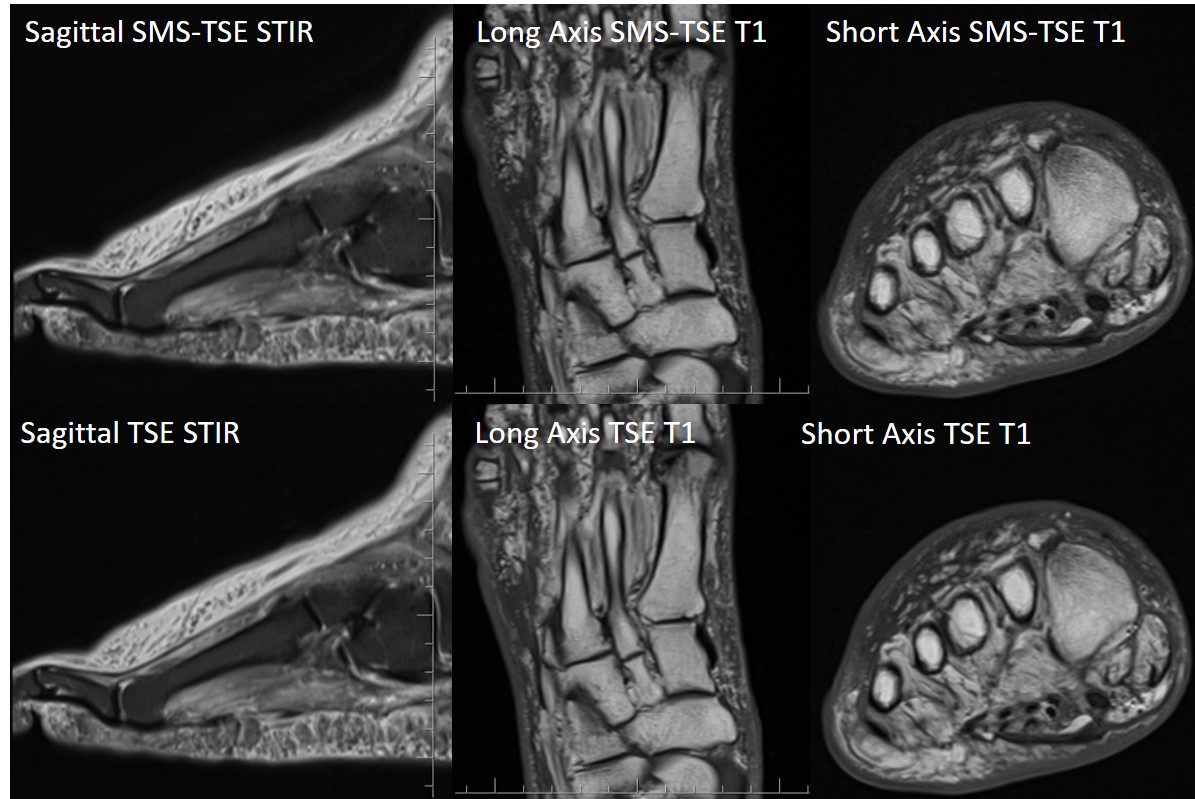
Figures 1 – 3 show the computed SNR maps and the average SNR over the phantom region with different FOV shift factors for different SMS accelerated sequences in the proposed diabetic foot protocol. For the sagittal SMS-TSE STIR sequence, which uses 2 times SMS factor and no in-plane parallel imaging acceleration, an FOV shift of 2 has the highest average SNR. For long axis SMS-TSE T1w sequence, which combines 2 times SMS acceleration with 2 times in-plane parallel imaging acceleration, an FOV shift of 4 shows the best average SNR. For the short axis SMS‑TSE T1w sequence (SMS 2 combined with iPAT2), FOV shifts of 3 and 4 have similar average SNRs. The choice of FOV shift based on volunteer studies (Figure 4) were 2, 1 and 3 for sagittal SMS-TSE STIR, long axis SMS-TSE T1w and short axis SMS-TSE T1w sequences respectively.DISCUSSION
In general, the optimal FOV shift based on measured SNR are in good agreement with radiologists’ preferences based on visual inspection of clinical test images. However, there was a discrepancy for the long axis SMS-TSE T1w sequence. Although an FOV shift of 1 was adopted based on the volunteer study, the phantom-based SNR measurement suggests an FOV shift of 4 to be optimal. However, the impact of the FOV shift on SNR is less dramatic for long axis SMS-TSE T1w images and the difference between FOV shifts of 1 and 4 is relatively small.CONCLUSION
SMS-TSE is a useful technique for ultra-fast pedal imaging of diabetic patients. To maximize scan efficiency, it is important to optimize protocol parameters such as the acceleration factor and FOV shift. This work provides optimum protocol parameters based on quantitative SNR measurements obtained from a phantom.Acknowledgements
No acknowledgement found.References
1) Buckwalter K., Wang D., Lin C., Choplin R., Roth T., “Application of Simultaneous Multi‐Slice (SMS) accelerated TSE to the diabetic foot”, Soc. of Skeletal Radiol., Annual Meeting 46: 415 (2017)
2) Barth M., Breuer F., Koopmans P.J., Norris D.G., Poser B.A., “Simultaneous multislice (SMS) imaging techniques”, Magnetic Resonance in Medicine 75:63–81 (2016)
3) Reeder S.B., Wintersperger B.J., Dietrich O., Lanz T., Greiser A., Reiser M.F., Glazer G.M., Schoenberg S.O., “Practical approaches to the evaluation of signal-to-noise ratio performance with parallel imaging: application with cardiac imaging and a 32-channel cardiac coil”, Magnetic Resonance in Medicine 54:748–754 (2005)
4) Imai H., Miyati T., Ogura A., Doi T., Tsuchihashi T., Machida Y., Kobayashi M., Shimizu K., Kitou Y., “Signal-to-noise ratio measurement in parallel MRI with subtraction mapping and consecutive methods”, Nihon Hoshasen Gijutsu Gakkai Zasshi 64(8):930-936 (2008)
Figures