5196
Comparison of gagCEST Effects in Phantoms and Bovine Musculoskeletal Specimens Using 2D Single-Shot Fast Spin Echo and 3D Ultrashort Time-to-Echo at 3-Tesla1Radiology, UCSD, La Jolla, CA, United States, 2Toshiba Medical Systems, Otawara, Japan, 3Toshiba Medical Research Institute, Vernon Hills, IL, United States, 4VA San Diego Healthcare System, San Diego, CA, United States, 5Toshiba America Medical Systems, Tustin, CA, United States
Synopsis
3D UTE and 2D single-shot fast spin-echo (SSFSE) gagCEST techniques were used to image varying concentrations of chondroitin sulfate (CS) in long or short T1 solutions. Echo time (TE) in SSFSE and UTE ranged from 10-60 ms, and 0.1-8 ms, respectively. Effect of TE on asymmetric magnetization transfer ratio (MTRasym) was examined around 1.0 and 3.5 ppm. For long T1 saline phantom, we found a general increase in MTRasym with concentration, with similar slopes over different TEs, for either technique. For short T1 MnCl2 doped phantom, while UTE could acquire gagCEST signal unlike SSFSE, no consistent trends were found.
Introduction:
Glycosaminoglycans (GAG) are found in many musculoskeletal (MSK) tissues. For example, articular cartilage [1] and nucleus pulposus of intervertebral discs [2] contain 2-5% GAG by weight, decreased with degeneration [1]. MR technique such as dGEMRIC [3] can directly assess GAG content, however it requires undesirable exogenous agent. Chemical exchange-dependent saturation transfer in GAG (gagCEST) has been proposed as another promising technique for MSK tissues, [4, 5] but not in short T2 tissues, and the effect of acquisition parameters are unclear. Additionally, gagCEST effects in ultrashort echo time (UTE) regime has not been studied. We sought to validate gagCEST techniques based on 2D single-shot fast spin-echo (SSFSE) and 3D ultrashort echo time (UTE) acquisitions using GAG phantoms and bovine tissues. Effects of pulse sequence (2D SSFSE, 3D UTE), TE, and frequency of gagCEST measurements were evaluated.Methods:
This is a feasibility study to validate gagCEST measurement on GAG phantoms, without a full statistical treatment, reserved for future work. Samples: We prepared GAG phantoms of CS in varying concentrations (22, 43, 86, and 150 mM CS in saline with normal T1, or in 10 mM MnCl2 in saline with short T1 values). We also acquired a piece of adult bovine coccygeal intervertebral disc (long T2) and a knee meniscus (short T2). MRI: For gagCEST, the preparation pulses for 2D SSFSE were: twelve 80-ms sinc pulses with flip angle=1200°; B1rms=~2 μT; and frequency offset: 33 steps between +2000 to -2000 Hz with various increments (-2000:400:-800, -600:50:600, 800:400:2000) and for 3D UTE: two 80-ms sinc pulses per 80 segments with flip angle=1200°; B1rms=~2μT; and frequency offset: 19 steps between +2000 to -2000 Hz with various increments (-2000:400:-400, -200:50:200,400:400: 2000). For 2D SSFSE, TE of 10, 20, 30, and 60 ms were used. For 3D UTE, TE of 0.1, 3, and 8 ms were used. Analysis: Maps of MTRasym were created by pixel- or voxel-wise B0 correction, followed by integration of Z-spectrum area at 1 ppm (0.75 to 1.25 ppm, representing -OH peak) or 3.5 ppm (3.25 to 3.75 ppm, -NH peak) to determine the average MTRasym values.Results:
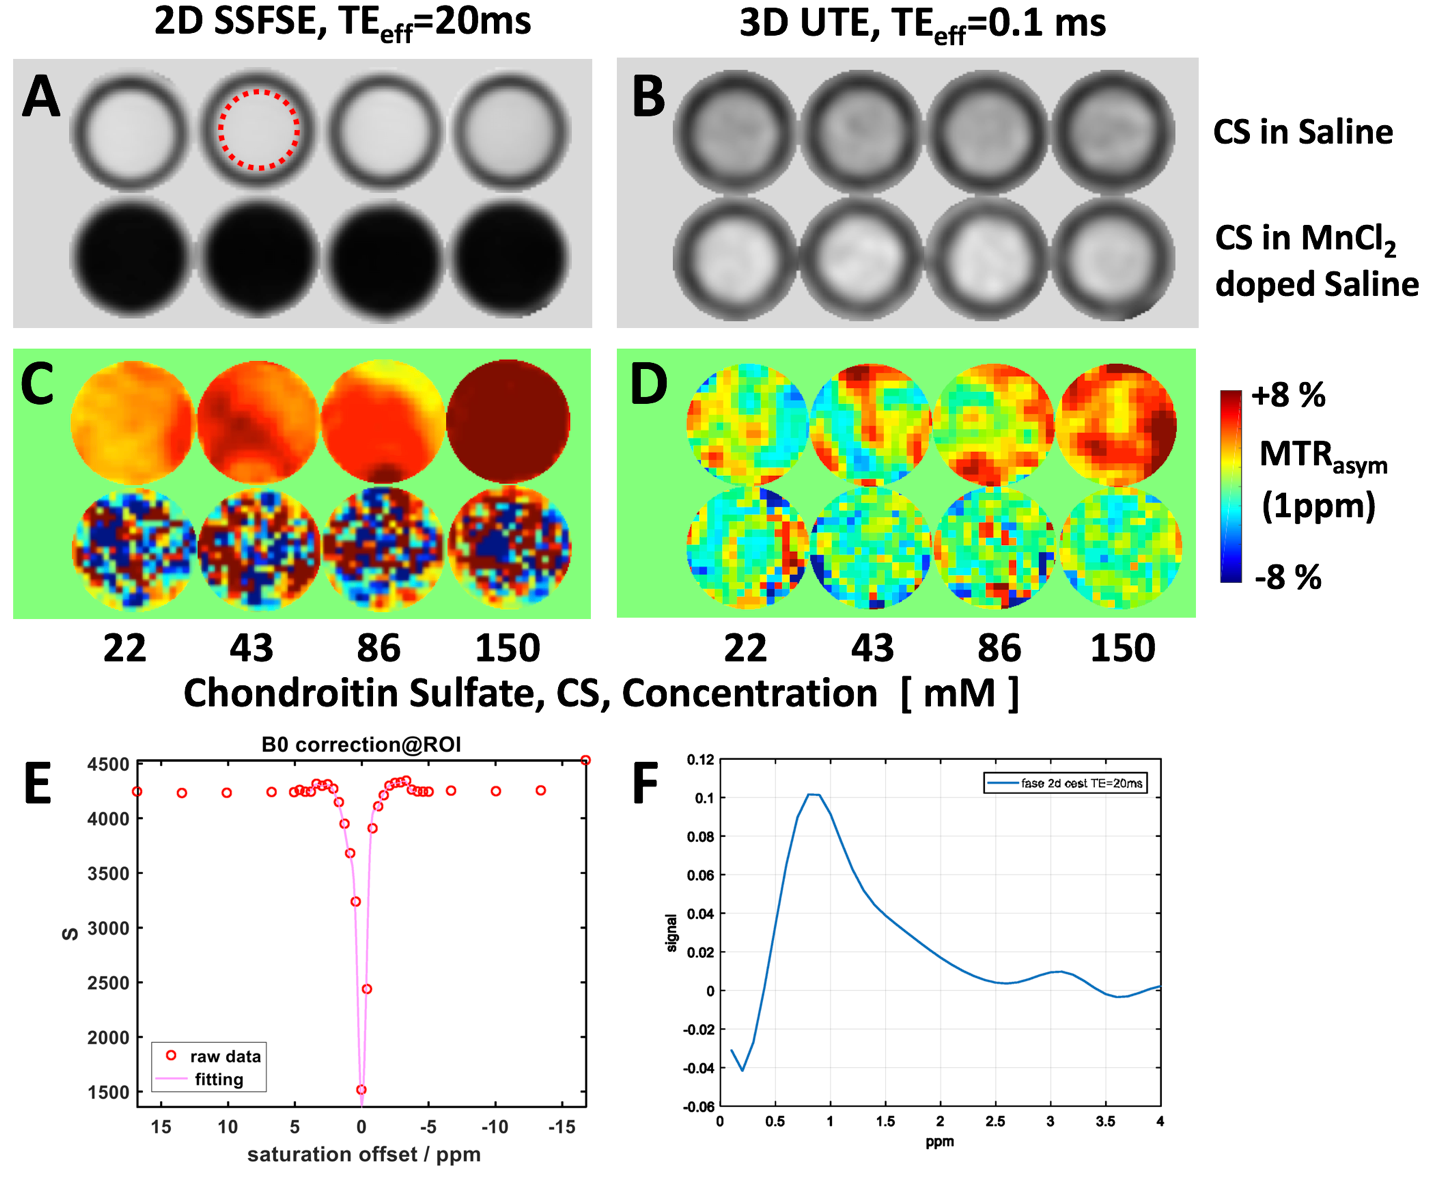
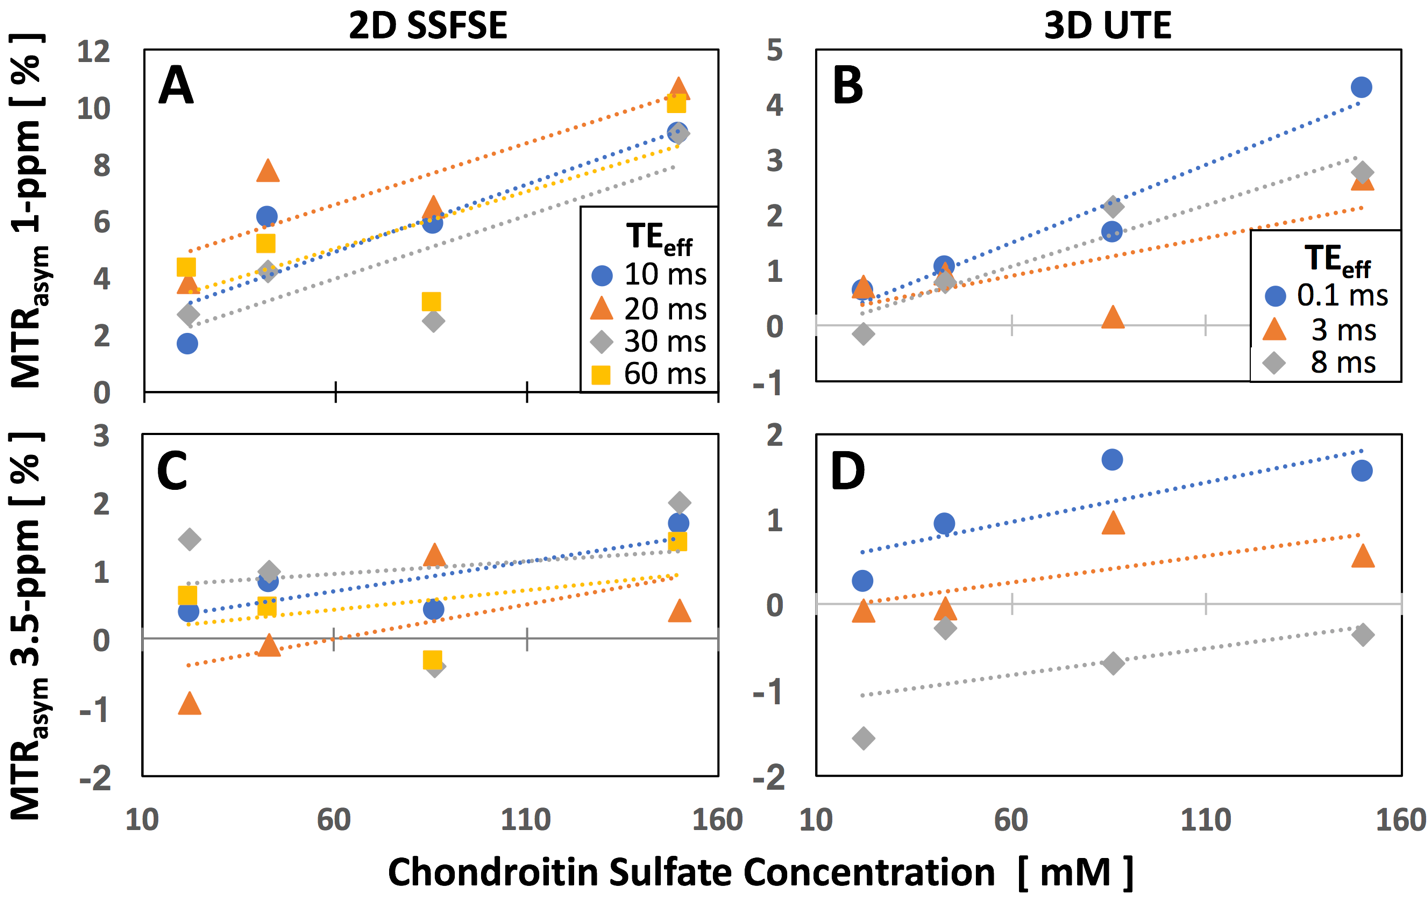
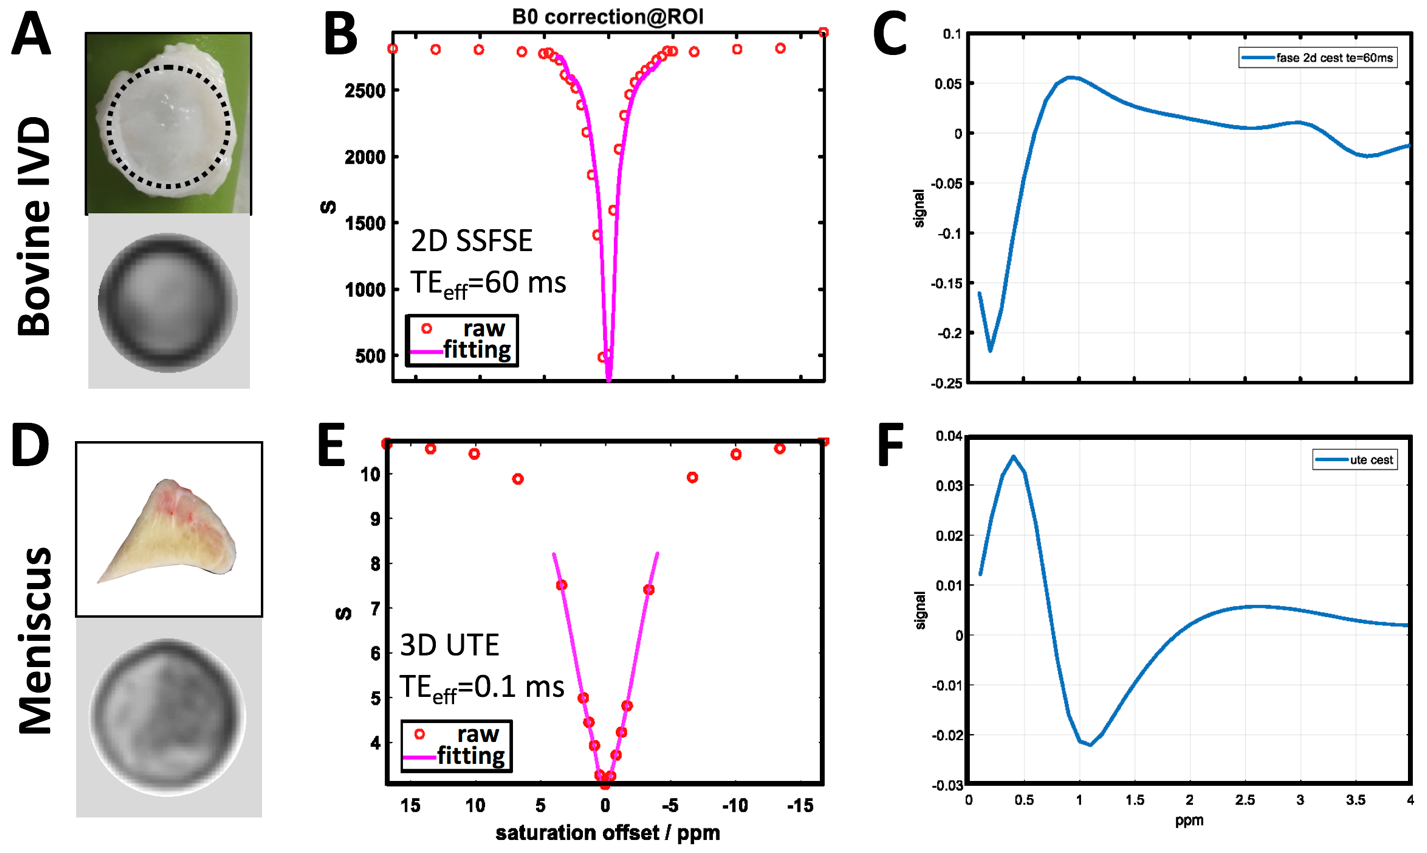
In source images of GAG phantoms obtained with 2D SSFSE (Figure 1A), normal T1 saline phantoms (top row) exhibited high signal intensity but no signal was obtained from the short T1 phantoms in MnCl2-doped saline (bottom row). Using 3D UTE (Figure 1B), signal from both types of phantoms were high. There was no visible difference between different CS concentrations in source images. MTRasym maps, from SSFSE (Figure 1C) and UTE (Figure 1D) at 1 ppm clearly showed increasing values with concentration in long T2 phantoms, but no clear trend was seen in short T1 phantoms. Z-spectrum of a normal T1 sample (43 mM, 2D SSFSE) (Figure 1E) shows a sharp peak near 0 ppm, and MTRasym sweep (Figure 1F) shows high sensitivity near 1 ppm and a lower sensitivity near 3.5ppm. Figure 2 shows averaged MTRasym vs. CS concentration for normal T1 phantoms. Here, we found a general increase in MTRasym with concentration, with similar slopes over different TEs, for either technique. 2D SSFSE (Figure 2A) showed greater slopes than 3D UTE (Figure 2B) technique at 1 ppm. For short T1 phantom, while UTE was able to acquire gagCEST signal unlike SSFSE, no consistent trends were found. (Data not shown.) Using SSFSE gagCEST, we imaged a bovine disc (Figure 3A), which yielded sharp Z-spectrum (Figure 3B) and MTRasym values across frequency (Figure 3C) similar to that of the phantoms. Using UTE gagCEST, we imaged a bovine meniscus (Figure 3D), which yielded a somewhat broad Z-spectrum (Figure 3E).Discussion:
This study validated 2D SSFSE and 3D UTE gag CEST techniques using GAG phantoms, and showed feasibility of evaluating MSK tissues. In short T1 phantoms, it is possible that short T1 of MnCl2 (in addition to T2) environment disrupted magnetization transfer. We will investigate other T1 and T2 shortening mechanisms, and varying MT exchange times, in future studies. Broad Z-spectrum of meniscus specimen may be due not only to GAG protons (-OH and -NH), but water molecules surrounding meniscus specimen are also under chemical exchange. In normal T1 phantoms, we found that TEeff did not make a significant difference in sensitivity (i.e., slope). However, this should be further investigated in additional samples of varying T1 values.Conclusion:
2D SSFSE and 3D UTE gag CEST techniques both are sensitive to CS concentration at 1 ppm in saline phantoms. 3D UTE has potential for short T2 GAG assessment, but additional studies are needed on various chemical exchange times.Acknowledgements
This work was supported by a grant from the Toshiba Medical Systems (16-01762).References
1] Temple-Wong MM, et al. Osteoarthritis Cartilage 17:1469, 2009; 2] Perie DS, et al. Ann Biomed Eng 34:769, 2006; 3] Burstein D, et al. Magn Reson Med 45:36, 2001; 4] Schleich C, et al. J Magn Reson Imaging 42:1057, 2015; 5] Muller-Lutz A, et al. Skeletal Radiol 44:505, 2015.
Figures