5193
Effects of Reduced Dead Times on the SNR of Tissue with Short T2* values1Dept. of Radiology, Medical Physics, Medical Center University of Freiburg, Faculty of Medicine, University of Freiburg, Freiburg, Germany
Synopsis
MRI of tissues with short T2* can be realized with ultra-short echo time (UTE) sequences. The effect of lowering TE on relative SNR is calculated and evaluated. The limiting factor for dead time and, consequently, low TE is determined for hardware components of clinical MR system and compared to benchmark results.
Introduction
Conventional MR imaging only allows for the visualization of about 70% of tissue with hydrogen content. Imaging of the remaining tissues, such as tendons and cortical bones, is challenging because of short T2* relaxation times. In these tissues, the MR signal decays rapidly during the dead time between excitation and signal reception. Special acquisition strategies such as ultrashort echo time (UTE) sequences minimize this dead time and allow to sample short-T2* signals at higher signal intensities1. However, hardware-related dead time of the MR system limits the lowest achievable TE to a range of 50-250µs for conventional clinical MR systems2. The goal of this experiment is to estimate the effect of different TEs on relative SNR values for ultrashort T2* tissue and compare them to a measurement. Furthermore, the limiting factor and value for dead time on the MR system is determined which limits TE. Strategies for dead-time minimization are then used to image ancient mummies with ultra-short T2*.Materials and Methods
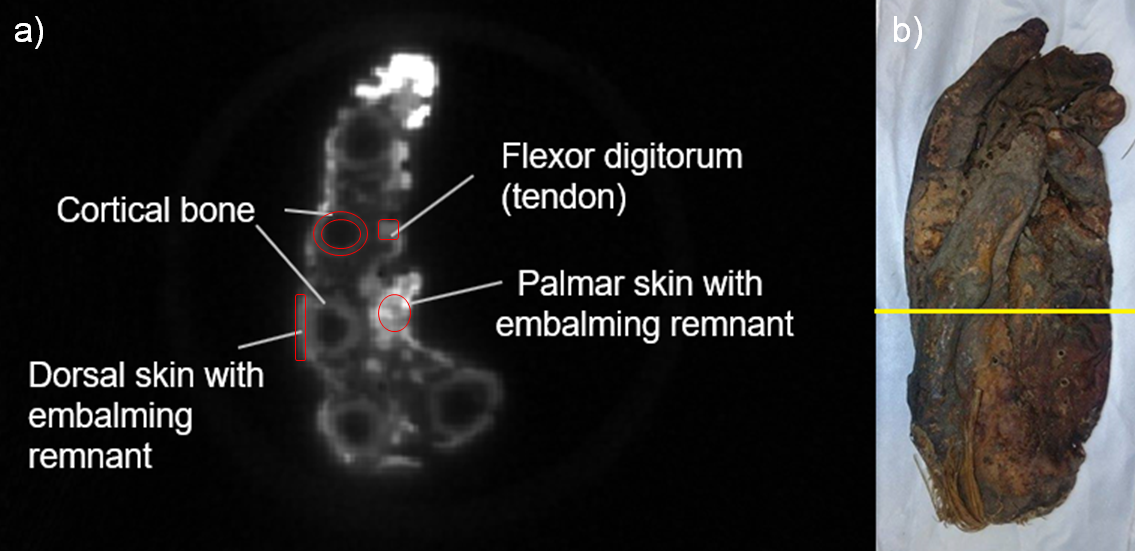
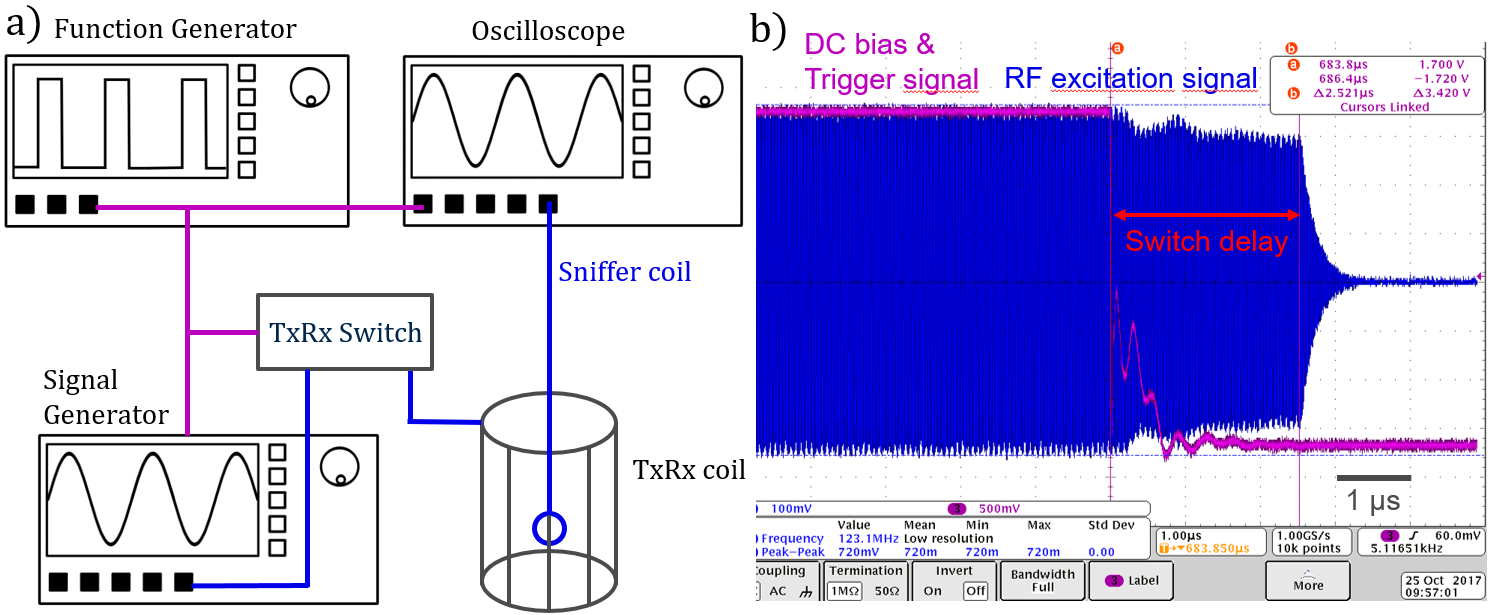
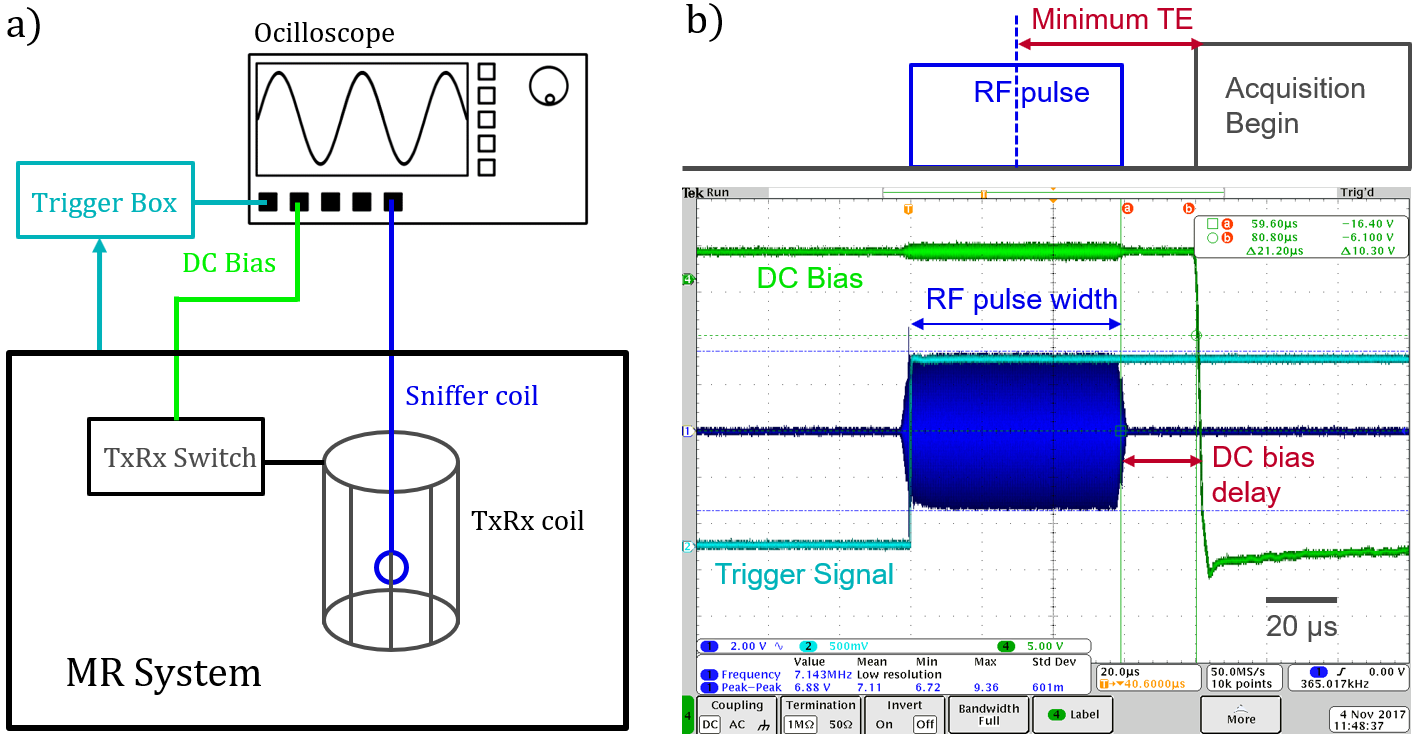
Measurements were performed on a 3T clinical MR system (PRISMA, Siemens Healthcare, Erlangen, Germany) using a mummified ancient hand sample (Figure 1) with a T2* between 100 and 600 µs3. It was measured with a 3D UTE sequence with following acquisition parameters: TE=70µs, TR=3ms, FA=16°, 80000 evenly spaced radial projections with 128 points per spoke. The measurement hardware consisted of a custom-built quadrature TxRx birdcage coil. The coil components were characterized on the workbench in terms of transient behavior (Figure 2). In particular, coil ring down and TxRx switching time were measured. To compare the measured properties to actual performance, the measurement setup was transferred to the MR system (Figure 3). An optical signal was used to trigger the oscilloscope at the start of the RF excitation pulse, which was measured with a sniffer coil. To characterize ON/OFF switching time and transient behavior of the TxRx switch, DC bias was also monitored to determine hardware dead time between RF pulse and signal acquisition. Minimum available TE can be obtained from measuring duration between the center of RF pulse and begin of acquisition. To determine effects of relative SNR of short T2* tissue for different TEs, the relative SNR values were estimated with a simplified SNR equation4
$$SNR\approx \gamma B_0 \cdot \frac{B_1}{I}\cdot\frac{{ }V_{0} \cdot M_{T}}{\sqrt{4k_{B}T(R_{coil}+R_{sample})\Delta f}}\cdot\sqrt{t_{0}/t_{R}}\cdot\sqrt{t_{scan}}.$$
The essential parameters are coil sensitivity $$$\frac{B_1}{I}$$$, induced losses by coil resistance $$$R_{coil}$$$ and especially transverse magnetization $$$M_{T}$$$ , where signal decay due to T2* is considered during RF excitation5. Due to inherently low conductivity of mummified tissue, the sample losses $$$R_{sample}$$$ can be neglected.
Results and Discussion
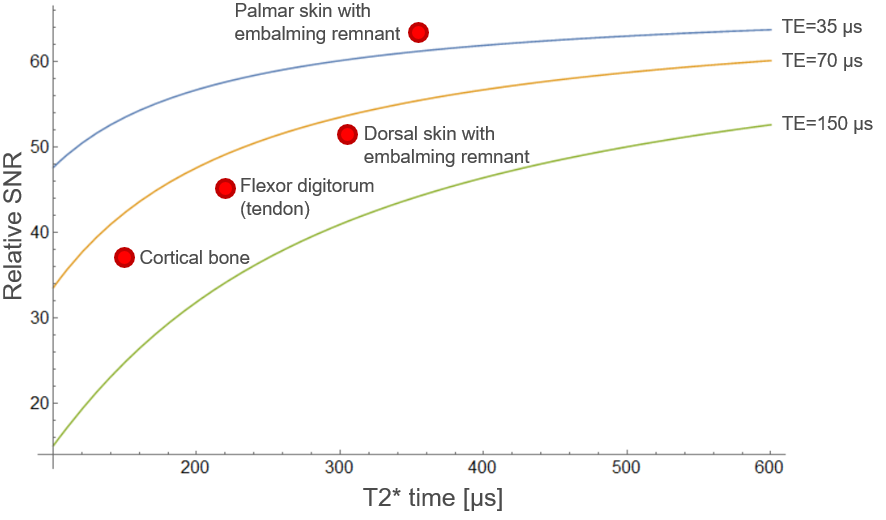
The acquired MR image of the mummy hand (Figure 1) allows for discrimination of tissue such as cortical bones (T2*=150µs), tendons (T2*=220µs) and skin with embalming remnants (T2*=300-370µs). These calculated relative SNR values are plotted in Figure 4 for three different TEs (35, 70 and 150µs) and compared to measured mummified tissue at TE=70µs. The overall trend of the curve fits to SNR values in the regions of interest of selected tissue components (Figure 4). The slightly lower SNR might be attributed to neglected losses in either $$$R_{coil}$$$ or in other hardware components. Overall, the plot shows higher SNR gain for T2* values close to selected TE and remains on a slightly higher SNR value for increasing T2*. Total dead time for switching and coil ring down was within microsecond range (2.5 -3µs) which is far below the applied TE values. However, applying the same setup at the actual MR system (Figure 3a) shows an additional DC bias delay that prolongs the ON state of the switch to 20 µs (Figure 3b). To compare workbench and MR system results, the output voltages of workbench experiments need to be scaled up to the MR system’s level which requires a higher excitation voltage of $$$V_0=15V$$$ and results in a coil ring down time of6
$$t_{rd} = \frac{2\cdot Q}{\omega_0}\cdot \ln (\frac{V_0}{V_{noise}}).$$
Here a value of $$$t_{rd}=3.8µs$$$ was determined. This increases dead time of the workbench measurement to around 6µs, which is much lower than the 20µs delay of the actual system. Even lowering TE and duration of RF pulse did not affect this delay, which seems to be an intrinsic hardware or software delay.
Conclusion
Relative SNR of short T2* samples such as mumified tissue with very low conductivity values can be estimated by considering coil sensitivity and resistive losses for known T2* values. Further, reducing dead time allows for shorter TE in the range of 25-40µs, which is limited by the intrinsic DC bias delay of the MR system and duration of RF pulse.Acknowledgements
Grant support from the Deutsche Forschungsgemeinschaft (DFG) under grant numbers BO 3025/8-1 and UL 1187/6-1 is gratefully acknowledged.References
1. Gatehouse P et al. Magnetic resonance imaging of short T 2 components in tissue. Clinical radiology.2003;58(1):1-19. 2. Robson Met al. Clinical ultrashort echo time imaging of bone and other connective tissues. NMR in Biomedicine.2006;19(7):765-780. 3. Özen AC et al. Comparison of ultrashort echo time sequences for MRI of an ancient mummified human hand. Magnetic resonance in medicine.(2016);75(2):701-708. 4. Darrasse, L et al. Perspectives with cryogenic RF probes in biomedical MRI. Biochimie.2003;85(9):915-937. 5. Springer F et al. Effects of in-pulse transverse relaxation in 3D ultrashort echo time sequences: analytical derivation, comparison to numerical simulation and experimental application at 3T. Journal of Magnetic Resonance.2010;206(1):88-96. 6. Andrew E et al. NMR probe with short recovery time. Journal of Magnetic Resonance. 1987;73(2):268-276.Figures