5191
High resolution 1 mm isotropic semi continuous wave gagCEST of articular cartilage using parallel transmit at 7T1Radiology, University Medical Center Utrecht, Utrecht, Netherlands, 2Philips Healthcare, Best, Netherlands
Synopsis
The purpose of this work was to implement gagCEST imaging in articular cartilage at 7T using a parallel transmit setup. Two alternating sets of four transmit channels were used in quadrature mode to create a semi continuous excitation pulse. Using this setup, an isotropic 1 mm spatial resolution could be achieved with a low coefficient of variation of 1.05% (@0.9ppm) within an acquisition time of 5 minutes. To the best of our knowledge, this is the highest gagCEST resolution shown so far in literature.
Introduction
Early diagnosis of diseases such as osteoarthritis is essential for proper treatment and prognosis, since articular cartilage has a limited ability to regenerate itself. Cartilage damage manifests itself in changes in the biochemical composition, such as loss of glycosaminoglycans (GAG) on the surface of the cartilage. These small changes in composition can be visualized with Chemical Exchange Saturation Transfer (CEST), which can directly quantify the GAG content based on the chemical exchange of the labile hydroxyl side-groups of GAG with the bulk water pool [1–3].
In this work, a parallel transmit (pTx) 7T setup has been implemented, where the eight channels were divided into two subsets (odd and even channel quadrature subsets) [4, 5]. With this setup, we can overcome RF duty cycle limitations and avoid RF signal droop (i.e. decline over time of the pulse amplitude). With this setup we were able to acquire 1 mm isotropic resolution images of knee cartilage.
Methods
Experiments were carried out on a 7T whole body scanner (Achieva; Philips Healthcare, Best, Netherlands) with an 8 channel transceive coil using 8x2 kW amplifiers at 300 mHz. Three healthy volunteers were included for cartilage imaging, after informed consent was obtained. The gagCEST sequence had a pre-pulse of 40 block pulses of 50 ms (average B1 = 1.2 µT) using two sets of four transmit channels in quadrature mode to create a semi continuous excitation pulse [4, 5]. Readout parameters were as follows: 3D single shot TFE (TFE factor = 657, TFE shot duration = 4815 ms, shot interval = 8000 ms), SENSE (AP) 3, TE = 1.48 ms, FA = 7, FOV = 140x140x20 mm3, resolution = 1x1x1mm3, 5 dummy scans, acquisition time of 5 minutes and 5 seconds.
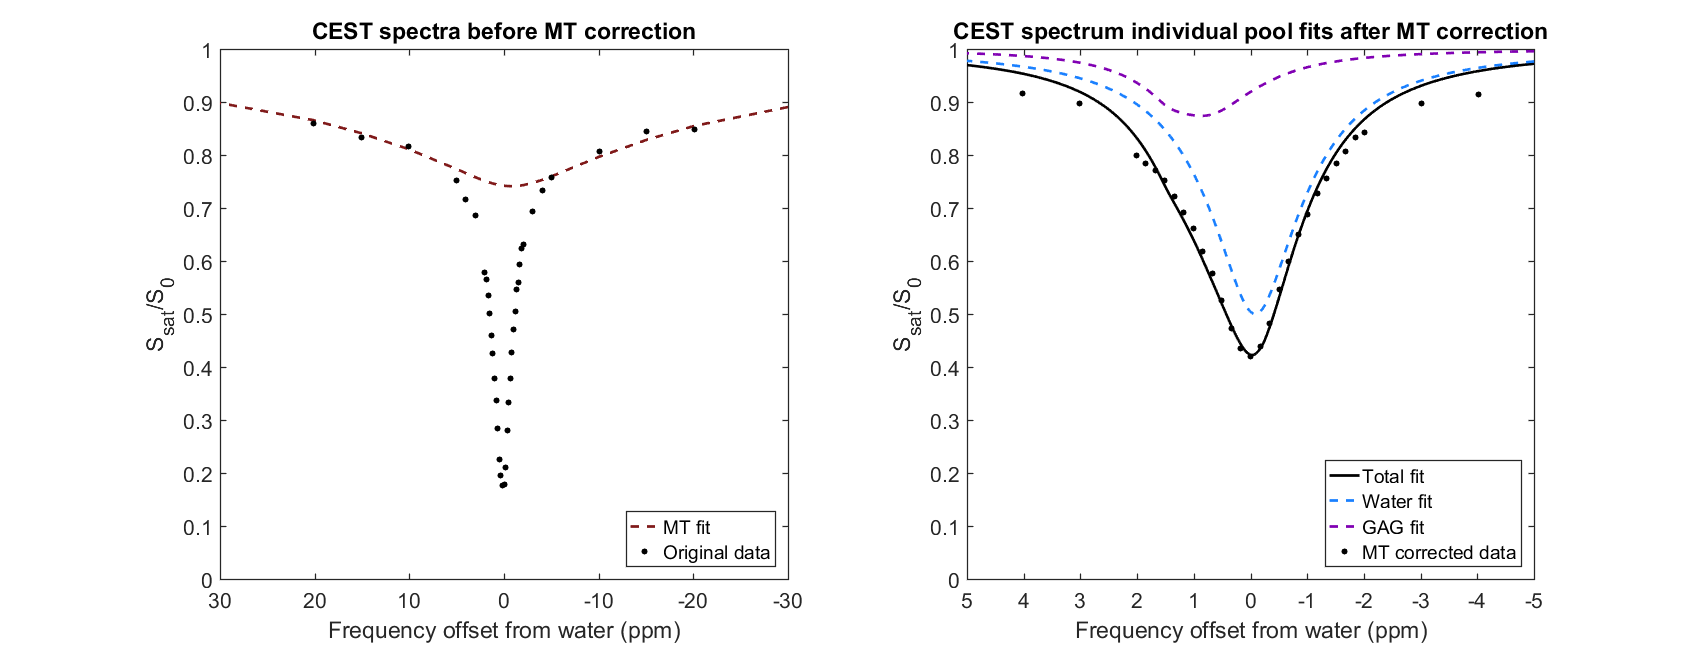
The gagCEST images were acquired at 46 offsets from -335 ppm to 335 ppm, with two offsets at ± 671 ppm for normalization. Analysis of the gagCEST data was done using Lorentzian fitting. First, datapoints between -0.7 ppm and 0.7 ppm were used to fit the water peak. The minimum of this peak and the corresponding frequency offset were used for B0 correction. Secondly, datapoints at offsets < -10 ppm and offsets > 10 ppm were used for a fit of the MT pool. Finally, after subtraction of the MT fit from the B0 corrected and normalized data a two-pool fit was carried out to fit the water and GAG pools. The gagCEST effect was quantified as the amplitude of the GAG fit.
Signal to noise ratio (SNR) was calculated making use of a noise scan [6]. Stability of the signal is calculated with the coefficient of variation (CV, standard deviation divided by the mean). For the assessment of SNR and stability the offset at 0.9 ppm was used. Sixteen measurements were acquired to determine the CV. Contrast to noise ratio (CNR) was defined as the signal, in this case the amplitude of the GAG fit, normalized by the far off-resonant offset divided by the variation.
Results
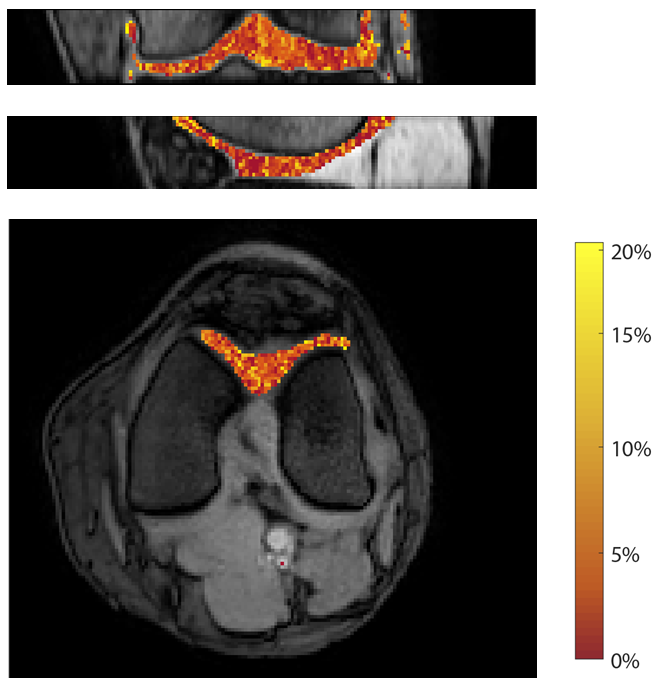
The SNR was 12.5 in the articular cartilage in the gagCEST experiments, the CV was 1.05% in the same ROI and CNR in the same ROI was 10.3. Figure 1 shows a typical example with Lorentzian fits of the gagCEST data. The amplitude of the GAG fit was 10.8% in this region of interest. gagCEST maps are shown in figure 2 in three orthogonal directions.Discussion
The average signal was measured to be ten times higher than the average variation. Using a pTx setup instead of a classical quadrature setup leads to a possible sensitivity enhancement, because approximating 100% duty cycle could improve the saturation pulse while at the same time reducing RF signal droop.
GAG molecules also contain amide groups, which have a CEST effect around 3.5 ppm. We observe that the two-pool fit is not perfect at ± 3.5 ppm, which could be explained by a CEST effect related to the amide groups. These amide groups have been shown with in vitro work, which also showed that NOE effects occur downfield of the water peak at -2.6 ppm [1]. In this study, we did not sample these points dense enough to be able to assess these effects in more detail. In our follow-up study, we will include these effects (amide and NOE) into our model for more quantitative GAG imaging.
Conclusion
A semi continuous wave gagCEST protocol was applied at 7T with a pTx setup to overcome duty cycle limitations and RF signal droop effects. Using this setup, we achieved an isotropic voxelsize of 1x1x1mm3 with an acquisition time of 5 minutes. To the best of our knowledge, this is the highest gagCEST resolution shown so far in literature.Acknowledgements
No acknowledgement found.References
1. Ling W, Regatte RR, Navon G, Jerschow A (2008) Assessment of glycosaminoglycan concentration in vivo by chemical exchange-dependent saturation transfer (gagCEST). Proc Natl Acad Sci U S A 105:2266–2270. doi: 10.1073/pnas.0707666105
2. Schmitt B, Zbýn S, Stelzeneder D, et al (2011) Cartilage Quality Assessment by Using Glycosaminoglycan Chemical Exchange Saturation Transfer and 23 Na MR Imaging at 7 T 1. Radiology 260:257–264. doi: 10.1148/radiol.11101841/-/DC1
3. Krusche-Mandl I, Schmitt B, Zak L, et al (2012) Long-term results 8 years after autologous osteochondral transplantation: 7 T gagCEST and sodium magnetic resonance imaging with morphological and clinical correlation. Osteoarthr Cartil 20:357–363. doi: 10.1016/j.joca.2012.01.020
4. Hoogduin H, Khlebnikov V, Keupp J, et al (2017) Semi continuous wave CEST with alternating sets of 4 transmit channels at 7T. MAGMA 30:S1–S152.
5. Keupp J, Baltes C, Harvey PR, Brink J van den (2011) Parallel RF Transmission based MRI Technique for Highly Sensitive Detection of Amide Proton Transfer in the Human Brain at 3T. Proc Intl Soc Mag Reson Med 19:710.
6. Dietrich O, Raya JG, Reeder SB, et al (2007) Measurement of signal-to-noise ratios in MR images: Influence of multichannel coils, parallel imaging, and reconstruction filters. J Magn Reson Imaging 26:375–385. doi: 10.1002/jmri.20969
Figures