5187
Influence of fat saturation on 3D -UTE Cones T2* mapping of tendon tissue1Department of radiology and nuclear medicine, Erasmus MC, Rotterdam, Netherlands, 2Department of medical informatics, Erasmus MC, Rotterdam, Netherlands
Synopsis
T2* mapping of tendon tissue is important to assess tissue pathology. Fat contamination however may lead to bias in quantification of T2*. The application of fat saturation (FS) to reduce signal contamination is not straight forward, as this may influence the signal of species with short T2* and broader line-widths. Therefore, the influence of FS on T2* was investigated in tendon tissue. No influence of FS on T2* was observed in ex-vivo tendon tissue. However, in-vivo results suggest fat-contamination was present and FS may be beneficial to reduce T2* quantification bias.
Introduction
Tissues with very short transverse relaxation times such as tendons often provide insufficient signal for clinical evaluation with conventional MR imaging techniques. In these cases, Ultrashort-Echo-Time imaging (UTE), and T2*-mapping may help quantifying tissue pathology. However, signal oscillations have been observed in T2* decay curves1, possibly originating from fat contamination. While fat saturation (FS) may reduce the contamination, it may adversely affect the measured signal; either by attenuating or distorting short T2* components with broader line width2, or via magnetization transfer effects3. This study investigates the influence of FS on T2* measurements of tendons with simulations, phantoms, ex-vivo porcine tissue, and in-vivo human patellar tendons.Methods
Phantom and Bloch simulations:
To investigate whether FS attenuates species with shorter T2* more than longer T2*, phantoms experiments were performed. Three spheres (D=20mm, figure 1a) were created with MnCl2 doped water: [T1,T2*,T2] = [409.6,24.2,24.2]ms, [22.0,1.3,1.3]ms, and [6.6,0.39,0.39]ms. T2* values were measured without FS, confirming T2≈T2*. To evaluate FS, an additional sphere was filled with oil. Measurements were performed at 3T(Discovery-MR750,GE-Healthcare) with an 8-channel head receive-coil. Coronal 3D-UTE-Cones scans were acquired without FS, and with FS bandwidths (BWs) between 318 and 848Hz; TR/FA= 23ms/9°, TE= 0.032ms, 1 excitation/FS, readout BW=±125kHz. To validate the phantom experiments Bloch simulations using the known relaxation values and equal acquisition parameters were performed. The simulation used the actual duration (6-16ms) and shape of the applied FS pulse to account for signal relaxation during the pulse. Additionally, Bloch simulations were performed with relaxation properties more similar to tendons4.
Ex-vivo experiment:
The effect on T2* of different FS configurations was evaluated with ex-vivo porcine tendons at 3T. A 16-channel flex receive-coil was wrapped around the tissue. Four 3D-Cones-UTE multi-echo acquisitions (figure 1b) were acquired oblique-axially with interleaved echo times: TEME1=[0.032,4.87,12.67,20.47]ms, TEME2=[0.49,6.82,14.62,22.42]ms, TEME3=[ 0.97,8.77,16.57, 24.37]ms, and TEME4=[2.92,10.72,18.52,26.32]ms. Other parameters: FOV=15cm, Matrix=252x252, Slice thickness=1.5mm, 60slices, FA=17°, readout BW=±125kHz, and interspoke duration= 32.6ms. These four multi-echo acquisitions were acquired with the following configurations: (I) FS BWs= 318 Hz, 2 excitations/FS, (II) FS BWs= 318 Hz, 5 excitations/FS, (III) FS BWs= 635 Hz, 2 excitations/FS, (IV) FS BWs= 635 Hz, 5 excitations/FS and (V) no FS. T2* values were obtained from mono- and bi-component fitting of the data with a maximum likelihood method accounting for the Rician noise.
In-vivo measurements:
To investigate the influence of FS on the T2* measurements of the patellar tendon, UTE-acquisitions (figure 1c) were acquired in three volunteers with and without FS using ex-vivo Protocol (I). The volunteers were lying in supine position feet-first. The angle between the long axis of the patellar tendon and the main magnetic field was about 30°. Bi-exponential fitting was performed to quantify T2* in mid and proximal regions of the tendon.
Results
Phantom and Bloch simulations:
Figure 2a-b shows the FS measurements and simulations relative to the non-FS measurement and simulations versus BWs for the different spheres. Differences in signal attenuation occurred for the spheres and the Bloch simulation showed close resemblance to the experiment. Figure 2c shows the relative signal for relaxation times resembling tendons. Strong dependence on T1 and T2 was observed.
Ex-vivo experiment:
Figure 3 shows the ex-vivo results. No influence of FS on the T2* values, or percentage short-T2* component was observed. The T2* values and percentage short component of the non-FS scan were similar to the different FS configurations, see table 1. FS did however result in a decrease in SNR.
In-vivo measurements:
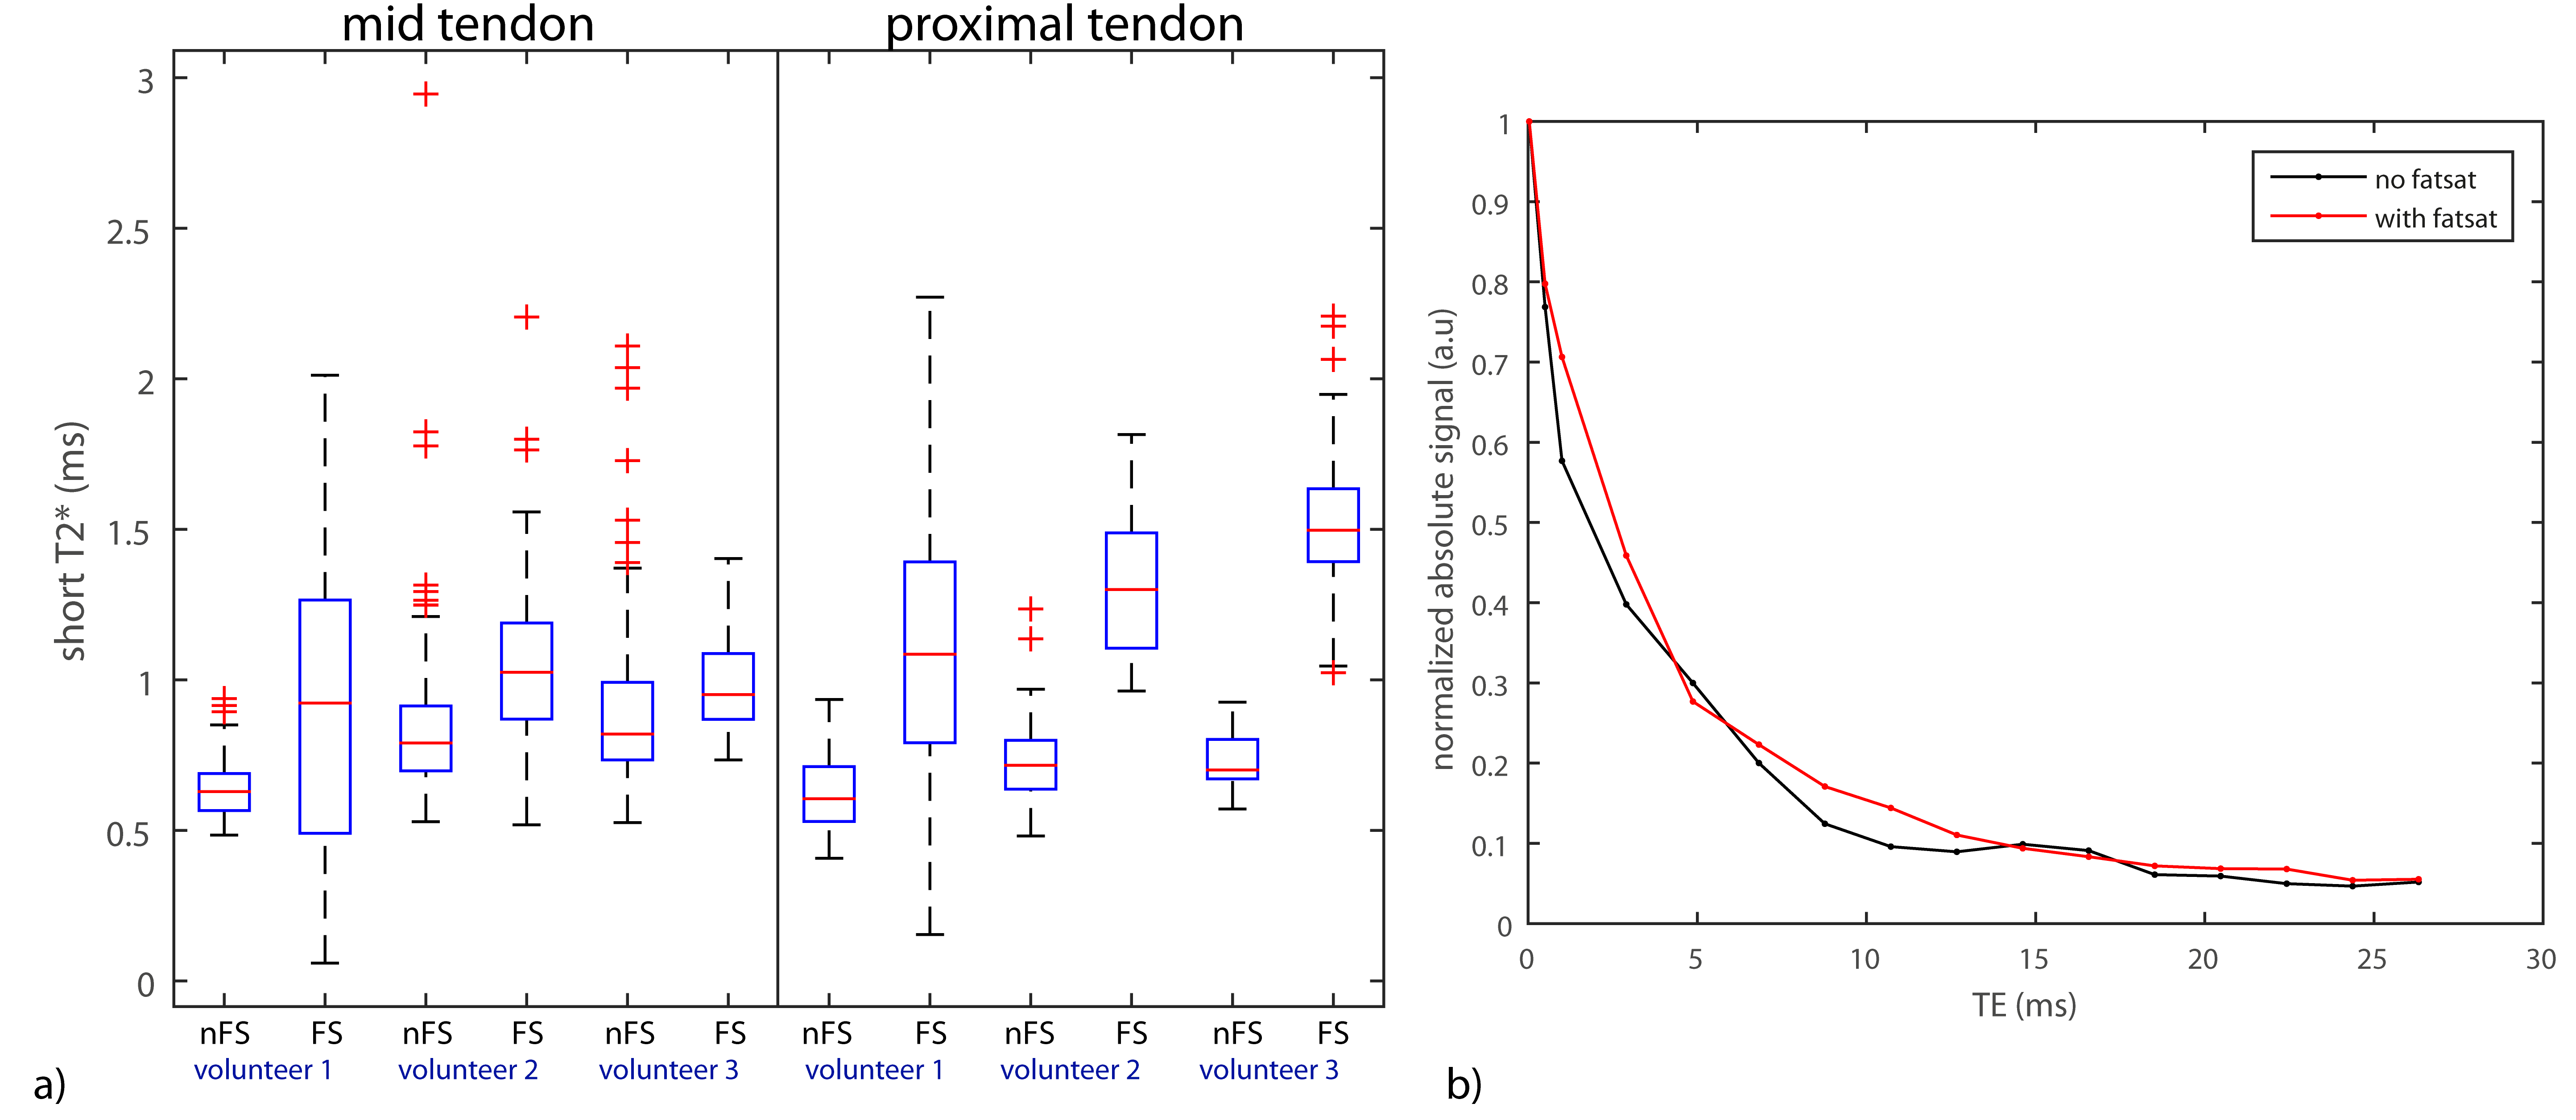
Figure 4a shows the in-vivo influence of FS on the short-T2*. For all volunteers and regions in the tendon, FS resulted in a higher short-T2*. The largest influence of FS was in the proximal region. Fig 4b shows an example T2* decay curve of a voxel with and without FS. The observed signal oscillation is reduced with FS and thus likely is due to fat contamination. FS increased the long-T2* and percentage short-T2* by about 5% mid tendon up to 50% proximally.
Discussion
The phantom and Bloch simulations showed that species with different relaxation rates (T1,T2,T2*) may expect different degrees of signal attenuation from FS. This effect however, was not observed ex-vivo, where no effect of FS on T2* was observed. A disadvantage of using FS was the decrease in SNR by up to 30%. However, in-vivo, where fat contamination was clearly observed, FS did influence T2*. Here, fat saturation may be beneficial to reduce quantification bias.Conclusion
In tendon tissue, no direct influence of FS on T2* from aqueous species was observed. However, with a small SNR penalty, FS may be useful in-vivo to reduce effects from fat contamination.Acknowledgements
No acknowledgement found.References
- Diaz E. et al. Ultrashort echo time spectroscopic imaging (UTESI): an efficient method for quantifying bound and free water. NMR Biomed. 2012; 25: 161-168
- Carl M. et al. Effects of Fat Saturation on T2* Quantification. ISMRM 2017, program nr. 5092
- Du J. et al. Ultrashort Echo Time Spectroscopy Imaging (UTESI) of Cortical Bone. MRM. 2007;58:1001-100
- Filho G.H et al. Quantitative Characterization of the Achilles Tendon in Cadaveric Specimens: T1 and T2* Measurements Using Ultrashort-TE MRI at 3T. AJR. 2009;192:W117-W124
Figures