5185
Single- and Bi-component Analyses of T2* Relaxation in Knee Tendon and Ligament by Using 3D Ultrashort Echo Time Cones (UTE Cones) Magnetic Resonance Imaging1Third Affiliated Hospital of Southern Medical University (Academy of Orthopedics · Guangdong Province), Guangzhou, China, 2University of California, San Diego, San Diego, CA, United States
Synopsis
For patellar tendon (PT), anterior cruciate ligament (ACL) and posterior cruciate ligament (PCL) of the knee joint, the in vivo application of the bound and free water mapping techniques is still limited. In this study, we aimed to develop 3D multi-echo fat saturated ultrashort echo time Cones (3D FS-UTE-Cones) imaging protocol for fast volumetric mapping of free and bound water components of whole knee joints in a clinical 3T scanner. The results showed that, for PT, PCL and ACL, the short and long T2* components and their fractions can be characterized by 3D FS-UTE-Cones acquisitions with bi-component T2* analysis, accompanying with superior resolution and short scanning time.
INTRODUCTION
Most knee joint tissues, including PT, PCL and ACL, have two components, namely bound water (BW) and free water (FW). FW has a longer T2* (T2*L) and is located between the network of interwoven collagen bundles, and BW has a shorter T2* (T2*S) and is associated with collagen and/or proteoglycan. 1-4 Previous studies have demonstrated that, using UTE techniques, single- and bi-exponential T2* signal decay models are suitable for studying the composition of normal and abnormal tendons and ligaments (e.g., ligament tears). 1,5 However, bi-component analysis typically requires a long scan time to allow acquisition of all images at different TEs. 6,7 High spatial resolution is also needed in order to image the fine structures in the knee joint. As a result, the in vivo application of BW and FW mapping techniques is still limited. 8-10 In this study, we aimed to develop 3D multi-echo fat saturated ultrashort echo time Cones (3D FS-UTE-Cones) imaging protocol for fast volumetric mapping of water components of the knee joint in a clinical 3T scanner. METHODS
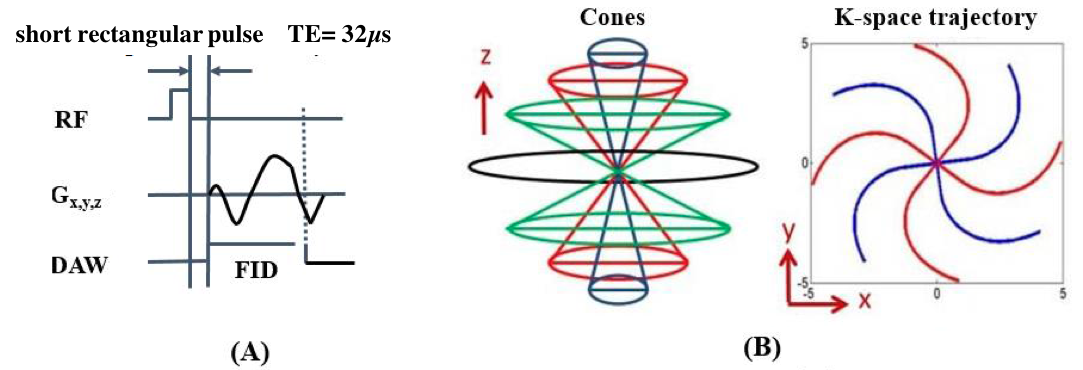
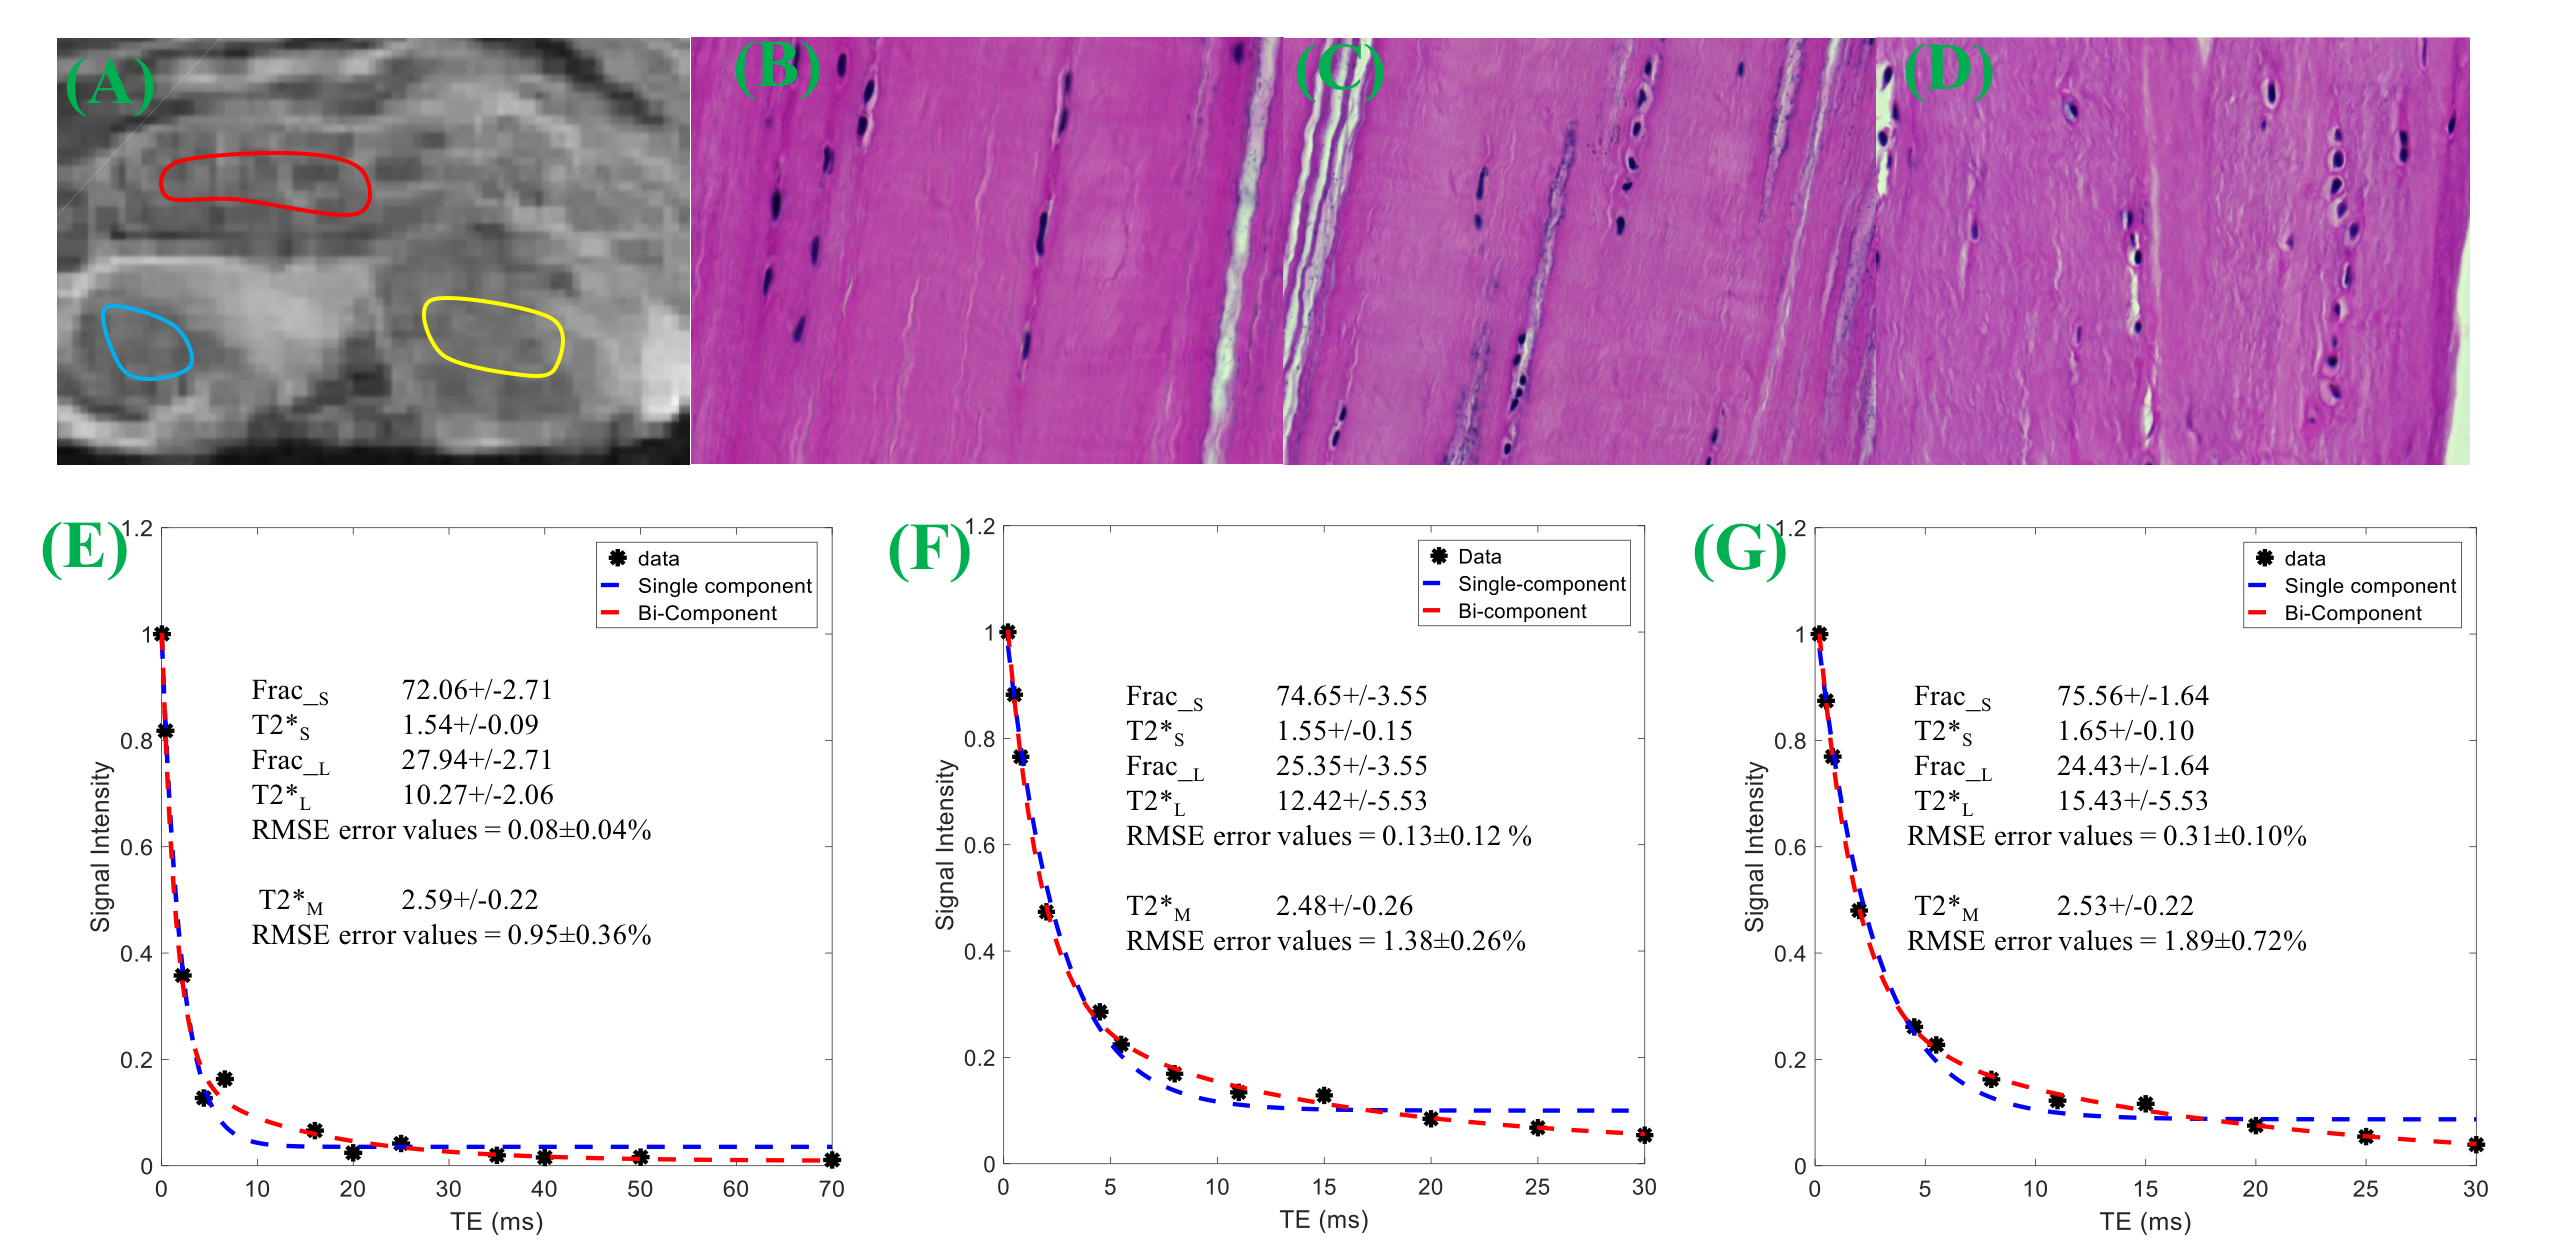
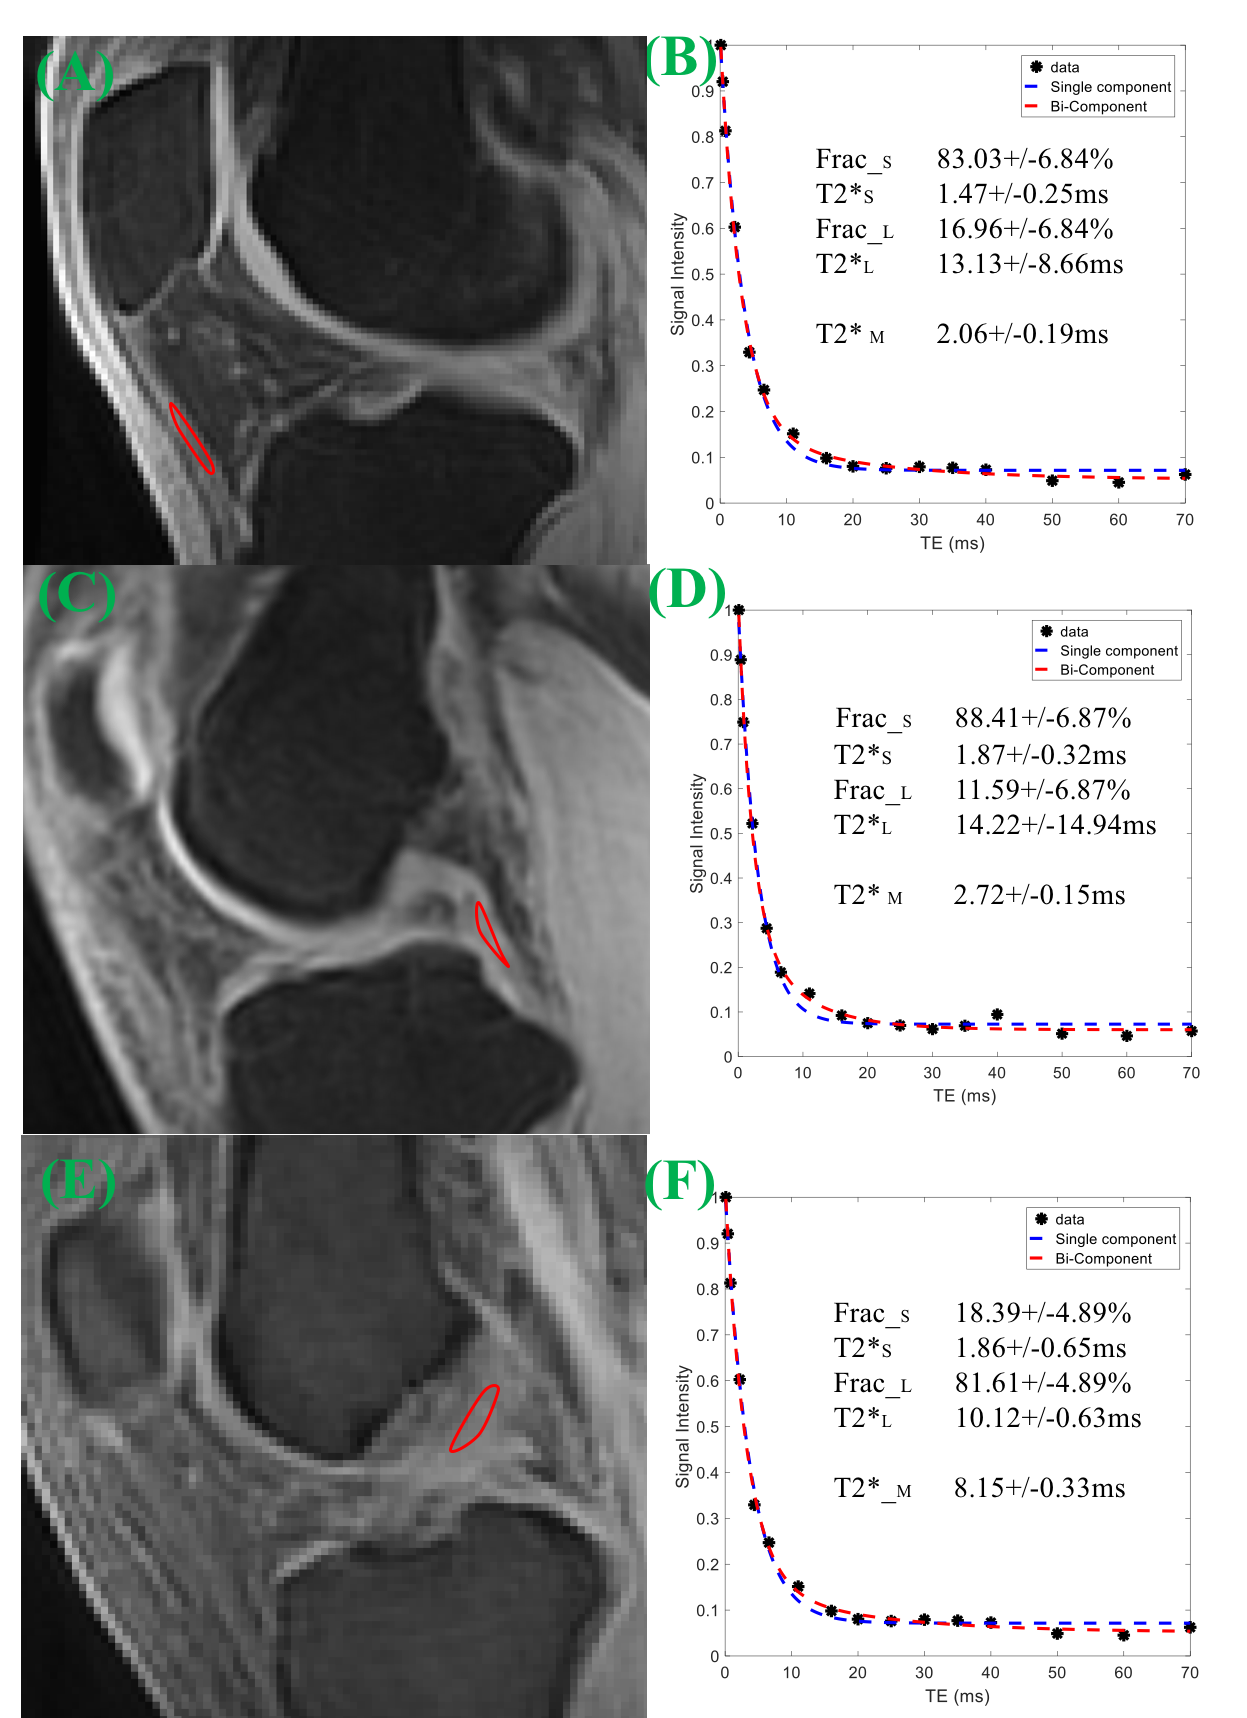
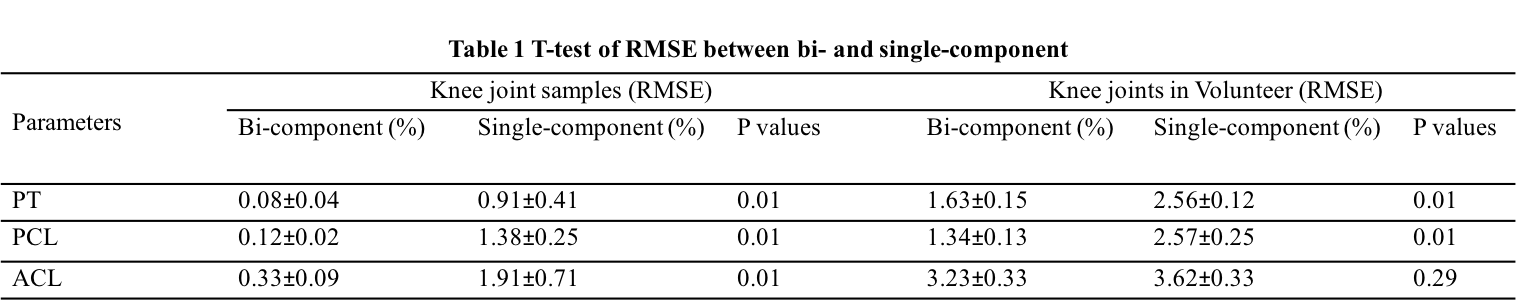
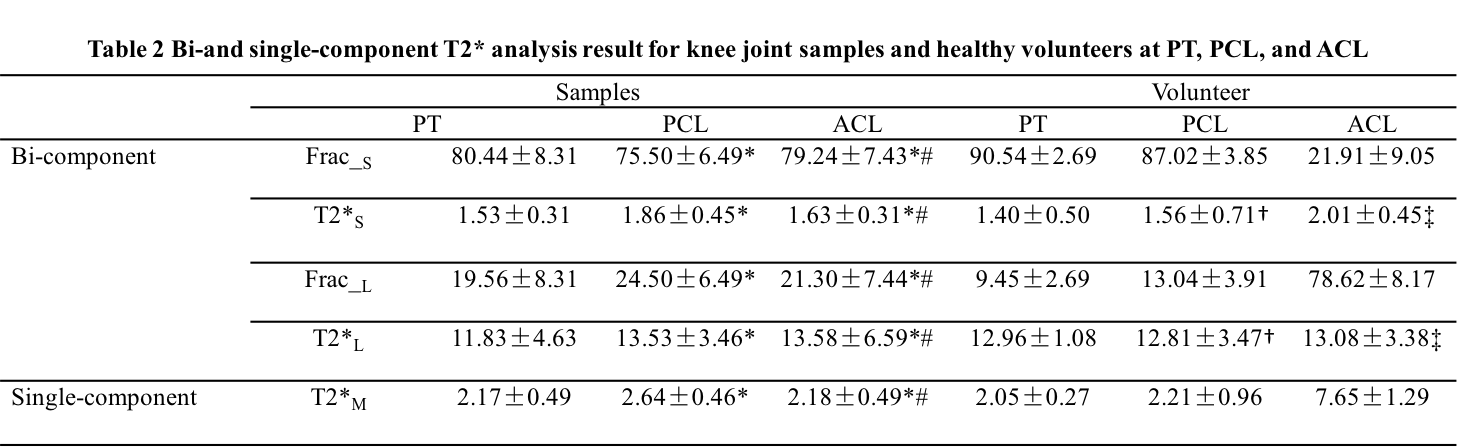
Knees of five healthy volunteers and six knee joint samples from cadavers were scanned with a 16-channel knee coil via 3D multi-echo FS-UTE-Cones acquisitions (Figure 1) on a clinical scanner. Single-component fitting of T2*M, and bi-component fitting of T2*S, long T2*L, short T2* fraction (Frac_S) and long T2* fraction (Frac_L), were performed within tendons and ligaments. An independent sample t-test with equal variances was performed to obtain the difference in the root mean square error (RMSE), T2*M, T2*S and T2*L values, and their fractions between PT, ACL and PCL. P less than 0.05 was considered statistically significant. Samples were stained with hematoxylin and eosin (H&E) for histology.RESULTS
DISCUSSION AND CONCLUSIONS
Acknowledgements
The authors thanked Niloofar Shojaeiadib for the statistical analysis, and Rose Luo and Jonathan Wong for proofreading the manuscript. This study has received grants from the National Scientific Foundation of China (No. 81471810), the Science and Technology Plan Projects of Guangdong provincial, China (No. 2014A020211018, 2014A020212399).References
1. Kijowski R, Wilson JJ, Liu F. Bicomponent ultrashort echo time T2* analysis for assessment of patients with patellar tendinopathy. Journal of Magnetic Resonance Imaging. 2017.
2. Juras V, Apprich S, Szomolanyi P, Bieri O, Deligianni X, Trattnig S. Bi-exponential T2* analysis of healthy and diseased Achilles tendons: an in vivo preliminary magnetic resonance study and correlation with clinical score. European radiology. 2013;23(10):2814-22.
3. Robson M, Benjamin M, Gishen P, Bydder G. Magnetic resonance imaging of the Achilles tendon using ultrashort TE (UTE) pulse sequences. Clinical radiology. 2004;59(8):727-35.
4. Eckstein F, Cicuttini F, Raynauld J-P, Waterton J, Peterfy C. Magnetic resonance imaging (MRI) of articular cartilage in knee osteoarthritis (OA): morphological assessment. Osteoarthritis and cartilage. 2006;14:46-75.
5. Rahmer J, Börnert P, Dries SP. Assessment of anterior cruciate ligament reconstruction using 3D ultrashort echo‐time MR imaging. Journal of Magnetic Resonance Imaging. 2009;29(2):443-8.
6. Du J, Diaz E, Carl M, Bae W, Chung CB, Bydder GM. Ultrashort echo time imaging with bicomponent analysis. Magnetic resonance in medicine. 2012;67(3):645-9.
7. Juras V, Apprich S, Zbýň Š, Zak L, Deligianni X, Szomolanyi P, et al. Quantitative MRI analysis of menisci using biexponential T2* fitting with a variable echo time sequence. Magnetic resonance in medicine. 2014;71(3):1015-23.
8. Bae WC, Du J, Bydder GM, Chung CB. Conventional and ultrashort time-to-echo magnetic resonance imaging of articular cartilage, meniscus, and intervertebral disk. Topics in magnetic resonance imaging : TMRI. 2010;21(5):275-89.
9. Pauli C, Bae WC, Lee M, Lotz M, Bydder GM, D'Lima DL, et al. Ultrashort-echo time MR imaging of the patella with bicomponent analysis: correlation with histopathologic and polarized light microscopic findings. Radiology. 2012;264(2):484-93.
10. Chang EY, Du J, Iwasaki K, Biswas R, Statum S, He Q, et al. Single- and Bi-component T2* analysis of tendon before and during tensile loading, using UTE sequences. J Magn Reson Imaging. 2015;42(1):114-20.
11. Bydder M, Rahal A, Fullerton GD, Bydder GM. The magic angle effect: a source of artifact, determinant of image contrast, and technique for imaging. Journal of magnetic resonance imaging : JMRI. 2007;25(2):290-300.
12. Robson MD, Gatehouse PD, Bydder M, Bydder GM. Magnetic resonance: an introduction to ultrashort TE (UTE) imaging. Journal of computer assisted tomography. 2003;27(6):825-46.
13. Josan S, Kaye E, Pauly JM, Daniel BL, Pauly KB. Improved half RF slice selectivity in the presence of eddy currents with out-of-slice saturation. Magn Reson Med. 2009;61(5):1090-5.
14. Gurney PT, Hargreaves BA, Nishimura DG. Design and analysis of a practical 3D cones trajectory. Magnetic resonance in medicine. 2006;55(3):575-82.
15. Barger AV, Block WF, Toropov Y, Grist TM, Mistretta CA. Time-resolved contrast-enhanced imaging with isotropic resolution and broad coverage using an undersampled 3D projection trajectory. Magn Reson Med. 2002;48(2):297-305.
Figures