5182
Texture features from T2 and T1ρ mapping of meniscus in normal and osteoarthritic knee joints1Radiological Sciences, University of California, Irvine, CA, United States
Synopsis
This study demonstrates a feasibility of texture analysis based on T2 and T1ρ mapping of the meniscus. Some of the investigated texture features showed statistically significant differences for both the medial and lateral meniscus between normal volunteers and patients with osteoarthritic knees. One particular texture feature (contrast) based on T2 was also able to differentiate patients with advanced from early knee osteoarthritis for the lateral meniscus as well. The results in this study demonstrate an alternative analytical approach based on texture features as surrogate variables for the evaluation of meniscus properties using T2 and T1ρ mapping.
Purpose:
The menisci act to disperse the weight of the body and serve important functions of shock absorption, joint stability and lubrication during movement. Injury or degeneration of meniscus thus may lead to development of knee osteoarthritis (OA). Quantitative assessment of degenerative changes in cartilage based on T2 or T1ρ mapping is becoming a widely used MRI technique that has been previously utilized in study of the articular cartilage as well as the meniscus, which usually relies on calculation of arithmetic means of T2 or T1ρ relaxation time within regional or entire cartilage-based ROI (region of interest). Analysis based on texture features describes the spatial distribution of relaxation times within ROI and already has demonstrated its value as surrogate variables in various imaging studies of the female breast, the human brain, and the prostate.1-3 In this study we present texture features from T2 and T1ρ mapping of the meniscus and compare their values from normal knee joints to that of osteoarthritic knees.Materials and Methods:
The study protocol was approved by the institutional review board, and all subjects gave written informed consent before any study-related procedures were done. Twenty healthy volunteers (mean: 29 yrs, range: 19-38) and 23 patients (mean: 56 yrs, range: 19-90) consisting of 5 with advanced OA (AOA) and 18 with early OA (EOA) diagnosis were enrolled. All MR studies were performed on a 3T scanner (Achieva, Philips Healthcare, Netherlands) using a dedicated knee-coil. Both T2 and T1ρ mapping were performed in sagittal orientation using the same FOV, image-matrix, number of slices, and slice-thickness at 140-mm, 512, 31, and 3-mm, respectively. T2 mapping was based on 2D TSE sequence with 7 different echo times (TEs: 13-91 in step of 13 ms), and T1ρ mapping was based on 3D-GRE with 4 different times of spin-lock (TSL) at 20, 40, 60, and 80 ms. Manual meniscus segmentation was performed by two experienced MSK radiologists on T2 and T1ρ images offline using MIPAV package (Medical Imaging Processing, Analysis and Visualization; National Institute of Health, Bethesda, Maryland, USA). Texture features based on GLCM4 (Gray-Level Co-occurrence Matrix) were generated for segmented meniscus on each slice using in-house developed software in Matlab (MathWorks, Natick, USA). Four of the most commonly used texture features: contrast (CON), angular second moment (ASM), correlation (COR), and entropy (ENT), based on each of the four available pixel-offsets: 0°, 45°, 90°, and 135°, were obtained from one representative slice of the lateral and medial meniscus, respectively, and compared between the volunteers and patients.Results:
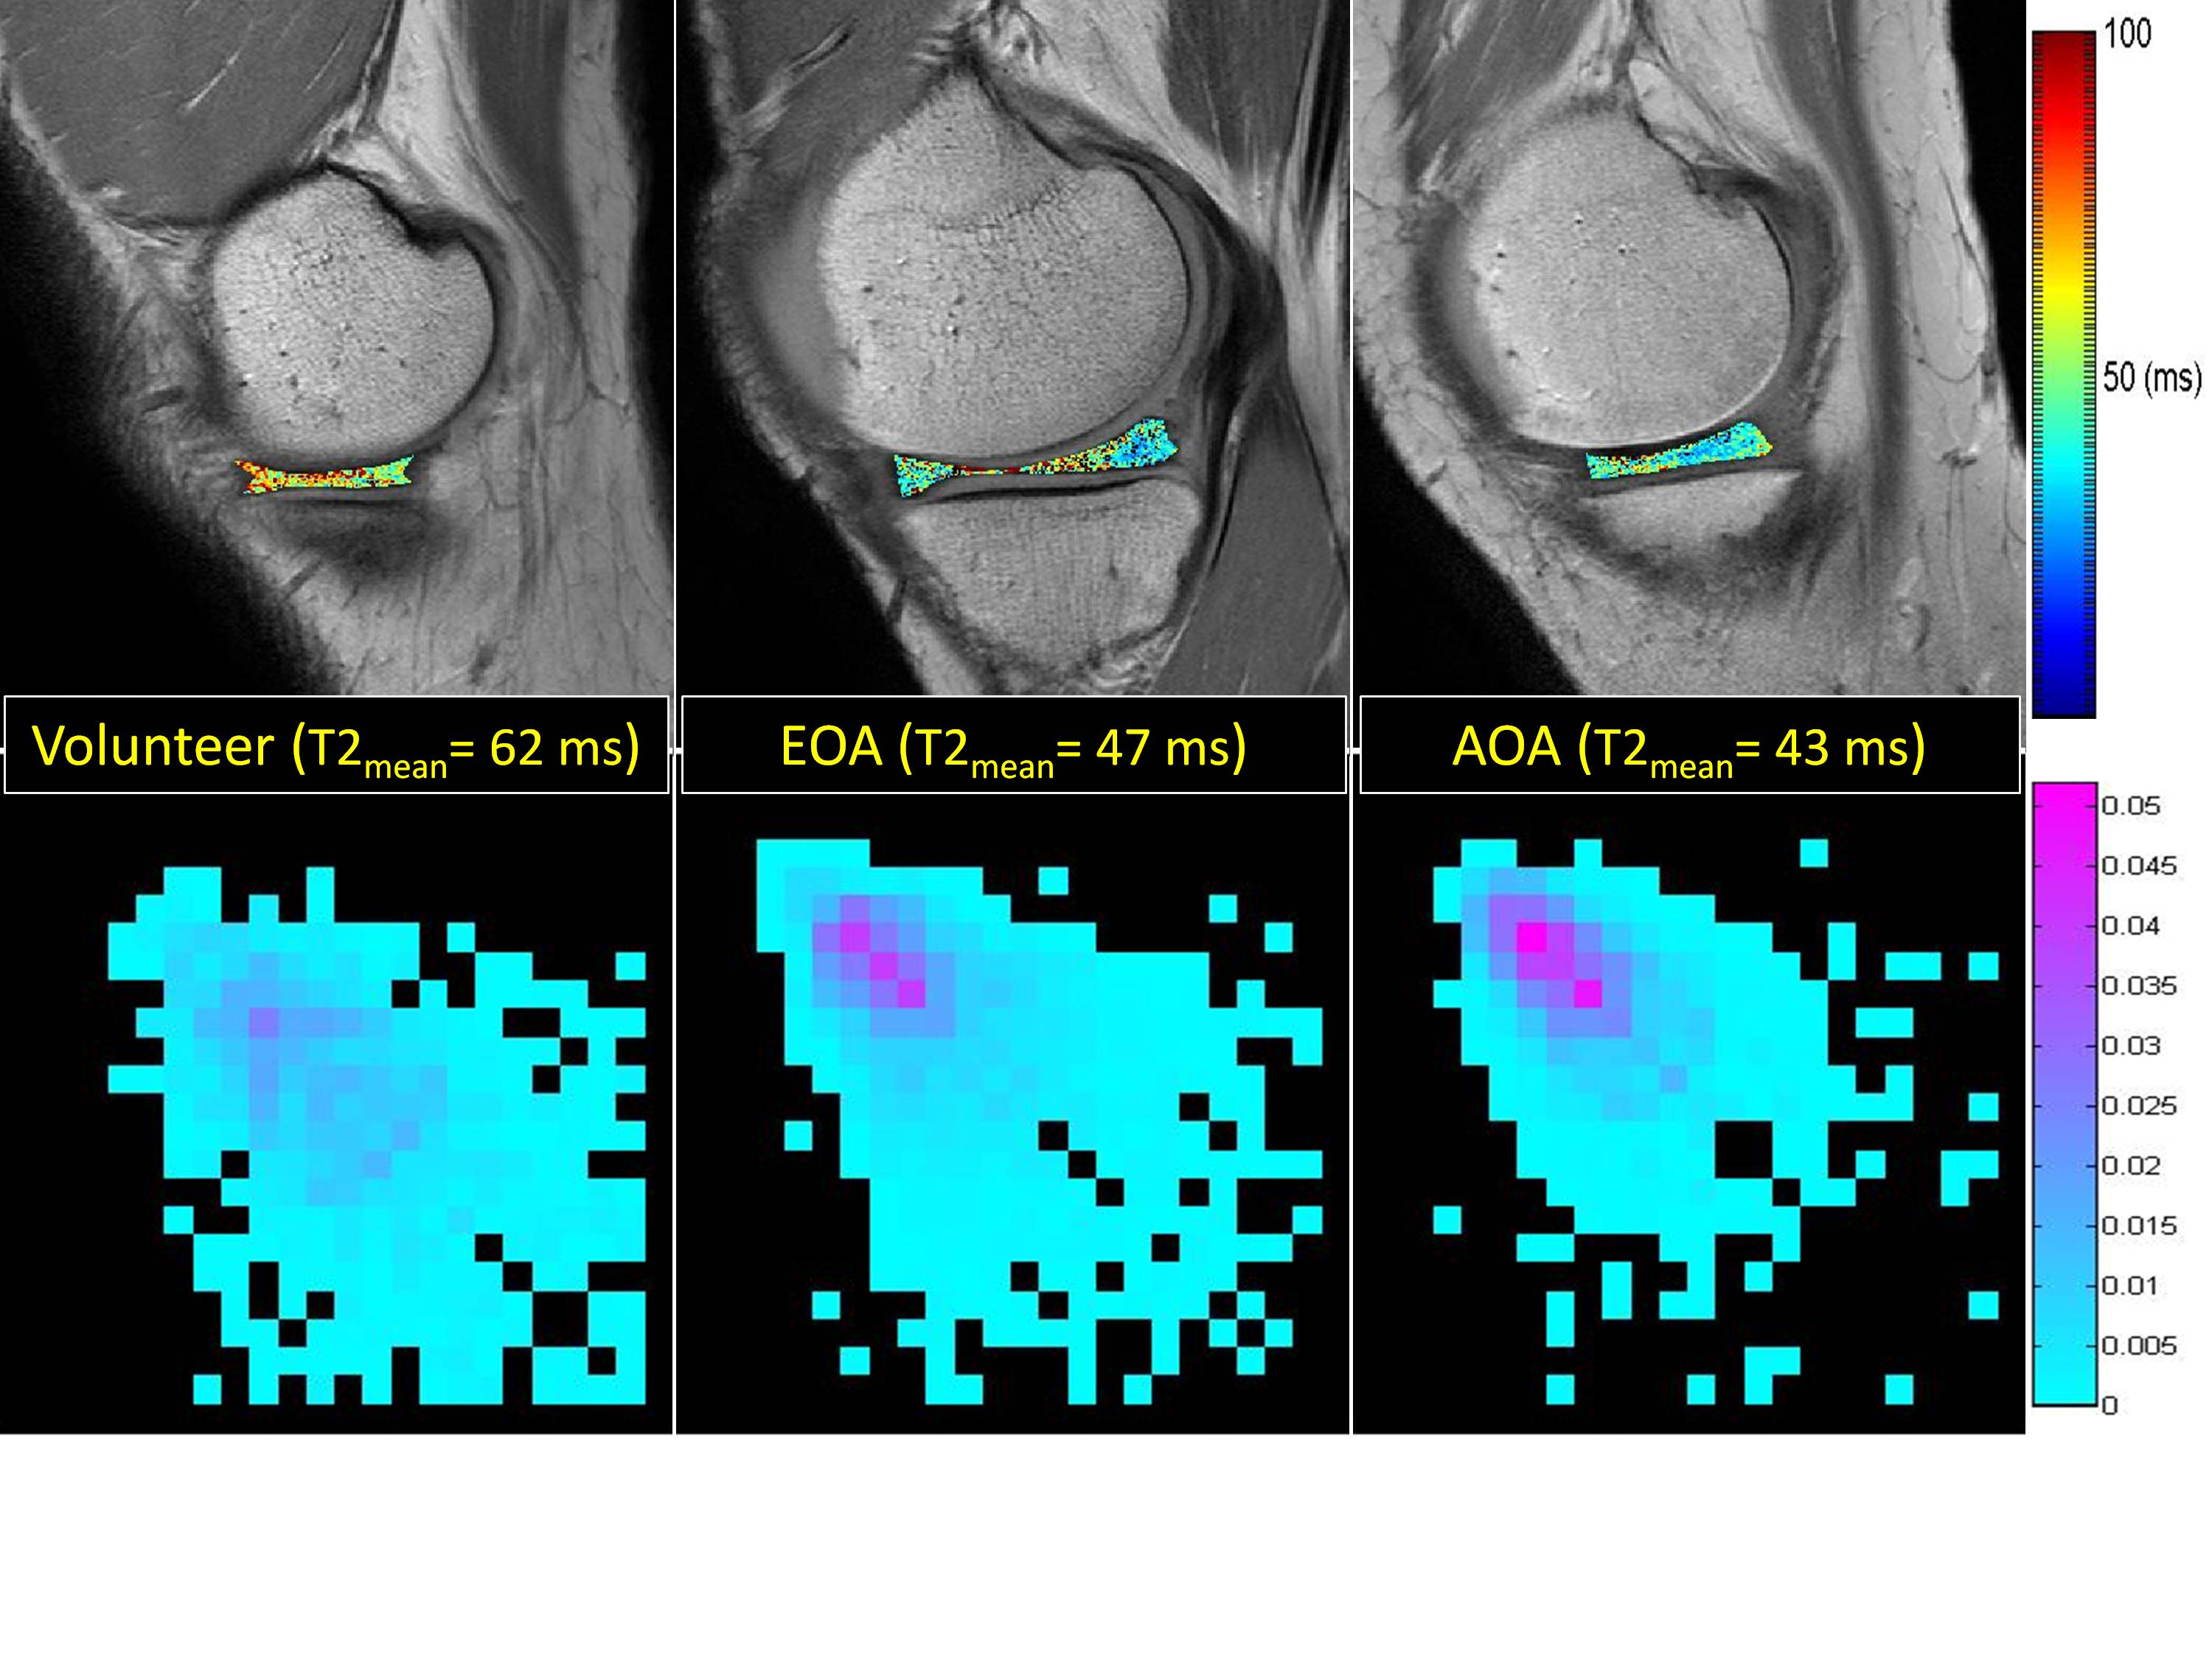
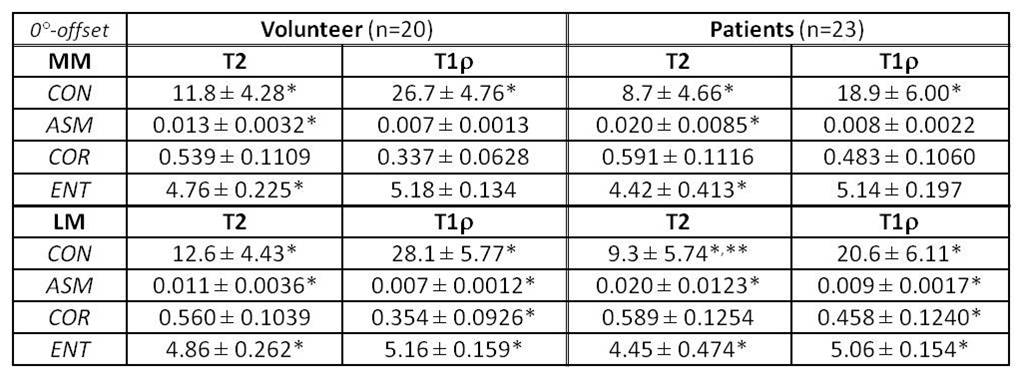
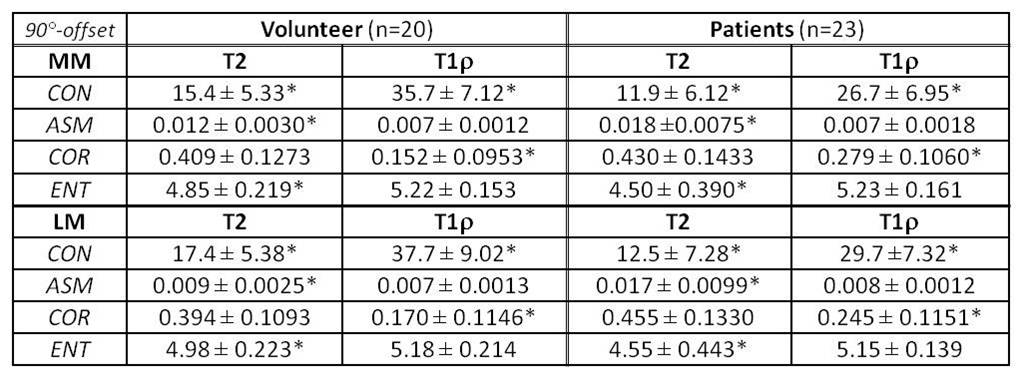
Medial meniscus segmentation was demonstrated in T2 image along with the corresponding meniscus T2 map overlaid and shown in top row of Fig. 1 for a volunteer, EOA, and AOA patient, respectively. Normalized GLCM with 0° pixel-offset corresponding to the meniscus T2 map was shown in bottom row of Fig.1 for the same 3 subjects. The GLCM clearly demonstrates a shift in spatial distribution of as well as decrease in T2 value within meniscus of knee osteoarthritis when compared to the volunteer. Group-averaged texture features based on both T2 and T1ρ relaxation times from the lateral (LM) and medial meniscus (MM) are summarized in Tables 1-4 for each of the 4 pixel-offset definitions used in creation of GLCM. Despite not all meeting a statistical significance (P < 0.05), there was a consistent trend in both T2 and T1ρ for which the patient group showed a decrease in two of the texture features (CON, ENT) but an increase in the other two features (ASM, COR) in comparison to volunteers.Discussion:
Three out of the 4 texture features investigated in this study, CON, ASM, and COR, can be considered as classifiers that express visual textual characteristics of the image. CON measure the local variations, and COR measures the linear dependencies in grey-level. ASM measures the image homogeneity. ENT, which is based on information theory, is a measure of disorder or randomness in grey-level. Regardless T2 or T1ρ time CON appeared to be the most robust texture feature being able to discriminate OA patients. Despite the small sample size, CON based on T2 with 0° & 45° pixel-offsets also was able to differentiate AOA subgroup from EOA for the lateral meniscus. Contrary to the T2 texture features T1ρ had a strong dependency on the pixel-offset definition as to whether a given feature could differentiate patients from volunteers, especially for the lateral meniscus.Conclusion:
This study demonstrates a feasibility of texture analysis based on T2 and T1ρ mapping of the meniscus using normal volunteers and patients with osteoarthritic knees.Acknowledgements
No acknowledgement found.References
1. Nie K, Chen JH, Yu HJ, et al. Quantitative Analysis of Lesion Morphology and Texture Features for Diagnostic Prediction in Breast MRI. Acad Radiol. 2008;15(12):1513-1525.
2. Kruggel F, Paul JS, Gertz HJ. Texture-based segmentation of diffuse lesions of the brain’s white matter. Neuroimage. 2008;39(3):987-996.
3. Lv D, Guo X, Wang X, et al. Computerized characterization of prostate cancer by fractal analysis in MR images. J Magn Reson Imaging. 2009;30(1):161-168.
4. Castellano G, Bonilha L, Li LM, et al. Texture analysis of medical images. Clinical Radiology. 2004;59(12):1061-1069.
Figures