5180
Quantitative MRI in patients with Greater Trochanteric Pain Syndrome and Asymptomatic Volunteers: an Exploratory Study on T2* and T1 mapping.1Radiology, Centre Hospitalier de l'Université de Montréal, Montreal, QC, Canada, 2Radiology, Radio-Oncology and Nuclear Medicine, Université de Montréal, Montreal, QC, Canada, 3Readaptation Medicine, Centre Hospitalier de l'Université de Montréal, Montreal, QC, Canada, 4Institut de réadaptation Gingras-Lindsay-de-Montréal, Montreal, QC, Canada, 5Centre de Physiatrie Dorchester, Montreal, QC, Canada
Synopsis
Greater Trochanteric Pain Syndrome is a debilitating and highly prevalent disorder in women. Quantitative short-TE MRI sequences might overcome conventional MRI limitations in characterizing and staging gluteus tendinopathy. Ten patients and 10 asymptomatic volunteers were evaluated with hip MRI. Manual segmentations of the hip tendons were done to map T1 and T2* relaxation times. Statistically significant results were found for the T1 values of the lateral gluteus medius tendon, and for the T2* values of both parts of the gluteus medius, and the gluteus minimus tendons, indicating very promising results.
Background:
Greater Trochanteric Pain Syndrome (GTPS) is a highly prevalent disorder in women of more than 50 years of age1,2. GTPS refers to lateral hip pain caused by gluteus tendinopathy3. Conventional MRI, so far, has played a minor role in the staging-process of gluteus tendinopathy.
We hypothesized that T1 and T2* parameters of gluteus minimus (Gmin) and gluteus medius (Gmed) tendons, estimated from short-TE gradient echo (GE) sequences, would be significantly different between patients with GTPS and asymptomatic volunteers.
Materials and method:
Ten patients with GTPS, and 10 asymptomatic volunteers were evaluated with hip MRI using quantitative T1 and T2* mapping sequences based on short-TE GE sequences4,5,6. MRI was performed on a clinical 3T system (Achieva X-series, Philips Healthcare), using a 16-channel surface coil.
Quantitative T2* mapping was performed using a multi-echo, variable TE, slab-selective 3D GE sequence. Two multi-echo sequences with 6 TEs each were acquired, for a total of 12 TEs: TE=1.1, 2.8, 4.5, 6.2, 7.9, 9.6, 11.3, 13.0, 14.7, 16.4, 18.1 and 19.8 ms. Other acquisition parameters were: TR= 46 ms, FOV= 154 mm x 154 mm x 72 mm, spatial resolution= 0.6 mm x 0.8 mm x 3 mm, flip angle= 18 degrees, bandwidth= 785.7 Hz/pixel, acquisition time= 11min 24sec. Quantitative T1 mapping was performed using a variable flip angle GE sequence4 with identical coverage and spatial resolution. Other parameters were: TR= 29 ms, TE= 1.15 ms, flip angles = 5, 15 and 25 degrees, acquisition time= 9min 39sec.
Segmentations of the Gmin, the posterosuperior Gmed, and the lateral Gmed tendons were performed independently by a radiologist and a radiology resident, using ITK-SNAP (http://www.itksnap.org) on the T2* map. The segmentations were then mapped to the co-registered quantitative T1 map (Figure 1). T2* values were estimated on a voxel-by-voxel basis by performing a nonlinear mono-exponential regression, using Matlab (The Mathworks, Natick, MA, USA). T1 values were estimated on a voxel-by-voxel basis using the methodology developed by Grosse et al.4 implemented in Matlab. Information from a B1 mapping sequence was included in order to correct for spatial B1 inhomogeneity.
The Mann-Whitney U test was used to compare the mean T2* and mean T1 relaxation times of the various tendons; a p-value < 0.05 was considered statistically significant.
Results
Demographic data of both groups are presented in Table 1.
Table 2 presents the mean T1 and T2* values, for each tendon and for both readers, in the two groups. For both readers and all three tendons, the mean T1 values were lower in the patients compared with the volunteers. The difference in mean T1 values between the both groups was statistically significant in the lateral Gmed tendon for both readers. For both readers and all three tendons, the mean T2* values were generally higher in the patients compared with the volunteers. The difference in mean T2* values between the two groups was statistically significant in all three tendons for reader 2, and for the posterosuperior Gmed and lateral Gmed tendons for reader 1.
Figures 2 and 3 respectively present the scatterplots and the boxplots of the T1 and T2* values of each tendon, for the two groups, as reported by readers 1 and 2.
Discussion
Both readers found significantly lower mean T1 values in the lateral Gmed tendons of the patients compared to the volunteers. This decrease in mean T1 values is potentially linked to structural or cellular tendon changes. Significantly higher mean T2* values were found in all tendons of the patients compared to the volunteers, which suggest a higher water content in pathological tendons and is in accordance with conventional MRI findings.
Our results also suggest that structural changes between pathological and normal tendons may not influence T1 values as much as T2* values. As depicted in Figure 2, T2* values appear to discriminate pathological tendons better as compared to the T1 values.
As shown in Figure 3, we found greater variability between readers for the assessment of the lateral Gmed tendon. This could be explained by technical factors as the lateral Gmed tendon is a relatively thin structure and was found to be more difficult to segment.
Conclusion
This exploratory study showed significantly lower T1 values in the lateral Gmed tendons, and significantly higher T2* values in the Gmin, lateral Gmed and posterosuperior Gmed tendons in patients with GTPS, when compared to volunteers, indicating that quantitative MRI may potentially be used as a noninvasive imaging tool for characterization and staging of gluteus tendinopathy.Acknowledgements
No acknowledgement found.References
1. Blank E, Owens BD, Burks R, Belmont PJ, Jr. Incidence of greater trochanteric pain syndrome in active duty US military servicemembers. Orthopedics 2012;35:e1022-7.
2. Segal NA, Felson DT, Torner JC, et al. Greater trochanteric pain syndrome: epidemiology and associated factors. Archives of physical medicine and rehabilitation 2007;88:988-92.
3. Fearon AM, Cook JL, Scarvell JM, Neeman T, Cormick W, Smith PN. Greater trochanteric pain syndrome negatively affects work, physical activity and quality of life: a case control study. The Journal of arthroplasty 2014;29:383-6.
4. Grosse U, Springer F, Hein T, et al. Influence of physical activity on T1 and T2* relaxation times of healthy Achilles tendons at 3T. Journal of magnetic resonance imaging : JMRI 2015;41:193-201.
5. Grosse U, Syha R, Hein T, et al. Diagnostic value of T1 and T2* relaxation times and off-resonance saturation effects in the evaluation of achilles tendinopathy by MRI at 3T. Journal of magnetic resonance imaging : JMRI 2015; 41:964-73.
6. Juras V, Apprich S, Szomolanyi P, Bieri O, Deligianni X, Trattnig S. Bi-exponential T2 analysis of healthy and diseased Achilles tendons: an in vivo preliminary magnetic resonance study and correlation with clinical score. European radiology 2013;23:2814-22.
Figures
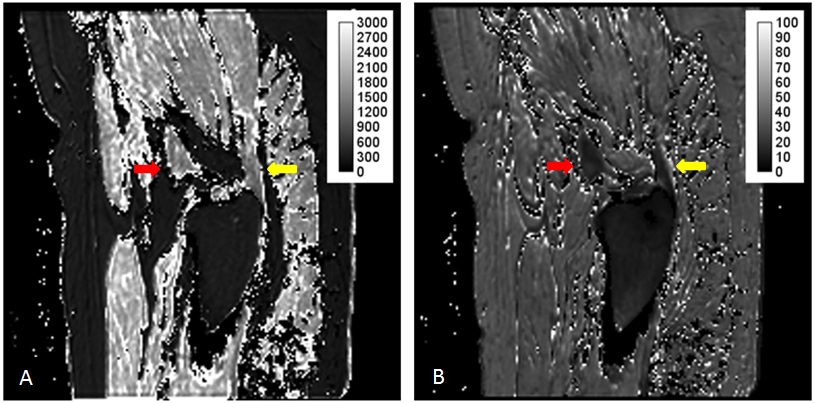
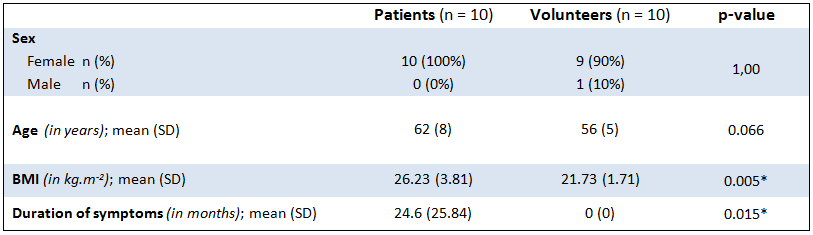
Table 1 : Summary of the demographic data of the patients and the asymptomatic volunteers.
n = number; SD = standard deviation; asterisk = statistical significance (p < 0.05)
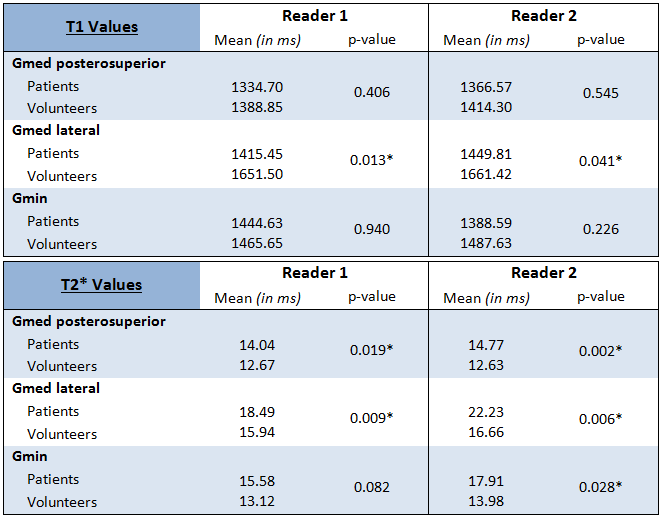
Table 2 : Mean T1 and T2* values for each tendon and both readers in the patients and the asymptomatic volunteers.
Statistical analysis was performed using the Mann-Whitney U test. Gmed = Gluteus medius; Gmin = Gluteus minimus; asterisk = statistical significance (p < 0.05)
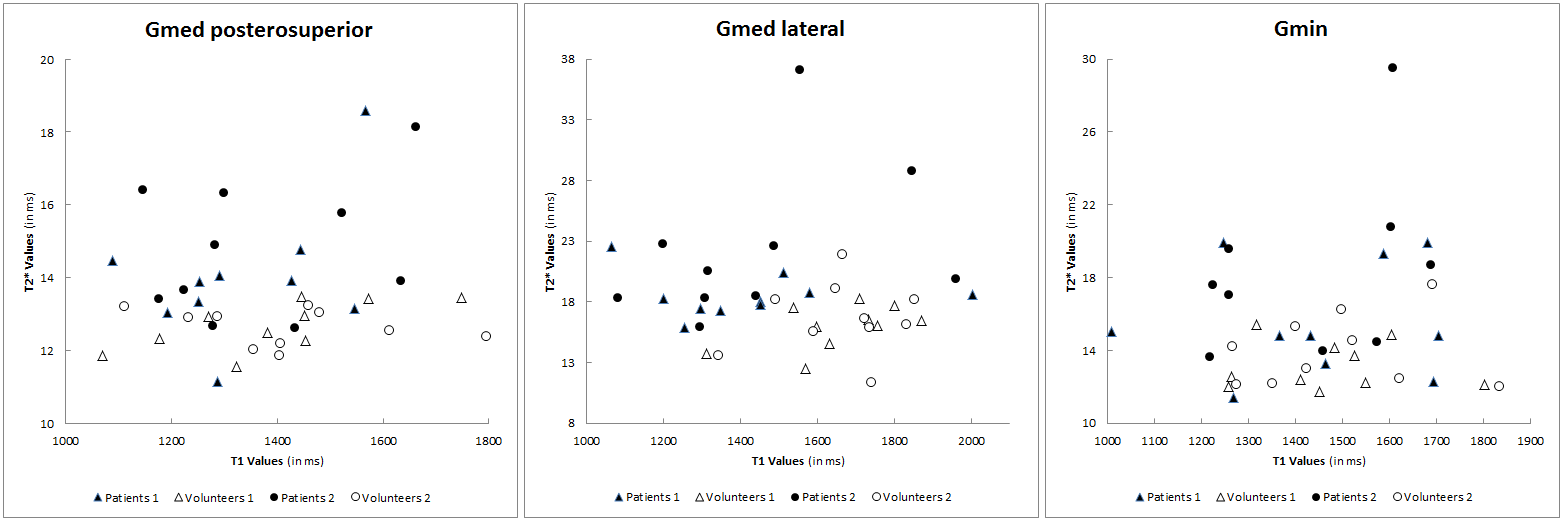
Figure 2 : Scatterplots of the T1 and T2* values of each tendon, in the 10 patients (black points) and the 10 asymptomatic volunteers (white points) according to reader 1 (triangles) and reader 2 (circles).
Gmed = Gluteus medius; Gmin = Gluteus minimus
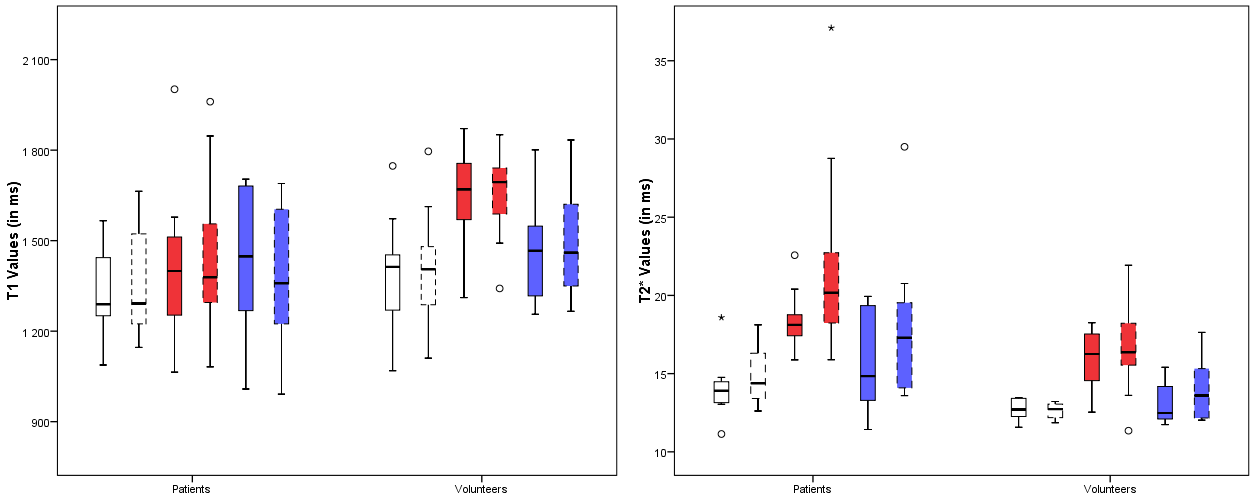
Figure 3 : Boxplots of T1 and T2* values of each tendon in the patients and the asymptomatic volunteers, according to reader 1 and 2.
White = posterosuperior Gluteus medius; red = lateral Gluteus medius; blue = Gluteus minimus; full lines = reader 1; dashed lines = reader 2; circle = data more than 1.5 times the interquartile range from Q3; asterisk = extreme outlier more than 3 times the interquartile range from Q3