5177
CPPD-diseased, Normal and Degenerated Menisci: Biomechanical and quantitative MRI-derived Properties1Department of Radiology, University of California, School of Medicine, San Diego, CA, USA, San Diego, CA, United States, 2Department of Radiology, University Hospital Zurich, Zurich, Switzerland, 3Department of Radiology, University of California, San Diego, School of Medicine, USA, San Diego, CA, United States, 4Department of Radiology, Siriraj Hospital, Bangkok, Thailand, 5Department of Orthopaedic Surgery, University of California, San Diego, School of Medicine, USA, San Diego, CA, United States, 6Department of Radiology, VA San Diego Healthcare System, San Diego, CA, United States
Synopsis
Calcium pyrophosphate crystal deposition (CPPD) disease of the knee is a frequent condition in the elderly population that might cause chondrocalcinosis of the fibrocartilaginous menisci. Controversy exists whether chondrocalcinosis of the menisci is a cause or consequence of osteoarthritis. Thus, it would be desirable to determine whether CPPD-afflicted menisci exhibit altered biomechanical properties and if they correlate with quantitative MR values. Purpose of this study is to investigate if CPP deposits alter the biomechanical properties as well as the UTE values of menisci compared to grossly normal and degenerated human menisci.
INTRODUCTION:
Menisci are crucial for even load distribution of the knee [1] and contain 15-25% highly organized collagen fibers which primarily account for the short T2 properties leading to hypointense signal on standard clinical MRI sequences [2]. With ultrashort time to echo (UTE) MR-techniques (using TE=0-10ms) sufficient MR-signal of the menisci can be acquired. Calcium pyrophosphate crystal deposition (CPPD) disease of the knee is a frequent condition (≈10% are affected ≥60yrs) that leads to chondrocalcinosis affecting the fibrocartilaginous menisci as the predilection site [3; 4]. A chicken-or-egg controversy exists whether chondrocalcinosis of the menisci is conditioned by a systemic procalcifying predisposition that consecutively may lead to osteoarthritis or is a result of an osteoarthritic process with secondary crystal deposition [5]. Thus, it would be desirable to determine whether CPPD-diseased menisci exhibit altered biomechanical properties and if they correlate with UTE-derived quantitative imaging techniques. Purpose of this study is to investigate if CPP-deposits alter the biomechanical properties as well as the UTE-values of menisci compared to grossly normal and degenerated menisci.METHODS:
Samples: From cadaveric donors (n=3, within the course of the study it will be n=10 donors), two grossly normal (mean 69yrs), four degenerated menisci (mean 69yrs) and four CPPD-diseased, but otherwise grossly normal menisci (age 71yrs) were obtained, and cut sagittally into 5 mm thick triangular pieces. MR Imaging: GE 3T-Signa HDx using a 1cm diameter solenoid coil. SE T2 MAP: TR=1000ms, TE=10-83ms, matrix=320x256, slice=2.5mm, FOV=6cm,FA=90deg, BW=±36kHz; 3D Cones: TR=23, TE=0.03-15ms, NEX=1, matrix=384x384, slice=2.5mm, FOV=8cm, FA=90deg, BW=±83kHz. Micro-CT: Micro-CT of CPPD-samples was performed using Skyscan 1076 (Skyscan, Aartselaar, Belgium). Biomechanics: Samples were placed into custom mold to hold and hydrate. Indentation testing was performed using 1mm diameter tip. The cut-surface of each sample opposed to the intercondylar eminence was tested using a 1mm grid. Each site was compressed with an indentation depth of 100μm (over 1s) while measuring the peak force (g). Using custom MATLAB-program, indentation force maps were created. MRI analysis: Using MATLAB, three regions of interest for each meniscus specimen (meniscus zones: (a) red, (b) red-white and (c) white) were used to calculate SE T2 and UTE T2* values using the center slice of each specimen MRI scan. Furthermore, within degenerated samples, degenerated (determined by gross anatomy and/or by clinical MR sequences) vs. non-degenerated regions were compared regarding the SE T2 and UTE T2* values. Statistics: Effects of pathology (normal/degeneration/CPPD) and region of interest (red/red-white/white zones) on indentation force and quantitative MR values were assessed using two-way ANOVA with planned pairwise comparison. For degenerate samples only, we compared the values in regions showing pathology vs. remainder of the sample, using t-test. Correlation between indentation force vs. MR values were assessed using Pearson-correlation.RESULTS:
The anatomy, indentation and quantitative MRI-derived
properties of normal, degenerated and CPPD-affected menisci are illustrated in Figure 1.
As shown in Figure 2,
overall indentation force was significantly higher for CPPD than other samples
(each p<0.001). This was due to the higher values in the red-white
(p<0.000001) and white (p<0.05) zones of the CPPD-samples, but not in the
red zone (p=0.17). For the red zone, over all groups the indentation forces
were significantly lower compared to the red-white and white zone (0.54 vs.
1.48 and 0.54 vs. 1.44, both p<0.0001).
UTE T2* values showed similar but an opposite trend: red
zone values were similar between groups (p=0.8) while in the white zone, UTE
T2* values were the lowest in the CPPD-samples (p<0.05). In contrast, SE T2
values showed no statistical difference between groups. Within degenerated
samples, when degenerated vs. non-degenerated regions were compared,
indentation forces were lower (p<0.01) and SE T2 values were greater
(p<0.05) in degenerated regions. UTE T2* values did not show significant
difference (p=0.2). The negative correlation between indentation force vs. UTE
T2* (Figure 3A, R=-0.55, p<0.001)
was stronger than that vs. SE T2 (Figure
3B, R=-0.46, p<0.01).
DISCUSSION:
These results suggest that CPPD-affected menisci have distinctly stiffer biomechanical properties while degenerated menisci are softer. The UTE-derived quantitative MRI technique might be a suitable indicator for meniscus stiffness as it shows a strong negative correlation with the indentation force. The overall lower stiffness of the red zone is presumably due to the less densely packed histology of the vascularized zone. Within the course of this study the cartilage-bone cores matching the investigated meniscus samples will be analyzed. That might provide evidence that CPPD-affected menisci are involved in osteoarthritis progression [6].CONCLUSION:
Our preliminary data suggest that CPPD-diseased menisci have distinctly stiffer biomechanical properties while degenerated menisci are softer. The UTE-derived quantitative MRI technique may serve as a biomarker for meniscus stiffness.Acknowledgements
This work was supported by grant funding from the RSNA Research Fellow Grant (grant number RF1730), Swiss National Science Foundation (grant number P2SKP3_168412) and Swiss Society of Radiology as well as in-kind support from GE Healthcare.References
1. Danso EK, Makela JT, Tanska P et al (2015) Characterization of site-specific biomechanical properties of human meniscus-Importance of collagen and fluid on mechanical nonlinearities. J Biomech 48:1499-1507
2. Williams A, Qian Y, Golla S, Chu CR (2012) UTE-T2 * mapping detects sub-clinical meniscus injury after anterior cruciate ligament tear. Osteoarthritis Cartilage 20:486-494
3. Abhishek A (2016) Calcium pyrophosphate deposition disease: a review of epidemiologic findings. Curr Opin Rheumatol 28:133-139
4. Rosenthal AK, Ryan LM (2016) Calcium Pyrophosphate Deposition Disease. N Engl J Med 374:2575-2584
5. Abhishek A, Doherty S, Maciewicz R, Muir K, Zhang W, Doherty M (2013) Evidence of a systemic predisposition to chondrocalcinosis and association between chondrocalcinosis and osteoarthritis at distant joints: a cross-sectional study. Arthritis Care Res (Hoboken) 65:1052-1058
6. Neogi T, Nevitt M, Niu J et al (2006) Lack of association between chondrocalcinosis and increased risk of cartilage loss in knees with osteoarthritis: results of two prospective longitudinal magnetic resonance imaging studies. Arthritis Rheum 54:1822-1828
Figures
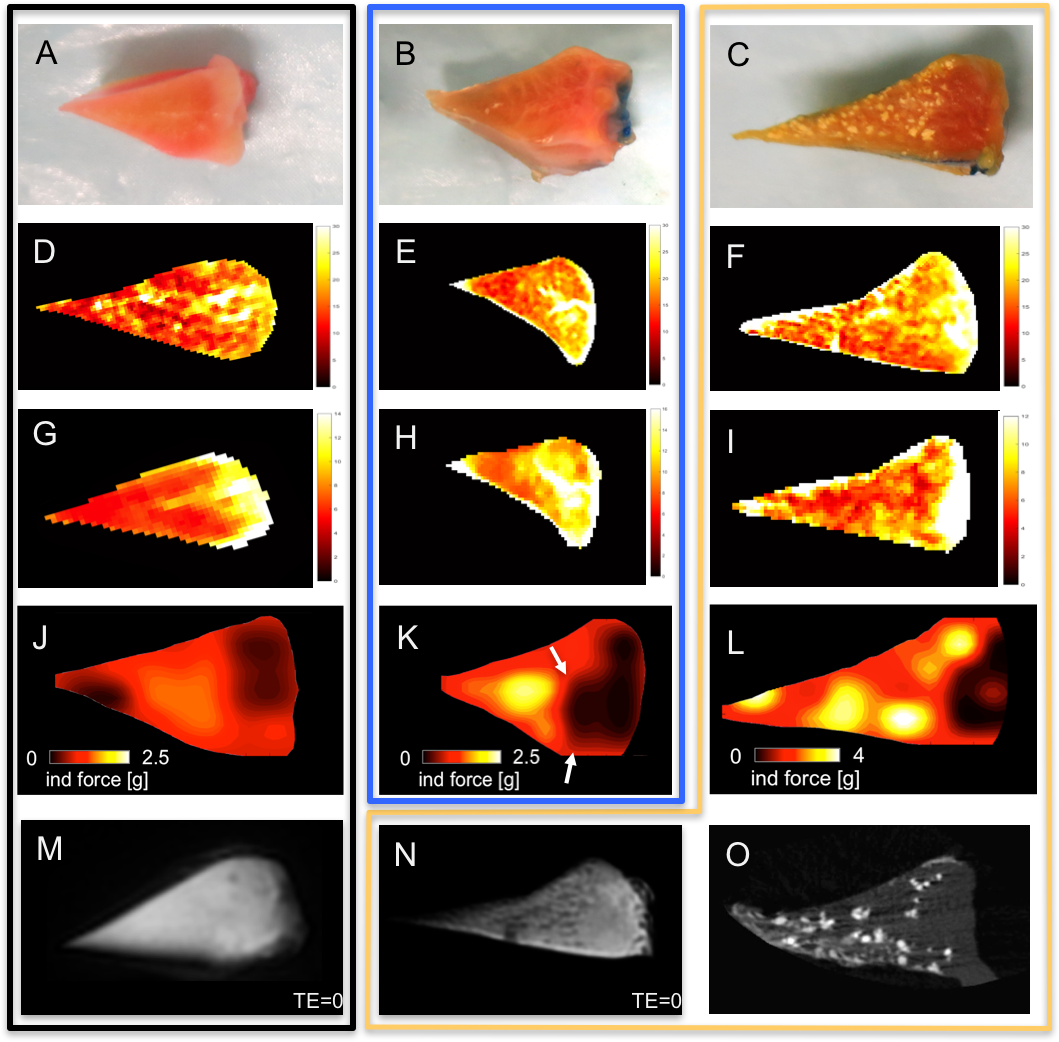
Figure 1. Gross pictures of normal (A), degenerated (B) and CPPD-diseased (C) menisci.
Corresponding SE T2 (D,E,F), UTE T2* (G,H,I) and indentation force maps (J,K,L) are shown. Image (L) indicates that the CPPD-diseased meniscus is distinctly stiffer compared to (J,K). Interestingly, the red zone is almost spared from CPPD-deposits as visible on the gross image (C) and the Micro-CT image (O). In comparison to SE T2 (F), the UTE-technique (I) appears sensitive to CPPD-deposits. UTE-image (N) shows little dark CPPD-spots that are absent in the normal meniscus (M). The arrows in (K) indicate the softened, degenerated area that is partly located in the red zone.
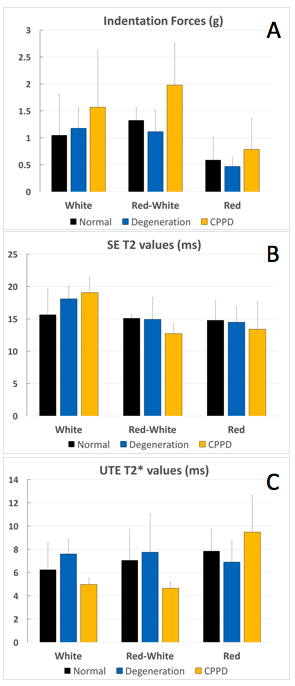
Figure 2. Mean and standard deviation (error bar) values from indentation testing and quantitative MRI for the three meniscal zones.
Indentation force (A) in the red zone of all three groups (normal, degenerated, CPPD) is significantly weaker compared to the red-white and white zone (each p<0.05). Furthermore, the overall indentation force was significantly higher for CPPD than in other samples (each p<0.001). SE T2 values (B) showed no statistical difference between groups (p>0.05) whereas UTE T2* values (C) were the lowest in the white zone of the CPPD samples (p<0.05).
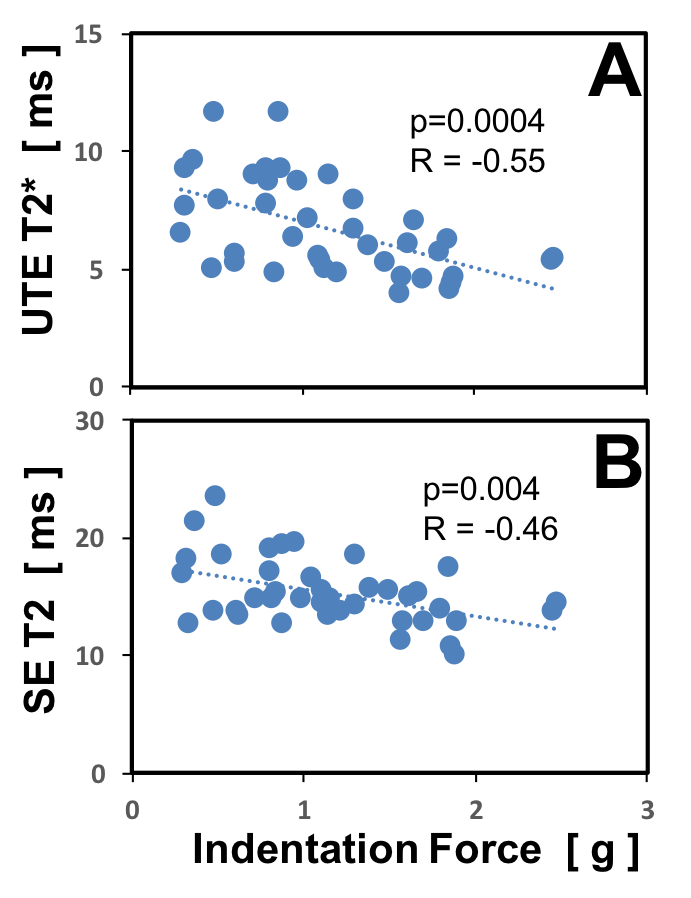
Figure 3. Correlation of quantitative MR values with indentation force.
The indentation forces measured on the cut surface of the meniscus pieces correlated negatively with the UTE T2* (A) and SE T2 (B) values (p=0.0004 and p=0.004, respectively). In other words, the stiffer the menisci are the lower the corresponding quantitative MR values. UTE T2* values correlated more strongly than SE T2 values with the indentation force.