5173
From Bench to Bedside: Improved Detection of Spondylolysis Using 3D Cones Ultrashort Time to Echo (UTE) MR Technique1Department of Radiology, University of California, San Diego, School of Medicine, USA, San Diego, CA, United States, 2Department of Radiology, University Hospital Zurich, Zurich, Switzerland, 3Department of Family Medicine, University of California, San Diego, San Diego, CA, United States, 4General Electric Healthcare, San Diego, CA, United States, 5Department of Radiology, Siriraj Hospital, Bangkok, Thailand, 6Department of Radiology, VA San Diego Healthcare System, San Diego, CA, United States
Synopsis
Spondylolysis, defined as a bony defect in the pars interarticularis of the vertebral arch, is a frequent condition in the young population in which exposure to ionizing radiation is a major concern. In practice, CT imaging is performed in addition to MRI if spondylolysis is suspected. 3D Cones-based UTE MR techniques providing contrast and resolution similar to CT may have overcome the issue of conventional MR-sequences that do not yield sufficient contrast of short T2 tissues near the pars defect. Our study shows in an exemplary manner that detection of spondylolysis with UTE sequences is feasible in the clinical setting.
INTRODUCTION:
Spondylolysis, defined as a bony defect in the pars interarticularis of the vertebral arch, is a common condition and frequently involves L5 level [1; 2]. The young population is predominately affected in which exposure to ionizing radiation is a major concern. In clinical routine, CT imaging or conventional radiographs are performed in addition to lumbar MRI if spondylolysis is suspected. While standard MRI is useful to detect precursor stages of spondylolysis, it is limited in full depiction of the cortical integrity of fractures in the pars interarticularis [3; 4]. That is because of the short T2 properties of cortical bone and soft tissue structures adjacent to the pars defect whose signal has decayed away already [5] if standard MRI sequences with TE>10ms are used. Therefore, the pars defect is masked. Novel ultrashort time to echo (UTE) MR techniques have overcome that issue using TE 0-10ms. Purpose of this study is to demonstrate that novel UTE sequences are feasible to detect spondylolysis.METHODS:
Clinical MRI and 3D Cones UTE MRI of the lumbar spine of one 45 years old male subject (height = 6'4, weight = 210 lb) was acquired at 3-T with a standard spine array coil. Additional subjects will be recruited as we expand the study. Furthermore, for comparison, a similar UTE imaging was performed on a cadaveric lumbar spine specimen (40 year old male) using a higher resolution and longer scanning time. MR Imaging: Following conventional MR sequences were used: sagittal spin echo (SE) T1 (Figure 1A: TR = 3299 ms, TE = 24 ms, matrix = 256x256, slice = 3 mm, FOV = 22 cm, BW = ±62.5 kHz); sagittal SE T2 (Figure 1B: TR = 4134 ms, TE = 102 ms, matrix = 320x288, slice = 3 mm, FOV = 22 cm, BW = ±62.5 kHz); axial SE T2 (Figure 1EFG: TR = 9574 ms, TE = 102 ms, matrix = 320x288, slice = 3.5 mm, FOV = 16 cm, BW = ±62.5 kHz). In addition, the following UTE sequences were used: sagittal 3D Cones (Figure 1C: TR = 23 ms, TE = 0.03 ms, matrix = 384x384, slice = 2.5 mm, FOV = 22 cm, FA = 7 deg, BW = ±125 kHz, scan time = 4 min); axial 3D Cones (Figure 1HIJ: TR = 3.2 ms, TE = 0.03 ms, NEX = 1, matrix = 250x250, slice = 2 mm, FOV = 22 cm, FA = 2 deg, BW = ±125 kHz, scan time = 3 min). Post-processing of the UTE dataset was performed using ImageJ software, and involved smoothing, background subtraction, and inverting (Figure 1DK). Detection of Spondylolysis: For spondylolysis evaluation, axial and sagittal images of the SE T2, and then 3D Cones, sequences were assessed using cross-reference lines. If no defect (i.e., fracture) of the pars interarticularis was visible on the sagittal images, the axial slice immediately below the facet joint L4/5 proved to be most suitable for detection of isthmic spondylolysis.RESULTS:
Spondylolysis was not unequivocally visible on conventional T1- and T2-weighted sequences, whereas on the UTE sequences, a bilateral isthmic spondylolysis was clearly depicted. On conventional images, the low signal intensity adjacent to the spondylolysis and the close proximity to the facet joints on L4/L5 and L5/S1 levels hampered the detection of spondylolysis (Figure 1). The spondylolysis could easily be mistaken for degenerative facet joint disease on standard MR sequences. The total scanning time for both UTE sequences was 7 minutes.DISCUSSION:
On standard MRI sequences, short T2 tissues such as ligamentous structures and scar tissue [6] surrounding the pars interarticularis defect remain dark, while on UTE sequences these structures provide detectable signal. Therefore, there is sufficient contrast to distinguish darker bony structures from other soft tissues to easily depict the spondylolysis. These preliminary results suggest that detection of spondylolysis is feasible without the use of ionizing radiation of CT or radiography. If these results could be confirmed in the course of our study it would have an immediate clinical impact as CT imaging of the lumbar spine or plain radiographs (usually three planes including posterior oblique view) could be avoided. This would help to save cost and radiation dose exposure.CONCLUSION:
Our preliminary study show that sensitive detection of spondylolysis with UTE sequences is feasible in the clinical setting.Acknowledgements
This work was supported by grant funding from NIH NIAMS (AR066622), Swiss National Science Foundation (grant number P2SKP3_168412) and Swiss Society of Radiology as well as in-kind support from GE Healthcare.References
1. Jinkins JR, Matthes JC, Sener RN, et al. Spondylolysis, spondylolisthesis, and associated nerve root entrapment in the lumbosacral spine: MR evaluation. AJR Am J Roentgenol. 1992;159(4):799-803.
2. Hu SS, Tribus CB, Diab M, et al. Spondylolisthesis and spondylolysis. Instr Course Lect. 2008;57:431-45.
3. Syrmou E, Tsitsopoulos PP, Marinopoulos D, et al. Spondylolysis: a review and reappraisal. Hippokratia. 2010;14(1):17-21.
4. Campbell RS, Grainger AJ, Hide IG, et al. Juvenile spondylolysis: a comparative analysis of CT, SPECT and MRI. Skeletal radiology. 2005;34(2):63-73.
5. Williams A, Qian Y, Golla S, et al. UTE-T2* mapping detects sub-clinical meniscus injury after anterior cruciate ligament tear. Osteoarthritis Cartilage. 2012;20(6):486-94.
6. Sotiropoulos S, Chafetz NI, Lang P et al. (1989) Differentiation between postoperative scar and recurrent disk herniation: prospective comparison of MR, CT, and contrast-enhanced CT. AJNR Am J Neuroradiol 10:639-643.
Figures
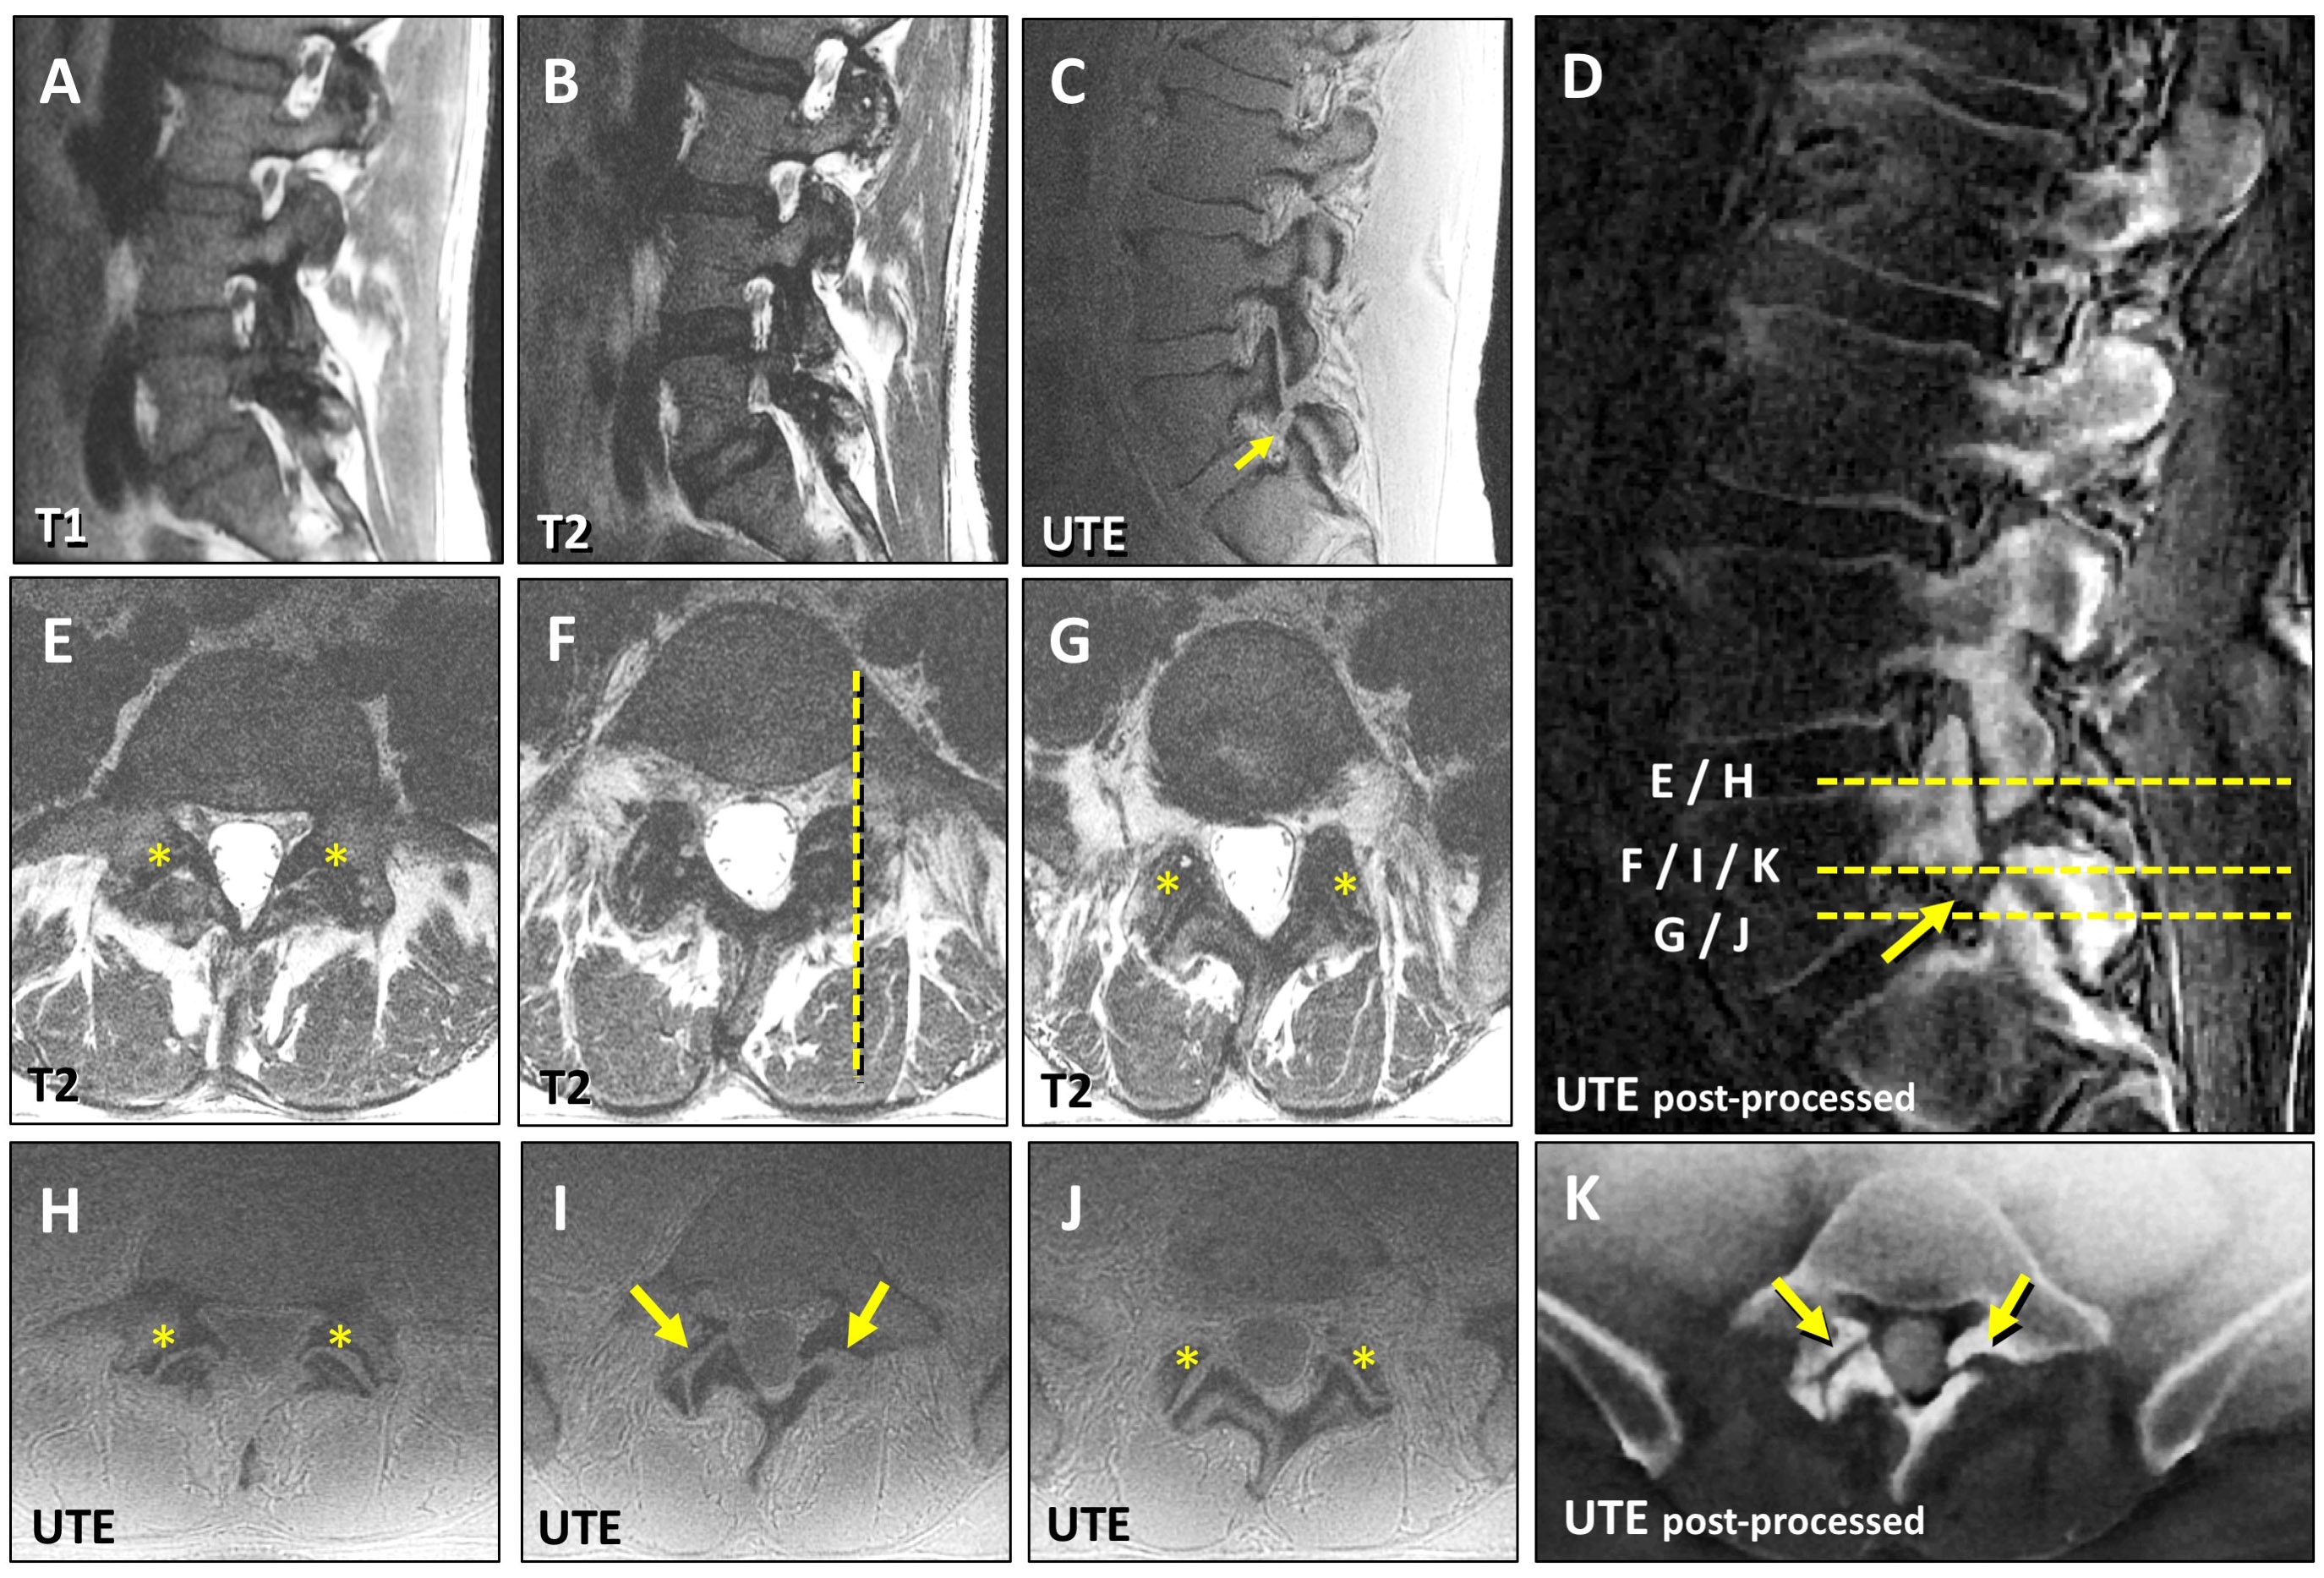
Figure 1. Lumbar MR of a 45-year-old male with bilateral spondylolysis on L5 level.
The standard T1-(A) and T2-(B) images do not demonstrate the left-sided spondylolysis of L5, whereas the UTE-sequence (C) clearly depicts the pars defect. Images (E,H) and (G,J) are corresponding axial slices of the facet joints (asterisks) on L4/5 and L5/S1-levels, respectively. The UTE-images (I,K) clearly show the bilateral pars defects (arrows in I), whereas on the axial T2-image (F) they can easily be mistaken for facet joint degeneration (see reference lines in D). The post-processed UTE-images (D,K) have strikingly resemblance to CT images.
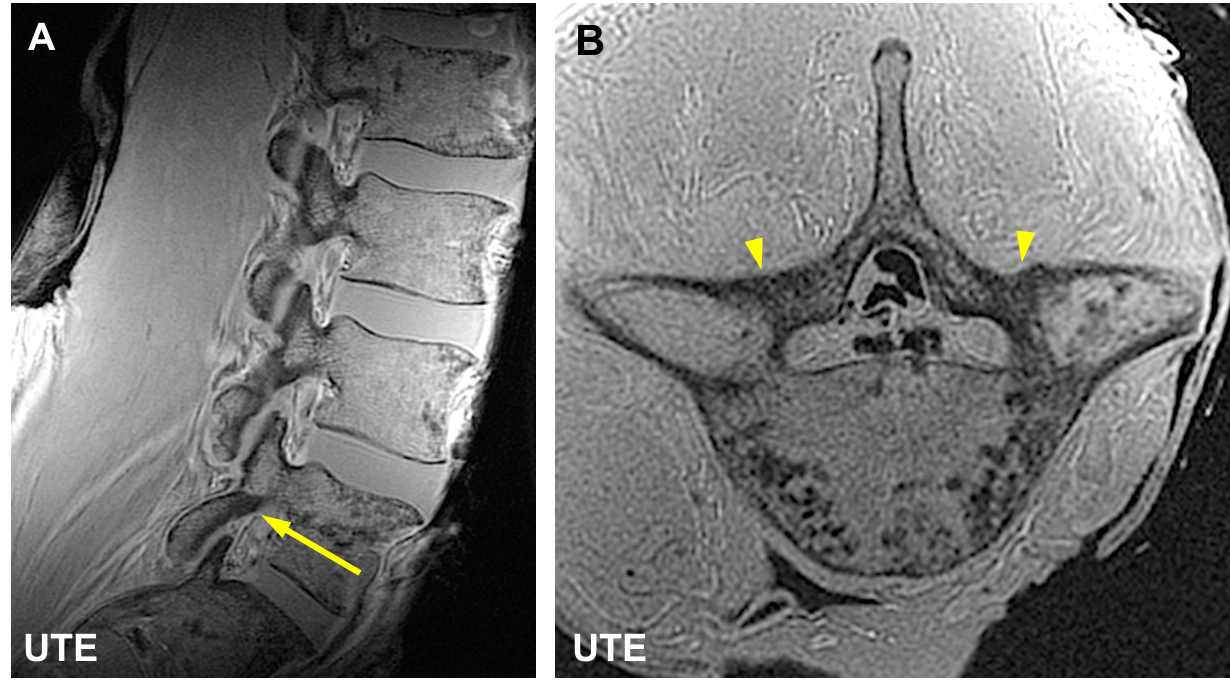
Figure 2. UTE images of a cadaveric lumbar spine without pars defect.
In this ex vivo UTE imaging a higher resolution and longer scanning time than in the in vivo case was used. The intact left-sided pars interarticularis (arrow) is clearly demonstrated on image (A). On the axial image (B) the left and the right pars interarticularis of the vertebral arch are clearly visible (arrowheads). The plane of the axial image (B) corresponds to the orientation of the arrow in image (B).