5172
Evaluation of the therapeutic effect on multiple myeloma patients using IDEAL IQ1Department of Radiology, Beijing Chaoyang Hospital, Beijing, China, 2GE Healthcare China, Beijing, China
Synopsis
Multiple myeloma is the second most common hematologic malignancy which occurs commonly in elderly patients. The alteration of bone marrow microenvironment caused by multiple myeloma may lead to the change of fat content and T2* of the bone. IDEAL IQ is a technique which can simultaneously and quantitatively calculate the fat fraction and R2* value of given tissues. The purpose of this study is to investigate the prognostic value of IDEAL IQ technique for the Blood treatment under M protein test on multiple myeloma.
Introduction
Multiple myeloma is the second most common hematologic malignancy which occurs commonly in elderly patients [1]. In multiple myeloma, the interaction between malignant plasma cells and nonmalignant stromal cells causes several alterations in the microenvironment of bone marrow that are pivotal for the pathogenesis of the disease [2]. The alteration of bone marrow microenvironment may lead to the change of fat content and T2* of the bone. IDEAL IQ is a technique which can simultaneously and quantitatively calculate the fat fraction and R2* value of given tissues [3]. The purpose of this study is to investigate the prognostic value of IDEAL IQ technique for the Blood treatment under M protein test on multiple myeloma.Methods
In all, eight patients with twenty-two lesions were enrolled in this study. Besides routine MR examination, the IDEAL IQ sequence was scanned before and after the Blood treatment for every patient on a 3.0 T MR scanner. Both pixel-wised fat fraction and R2* maps were computed. Then, for each lesion, the region of interest (ROI) was placed on the fixed area of the normal bone marrow adjacent to the maximal level of the lesion. Before and after treatment, the difference between the computed parameters were assessed using a paired t-test. In addition, the IDEAL IQ obtained parameters, fat fraction and R2* value, were correlated with the myeloma corresponding M-protein content using Spearman correlation.Results
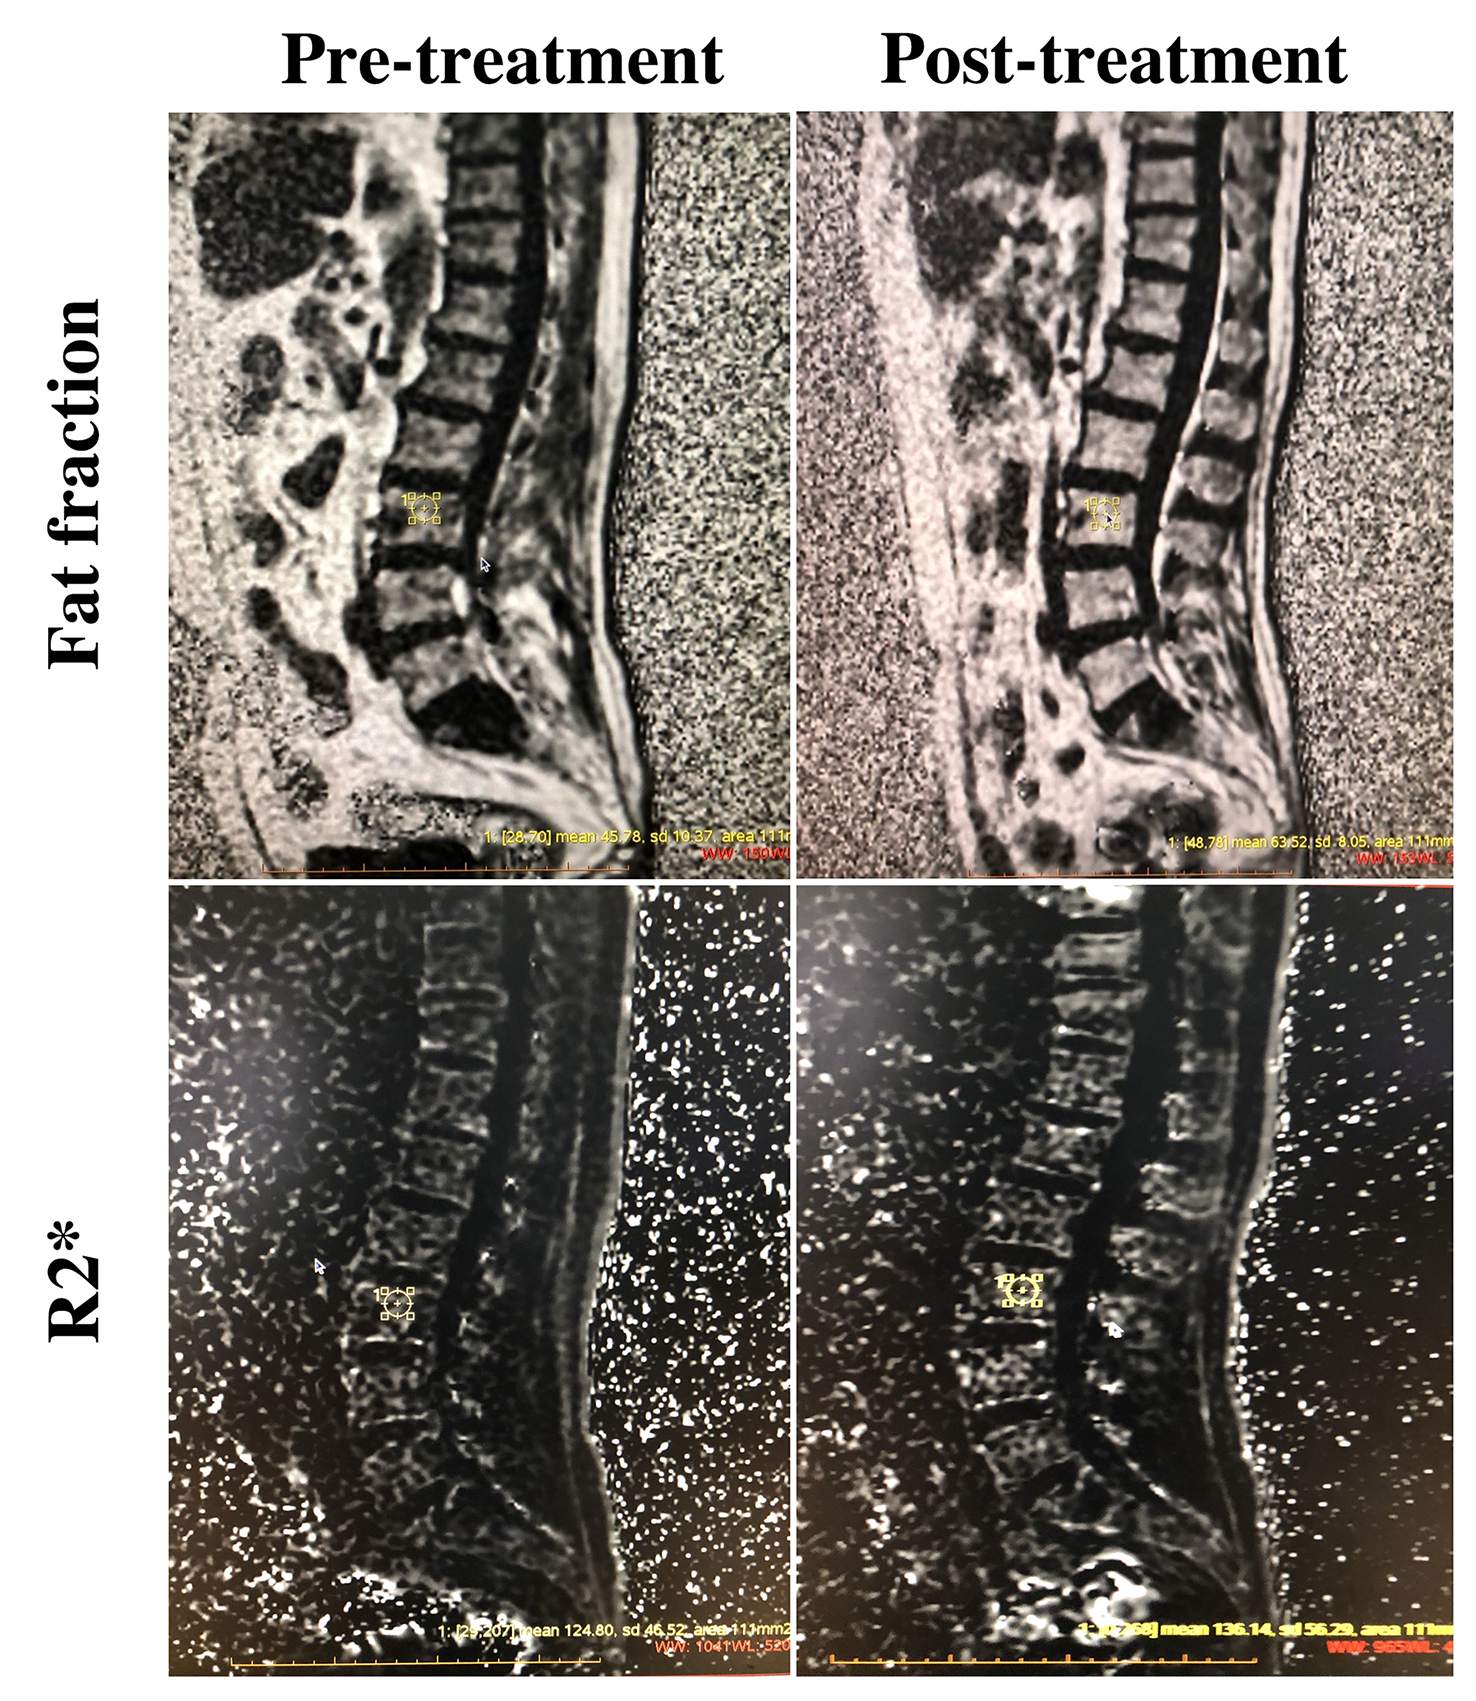
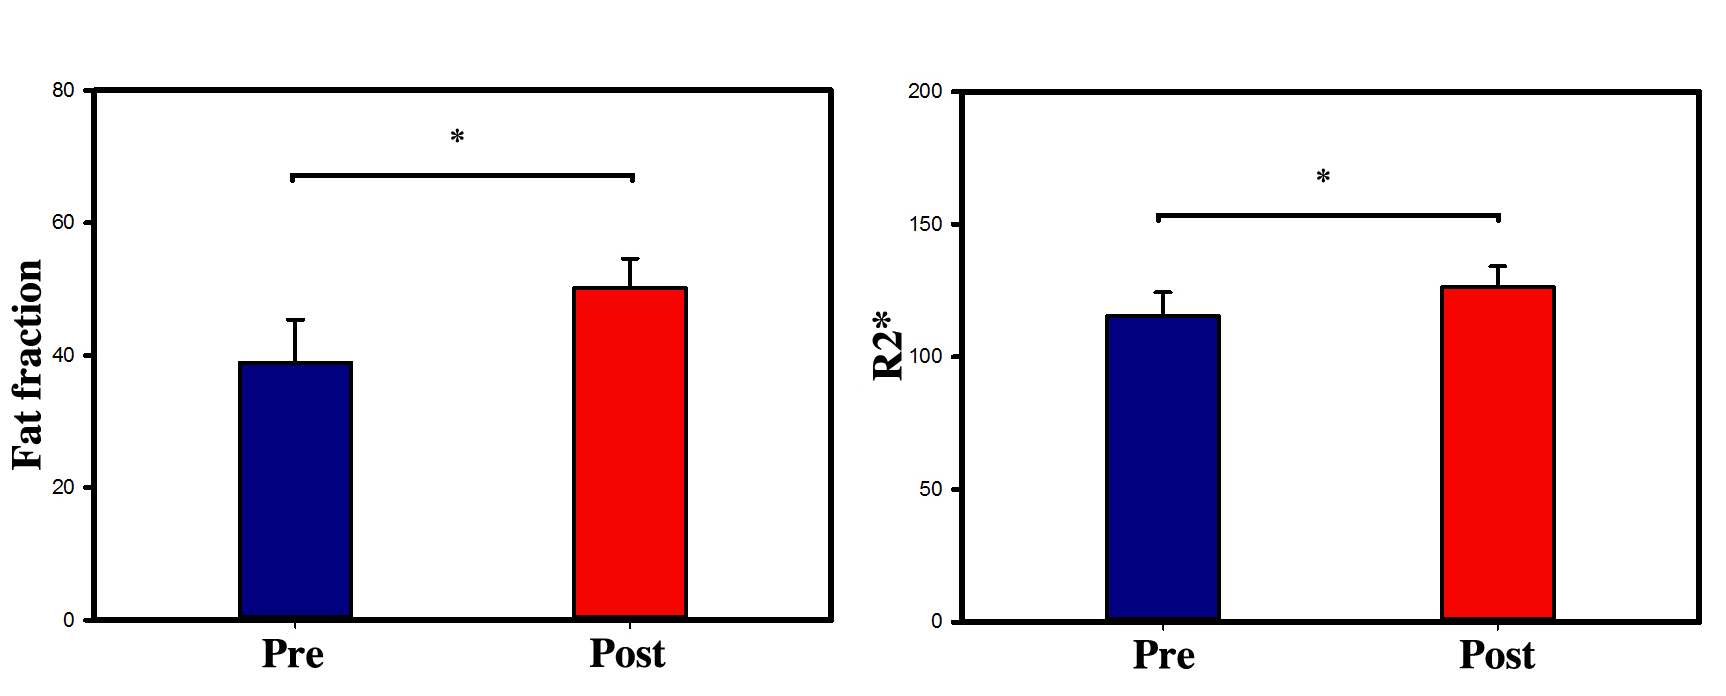
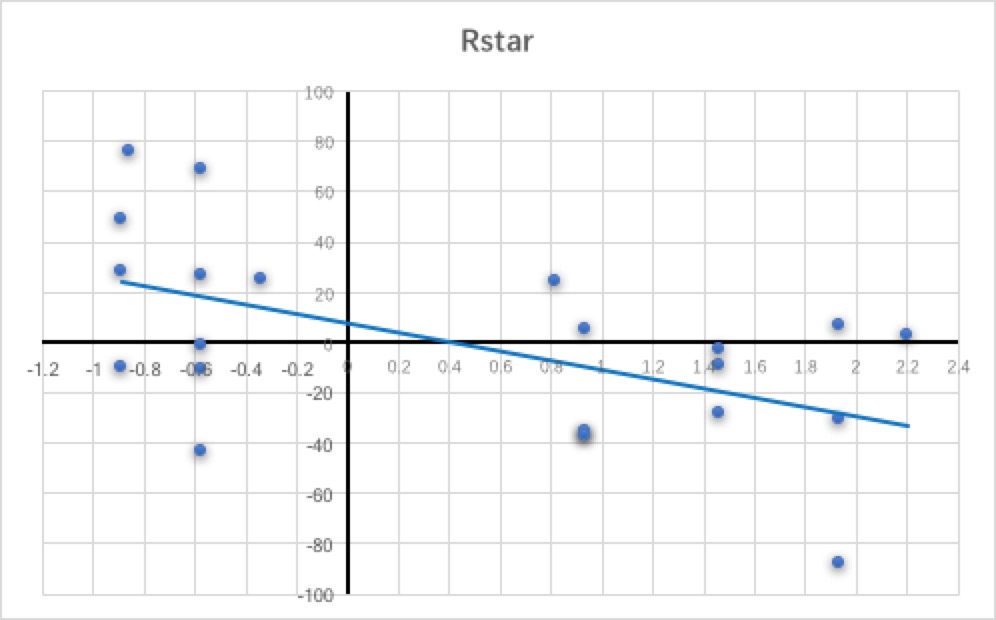
The IDEAL IQ obtained fat fraction and R2* map for a typical subject were shown in Fig. 1. Both before and after treatment were demonstrated. It can be seen that the fat fraction value was significantly increased after treatment. And the R2* values was increased after the Blood treatment as well. Statistically, results of differences in fat fraction before and after the Blood treatment was shown in Fig. 2. Significant differences existed for IDEAL IQ derived parameters, fat fraction and R2*, between before and after the blood treatment (p = 0.035 and p = 0.041, respectively). The R2* value was significant negatively correlated with the content of M-Protein (r = -0.457, p = 0.033, see Fig. 3), while no significant correlation was found between fat fraction and the content of M-protein.Discussion and Conclusions
Significant pre- and post-treatment differences were found for IDEAL IQ obtained fat fraction and R2* parameters. Clinically, after Blood treatment, with the reduction of plasma cells, bone marrow fat content increased and reduced fibrosis. And significant correlation between R2* and the content of M-protein was found. As a result, the IDEAL IQ technique may offer help to evaluate the treatment efficiency for myeloma patient.Acknowledgements
No acknowledgement found.References
[1] Caers, Jo, et al. "The role of positron emission tomography-computed tomography and magnetic resonance imaging in diagnosis and follow up of multiple myeloma." Haematologica 99.4 (2014): 629-637.
[2] Merz, Maximilian, et al. "Dynamic contrast-enhanced magnetic resonance imaging for assessment of antiangiogenic treatment effects in multiple myeloma." Clinical Cancer Research 21.1 (2015): 106-112.
[3] Yu H, Shimakawa A, McKenzie C A, et al. Multiecho water‐fat separation and simultaneous R 2* estimation with multifrequency fat spectrum modeling[J]. Magnetic resonance in medicine, 2008, 60(5): 1122-1134.
Figures