5170
Texture Analysis of Apparent Diffusion Coefficient (ADC) Maps of Vertebral Bone Marrow in Patients with Multiple Myeloma: Correlation with Clinical Parameters and the Revised International Staging SystemQin Wang1, Huadan Xue1, Tianyi Qian2, Alto Stemmer3, Shuo Li1, Zhaoyong Sun1, and Zhengyu Jin1
1Radiology, Peking Union Medical College Hospital, Beijing, China, 2Siemens Healthcare, MR Collaboration NE Asia, Beijing, China, 3Siemens Healthcare, Application Development, Erlangen, Germany
Synopsis
This study aimed to correlate textural parameters derived from apparent diffusion coefficient (ADC) maps of bone marrow to clinical parameters and the revised international staging system (R-ISS) in patients with multiple myeloma (MM). Sixty-one patients with MM underwent whole-body DWI. Texture analysis of ADC maps on vertebral bodies extracted five parameters, including mean, standard deviation, entropy, skewness and kurtosis. These parameters were significantly correlated with clinical parameters of disease burden. Entropy showed the highest diagnostic capacity for discriminating R-ISS stage III from stage I/II. ADC-based textural parameters may serve as adjunct tools for detecting MM patients with advanced R-ISS stages.
Purpose
The purpose of our study was to correlate textural parameters derived from apparent diffusion coefficient (ADC) maps of vertebral bone marrow to clinical parameters and the revised international staging system (R-ISS) in patients with newly-diagnosed multiple myeloma (MM).Methods
A total of 61 consecutive patients with newly-diagnosed MM were recruited prospectively and underwent whole-body diffusion-weighted imaging (WB-DWI) on a MAGNETOM Skyra 3T MR scanner (Siemens Healthcare, Erlangen, Germany). The WB-DWI images were acquired using a prototypic integrated slice-by-slice shimming (iShim) technique1 with the following sequence parameters: axial, 2D, TR/TE = 7920/60 ms, in-plane FOV = 430×296 mm2, GRAPPA = 2, number of slices per bed position = 35, slice thickness = 5 mm, gap between slices = 0 mm, voxel size = 3.4×3.4×5 mm3, number of bed positions = 5 – 6 (covering from head to thigh), fat suppression with slice-selective inversion recovery, b values = 50 and 800 s/mm2 and monopolar with dynamic field correction. Texture analysis of the ADC maps on the vertebral bodies was performed using commercially available TexRAD research software (TexRAD Ltd., Cambridge, UK) by manually delineating a round region of interest (ROI) covering the middle cross-sectional area of the vertebra. Vertebrae with focal lesions or compression fractures were excluded. The software extracts textural features through the quantification of histogram using five parameters: mean (average pixel values), standard-deviation (SD, degree of variation of pixel values), entropy (irregularity of gray-level distribution), skewness (asymmetry of the histogram), and kurtosis (peakedness of the histogram). The mean values of the vertebral ADC-based textural parameters of each patient were recorded (up to six vertebrae evaluated per patient). A standard clinical assessment was performed, including the collection of serological markers (hemoglobin, LDH, serum calcium, creatinine, and β2- microglobulin) and a bone marrow examination (percentage of plasma cells [BMPC%] and fluorescence in situ hybridization [FISH] studies). The patients were clinically staged according to R-ISS. ADC-based textural parameters were correlated to the clinical parameters using the Spearman rank correlation test. To discriminate the R-ISS stage III from stage I/II, an ROC analysis of the ADC-based textural parameters was performed.Results
Patients at R-ISS stage III had significantly higher mean (P = 0.001), entropy (P = 0.001), kurtosis (P = 0.039), and significantly lower SD (P = 0.046) than those at R-ISS stage I/II (Figure 1). The mean, entropy, kurtosis, and SD were significantly correlated with high-risk chromosomal abnormalities (mean: rs = 0.373, P = 0.004; entropy: rs = 0.394, P = 0.002; kurtosis: rs = 0.257, P = 0.049; and SD: rs = -0.417, P = 0.001) and R-ISS stages (mean: rs = 0.485, P < 0.001; entropy: rs = 0.419, P = 0.001; kurtosis : rs = 0.322, P = 0.011; and SD: rs = 0.339, P = 0.007). There was a significant correlation between the entropy and serum M-protein (rs = -0.370, P = 0.005), and the mean and serum β2-microglobulin (rs = 0.297, P = 0.020). The mean, entropy, and SD were significantly correlated with the BMPC% (mean: rs = 0.403, P = 0.002; entropy: rs = 0.330, P = 0.011; and SD: rs = -0.289, P = 0.026). Among these ADC-based textural parameters, entropy showed the highest area under the ROC curve(AUC) when discriminating R-ISS stage III from stage I/II (AUC=0.784,Sensitivity=93.33%,Specificity=63.04%) , as shown in Table 1.Discussion
MR imaging is considered as the gold standard modality for evaluation of bone marrow infiltration in patients suspected of MM. Compared to conventional MR sequences primarily depicting anatomic information, DWI can provide additional functional information reflecting bone marrow cellularity through the measurement of ADC, which enables quantitative assessment of the disease burden of MM. In previous studies, assessment of the bone marrow ADC primarily focused on the measurement of the mean (or median) value within the selected ROIs. Correlation has been observed between the mean (or median) marrow ADC and bone marrow biopsy or disease activity in myeloma patients. To our knowledge, our study has shown, for the first time, evidence of correlation of the ADC-based textural parameters with established clinical parameters of disease burden and the most up-to-date R-ISS in patients with untreated MM. Because ADC-based textural parameters (particularly entropy) can provide additional information depicting bone marrow heterogeneity without adding any MR sequences or increasing scan time, these parameters may be considered as adjunct tools to the mean (or median) ADC measurement of the bone marrow.Conclusion
ADC-based textural parameters of vertebral bone marrow were significantly correlated with clinical parameters in patients with MM and may serve as quantitative markers for detecting patients at advanced R-ISS stages.Acknowledgements
No acknowledgement found.References
1.Zhang, H., et al., "Integrated Shimming Improves Lesion Detection in Whole-Body Diffusion-Weighted Examinations of Patients With Plasma Disorder at 3 T." Invest Radiol, 2016. 51(5): p. 297-305.Figures
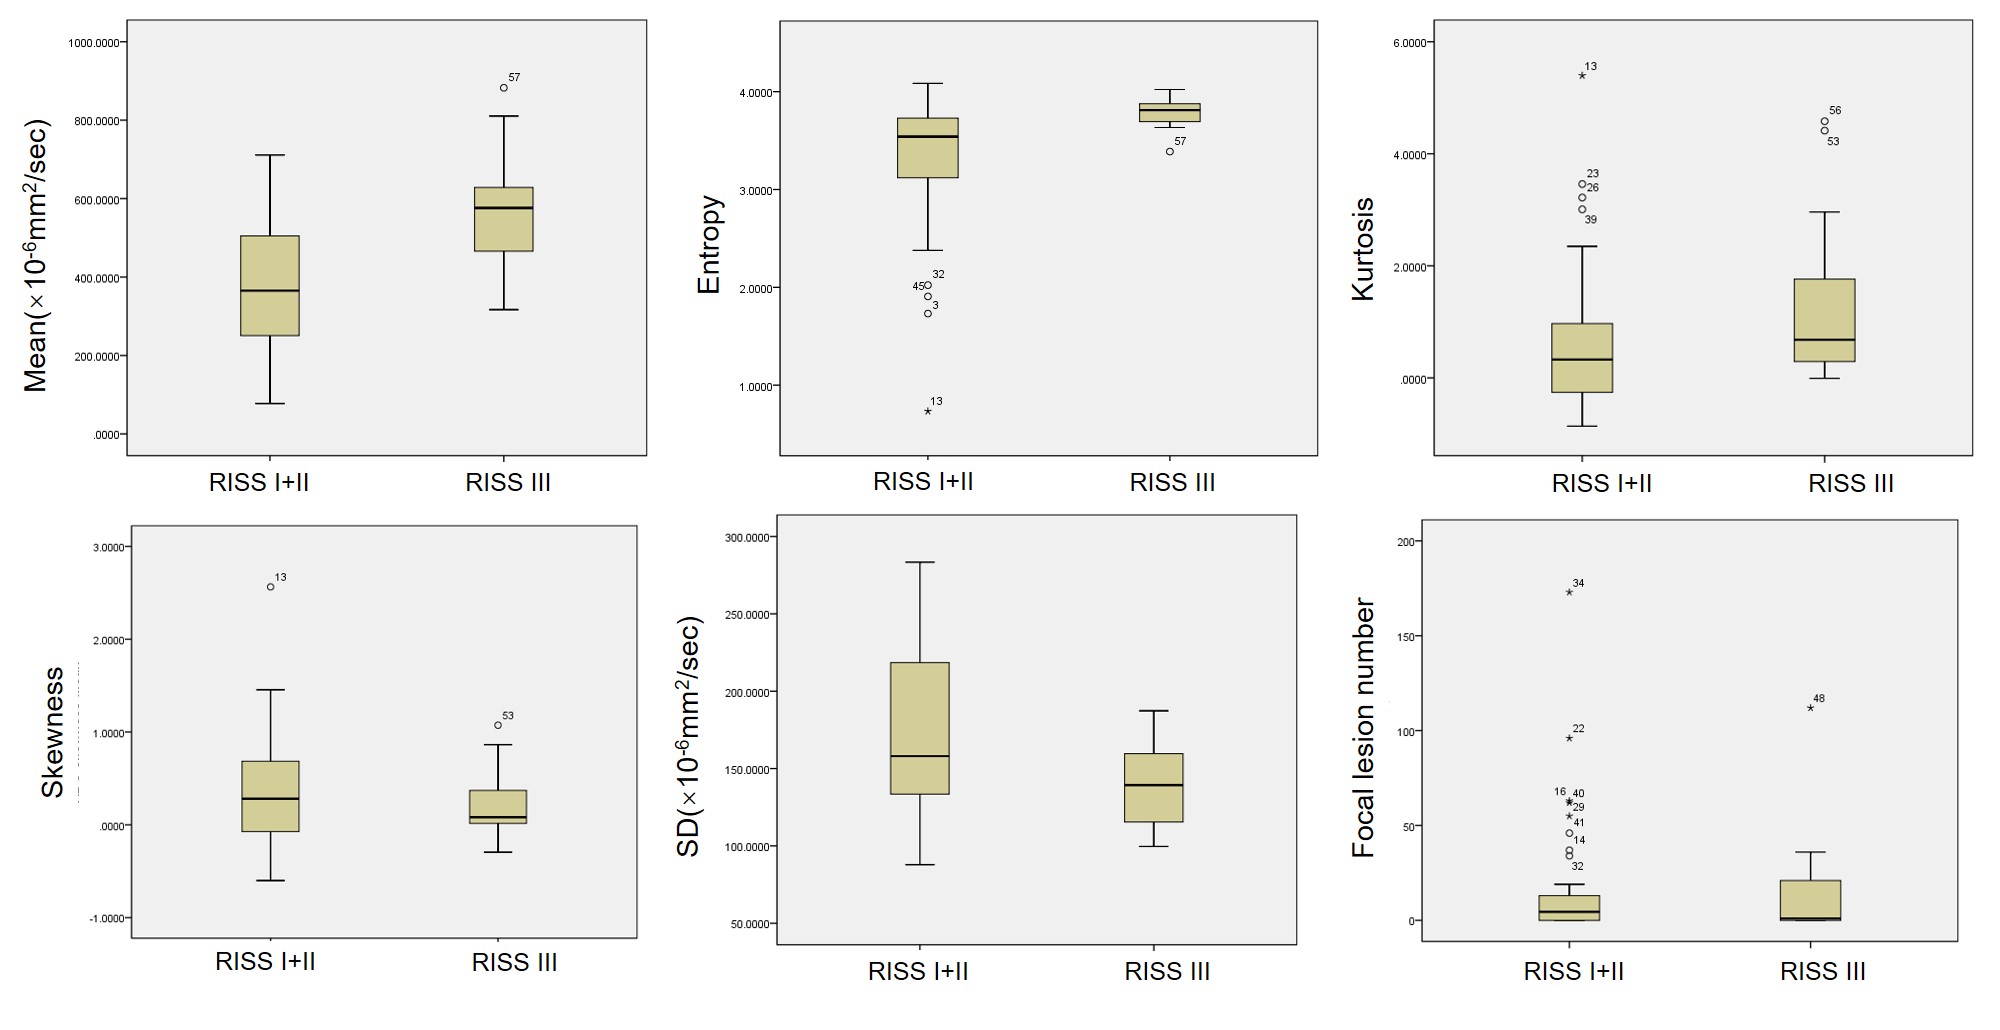
Figure 1. ADC-based textural parameters and focal lesion numbers between
revised international staging system (R-ISS) stage I+II vs III.
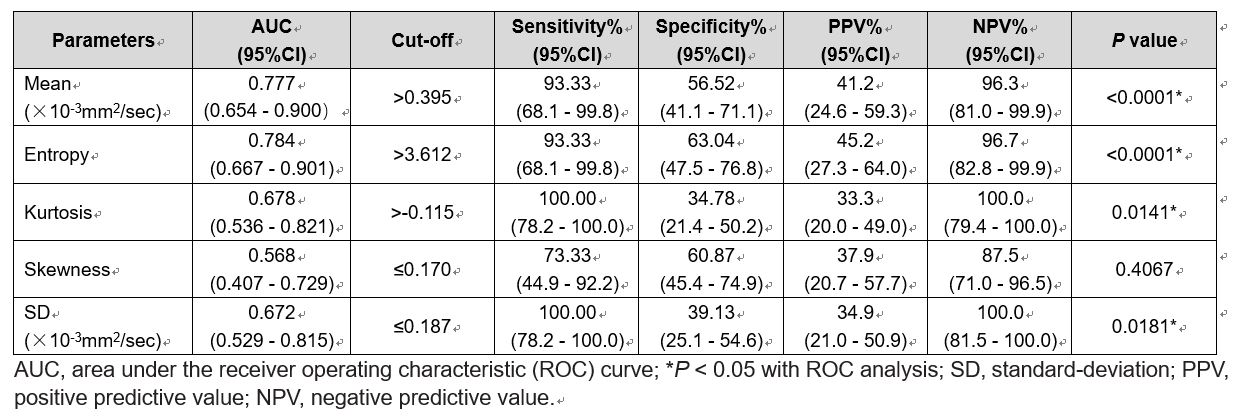
Table 1: ROC analysis of ADC-based textural parameters
for discriminating R-ISS stage III from stage I/II