5169
Texture Analysis Based Separation of Osteosarcoma and Ewing’s Sarcoma using Diffusion Weighted MRI1Centre for Biomedical Engineering, Indian Institute of Technology, Delhi, New Delhi, India, 2Radiodiagnosis, All India Institure of Medical Sciences, New Delhi, New Delhi, India, 3Department of Medical Oncology, IRCH, All India Institure of Medical Sciences, New Delhi, New Delhi, India, 4Department of Biomedical Engineering, All India Institute of Medical Sciences, New Delhi, New Delhi, India
Synopsis
Osteosarcoma(OS) and Ewing’s sarcoma family of tumors(ESFT) are the most common primary malignant bone tumor in children and adolescents. As the patient’s age, presenting signs & symptoms and qualitative imaging features are common in both, there could be a diagnostic dilemma that can only be resolved by biopsy & histopathological assessment. Texture analysis in Diffusion Weighted Imaging(DWI) might provide additional useful information as DWI captures early cellular changes within tumors. We computed textural features in patients with OS and ESFT. Experimental results revealed that textural features provided significant discrimination between OS and ESFT; thus might be useful as diagnostic marker.
Purpose:
Osteosarcoma (OS) and Ewing’s sarcoma family of tumors (ESFT) are the most common primary malignant bone tumor and account for over 90% of all primary bone tumors in children and adolescents1. Early diagnosis and treatment planning of tumors can improve prognosis. Newer functional MRI is much useful than the other imaging modalities in detecting bone tumors and can help narrow the differential diagnosis2. However, as the patient’s age, presenting signs & symptoms and qualitative imaging features are common in both the tumors, there could be a diagnostic dilemma that can only be resolved by invasive biopsy & histopathological assessment3. In medical image analysis, Texture analysis (TA), a mathematical approach to characterize the spatial distribution of signal intensity variations in an image, has shown promising results in diagnosis and prognosis4,5. OS and ESFT are intrinsically different tumors thus, identifying the textural features is important as might help in diagnosis and monitoring therapeutic responses to chemotherapy. This study was aimed to perform DWI based texture analysis and evaluate quantitative texture parameters that may help to distinguish between OS and ESFT.Methods:
DWI dataset for total ten patients (n=10): five patients with Osteosarcoma (n=5; Age=17.6±2.3yrs) and five with ESFT (n=5; Age=25.6±8.8yrs), were acquired under the Institutional Review Board approved protocol. Acquisition was performed on 1.5T Philips Achieva MRI scanner with Spin Echo-Echo Planar imaging sequence with TE/TR=66/1782msec, slice-thickness/gap=5/0.5mm, matrix-size=192x192. Images with b=800s/mm2 were used for texture analysis.
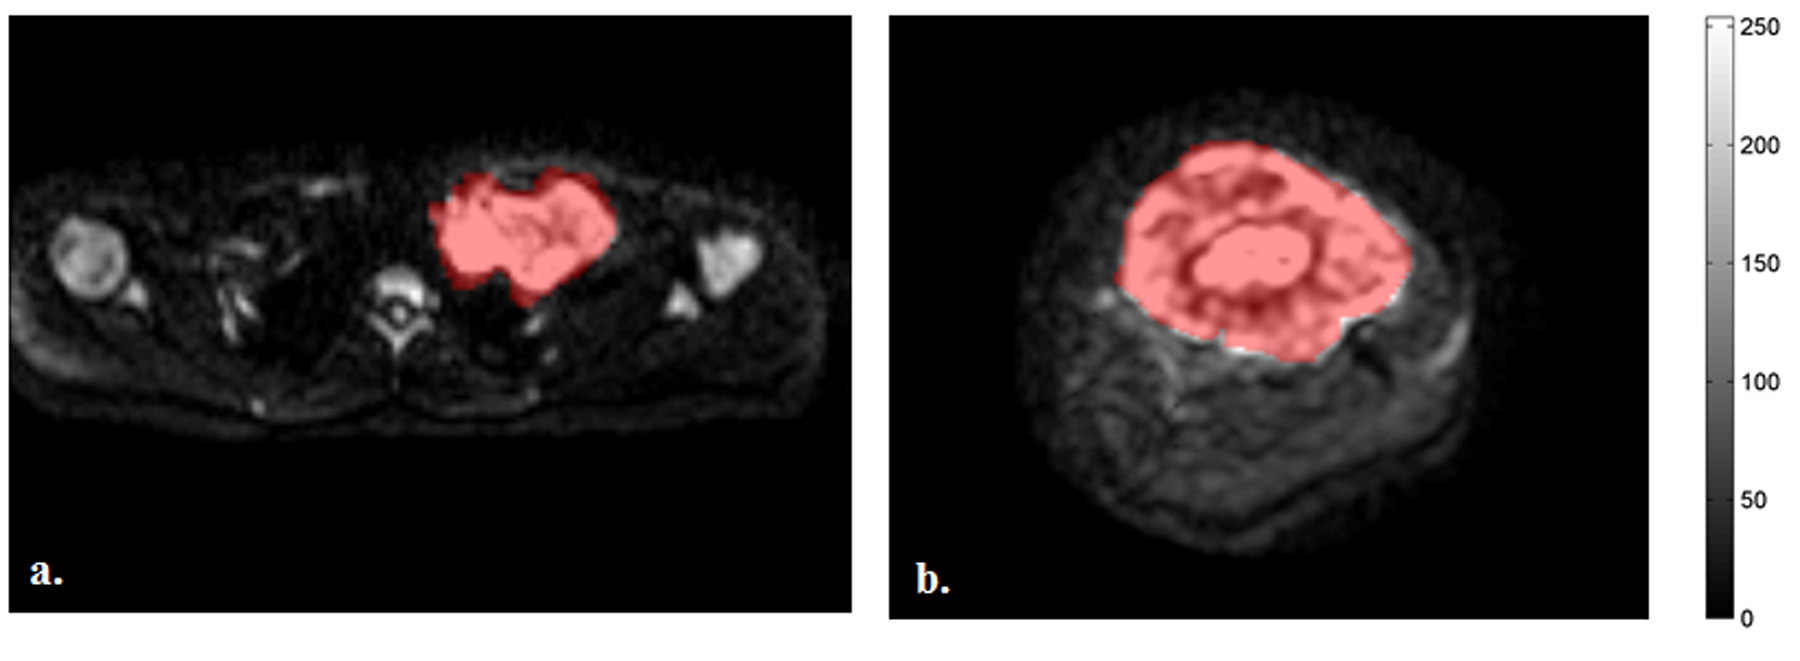
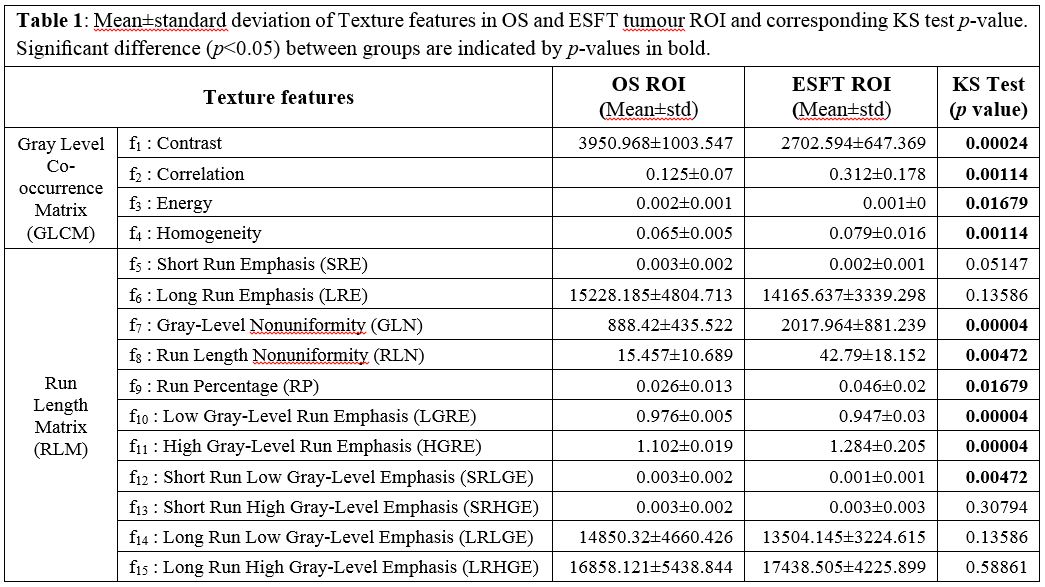
Region of interest (ROI) for tumor was demarcated manually by a radiologist (>9 years of experience), on three axial slices (taken from the center of the tumor having the maximum tumor burden) for each patient and used for texture analysis to reduce measurement bias. DWI slices of two representative patients with ESFT and OS with ROIs drawn for tumor are depicted in Fig.1a&b respectively. For texture analysis, 16 bit (65536 gray-levels) ROI data set were normalized to 8 bit (256 gray-levels), reducing computational complexity and improving signal-to-noise ratio. Total fifteen Textural features (elaborated in Table1) were extracted from tumor ROIs using Grey Level Co-occurrence Matrix (GLCM)4 giving 4 features (f1-f4) and Run Length Matrix (RLM)5 giving 11 features (f5-f15) for each patient. GLCMs that contain the joint probability of two adjacent voxels were calculated in four directions (00,450,1350&1800) at voxel co-occurrence distance of 5 and subsequently averaged out. RLMs that contain the probability of run lengths (number of consecutive, collinear voxels having same gray level) of present gray levels were also calculated in similar four directions as GLCM and averaged out. Non-parametric two-sampled Kolmogorov–Smirnov (KS) test was performed on texture features in OS and ESFT with p<0.05 for statistical significance. ROC curve analysis was performed to measure the performance of textural features in discriminating OS and ESFT. Textural feature calculation and statistical analysis were performed using an in-house built toolbox in MATLAB and SPSSv.15.0 software respectively.
Results:
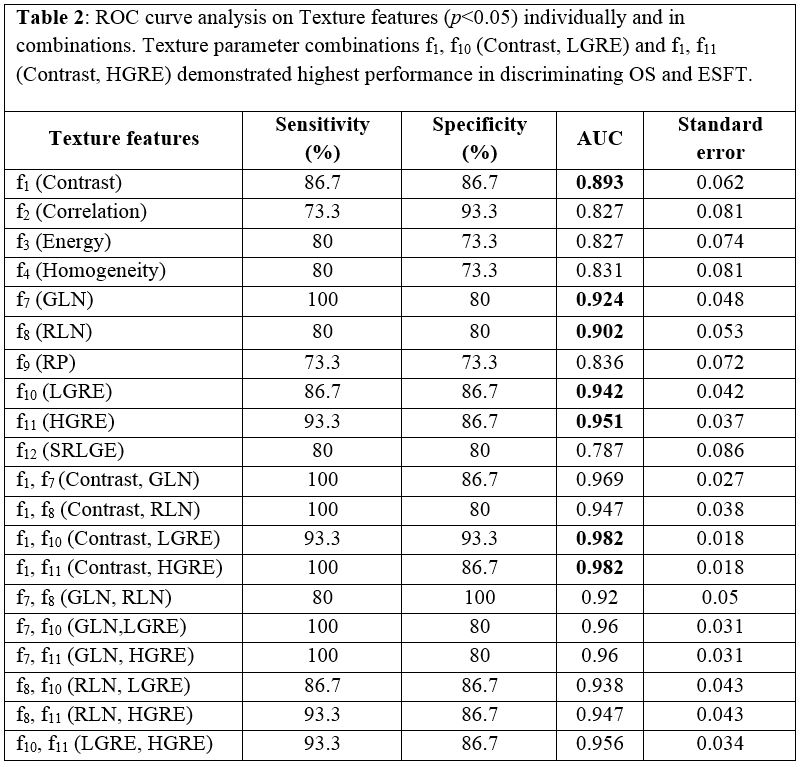
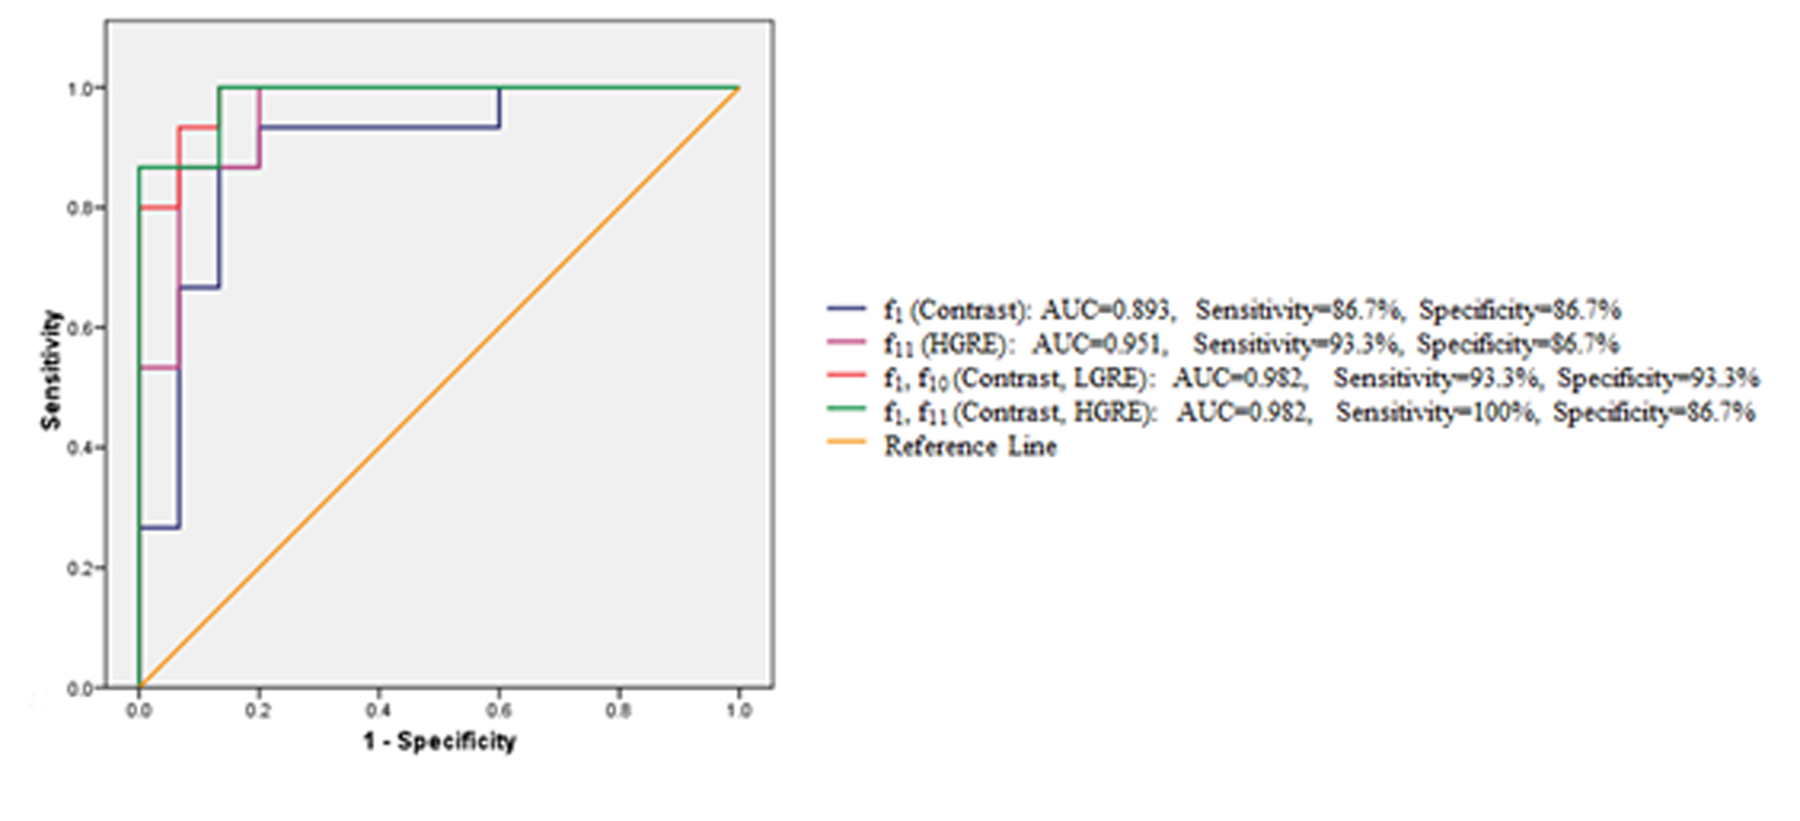
Normalized mean signal intensities in ESFT and OS ROIs were observed as 114.29±21.51 and 117.47±16.85 respectively (p=0.5886). Table1 shows the mean±standard deviation and p-values for all texture features used individually to distinguish between OS and ESFT. All four GLCM features f1-f4, and six RLM features f7-f12 demonstrated significant (p<0.05) discrimination among the groups. ROC curve analysis for these 10 features individually and in combinations is represented in Table2. Among GLCM features, contrast (AUC=0.893, cutoff-value=3219.3358, 86.7% sensitivity and specificity for both) and among RLM features, HGRE (AUC=0.951, cutoff-value=1.1218,) sensitivity=93.3% & specificity=86.7%) achieved highest performance in classifying OS and ESFT (Figure2). Combination of texture features contrast & LGRE (sensitivity and specificity both 93.3%) and contrast & HGRE (100% sensitivity and 86.7% specificity) produced highest AUC=0.982 among all feature combinations studied in distinguishing OS and ESFT (Figure2).Discussion:
GLCM feature contrast measures the local variance and homogeneity measures the smoothness in the image. A comparative higher mean contrast (OS: 3950.968±1003.547; ESFT: 2702.594±647.3690) and lower mean homogeneity (OS: 0.065±0.0050; ESFT: 0.079±0.0160) in OS & ESFT ROIs indicate high local inhomogeneous environment in the tumors. Whereas, RLM features GLN&RLN, emphasizing non-uniformity of intensity levels in image, found higher in ESFT than OS. Features f10-f15 emphasize the joint distribution properties of both run lengths and gray levels. Among them LGRE, HGRE were found more robust in discriminating two groups and might be useful marker in monitoring treatment that needs to be further evaluated. Higher sensitivity/specificity observed (~100%) might be artifactual due to small sample size, this could be well understood only with bigger dataset.Conclusion:
Textural features using from DWI might provide additional information compared to qualitative medical image features and be used as diagnostic and prognostic marker for radiological evaluations.Acknowledgements
Authors would like to thank the Government of India for the funding support required for the study. EBK was supported with the research fellowship funds from Ministry of Human Resource Development, Government of India.References
- Drapé JL. Orthopaedics & Traumatology: Surgery & Research (2013) 99S, S115—S123.
- Costa FM. et al. MagnReson Imaging Clin N Am 19 (2011) 159–180.
- Kansal R. et al. Sch. J. App. Med. Sci., 2014; 2(5E):1817-1820.
- Haralick, R.M. et al. IEEE Trans. Syst., Man, Cybern., vol. SMC-3, pp. 610–621, 1973.
- Dasarathy B. V. et al. Pattern Recognition Letters 1991; 12: 497-502.
Figures