5168
Differentiation of Pulmonary From Non-Pulmonary Spine Metastases Using Conventional DCE Kinetic Analysis and Machine LearningNing Lang1, Yang Zhang2, Enlong Zhang1, Jiahui Zhang1, Daniel Chow2, Peter Chang3, Melissa Khy2, Hon J. Yu2, Huishu Yuan1, and Min-Ying Su2
1Department of Radiology, Peking University Third Hospital, Beijing, China, 2Department of Radiological Sciences, University of California, Irvine, CA, United States, 3Department of Radiology, University of California, San Francisco, CA, United States
Synopsis
DCE-MRI of the spine was analyzed to differentiate metastasis from lung cancer (N=30) and other tumors (N=31, 9 breast, 6 prostate, 7 thyroid, 6 liver, 3 kidney). Using DCE parameters measured from the tumor ROI, CHAID decision tree classification selected the wash-out slope of -6.6% and wash-in SE of 98% as thresholds, which could achieve diagnostic accuracy of 0.79. In machine learning, the enhanced tumor on DCE image was segmented automatically by using the normalized cut algorithm. The Convolutional Long Short Term Memory (CLSTM) network with all 12 sets of DCE images as the input could yield accuracy of 0.75-0.84.
Introduction:
Patients presenting with pain in the spine are suspected to have lesions compressing the spinal cord, and often recommended to receive MRI for diagnosis. For patients who do not have a known disease, a correct diagnosis will be very helpful for guiding subsequent workup procedures. The most common malignancy in the spine is metastatic cancer [1-2]. For patients who have been diagnosed with cancer before, spinal pain could be a sign of metastasis. For patients without known cancer, if the origin of cancer in the spine can be accurately predicted, it will help narrow the search and decide the most appropriate imaging examinations to find the primary cancer without the need of performing the challenging spinal biopsy. Among all patients with unknown primary in our institute, lung cancer is the most common, and thus the purpose of this study is to differentiate lung metastasis from other tumors in the spine. It has been shown that DCE-MRI may provide additional information to further characterize the detected lesion [3-4]. In this study, firstly the DCE parameters analyzed from manually-placed ROI were used for diagnosis, and secondly machine learning using the entire DCE imaging sequence was performed to investigate whether this provides an efficient method to thoroughly analyze all imaging features for a correct diagnosis.Methods:
In a retrospective review of spinal MRI that included a DCE sequence, a total of 61 patients with confirmed osseous spinal metastases originating from a known primary tumor were identified. There were 30 patients with lung cancer (mean age 56), 9 with breast cancer (mean age 54), 6 with prostate cancer (mean age 72), 7 with thyroid cancer (mean age 50), 6 with liver cancer (mean age 52), and 3 with kidney cancer (mean age 65). MR scans were performed on a 3T Siemens or GE scanner with a consistent protocol. After the abnormal region was identified on Sagittal view, DCE-MRI was performed using the 3D VIBE sequence on the Axial view, with a total of 12 time frames and a temporal resolution of 12-16 seconds. The contrast agent, 0.1 [mmol/kg] Gd-DTPA, was injected after one set of pre-contrast images were acquired. For each case, a region of interest (ROI) was manually placed on an area that showed the strongest enhancement, and the signal intensity time course was measured. Figure 1 shows two case examples, one from lung the other from thyroid cancer. Three heuristic parameters were measured: the maximum signal enhancement (SE) = [(Smax-S0)/S0] x 100%; the steepest wash-in SE [(S2-S1)/S0] x 100% (S1 and S2 were two adjacent time points that showed the greatest signal enhancement); the wash-out slope [(Slast-Speak)/Speak x 100%], or if no peak using the signal intensity at 67 seconds as the reference [(Slast-S67s)/S67s x 100%]. The Chi-square Automatic Interaction Detector (CHAID) decision tree classification method was applied to make diagnosis. The two compartmental pharmacokinetic analysis was applied to obtain the in-flux transport constant Ktrans and the out-flux rate constant kep ([1/min]). In addition, a convolutional long short term memory (CLSTM) network was also applied for diagnosis. For analysis, tumor boundaries were first segmented manually on sagittal T2W images and subsequently refined using a normalized cut algorithm with region growing. Detailed methods are illustrated in Figure 2. The resulting smallest bounding box containing tumor was used as input into the CLSTM. Figure 3 shows the architecture, the convolutional long short term memory (CLSTM) network [5-8]. Normalization of DCE images was performed using a uniform scale[PC1] . To avoid overfitting, the dataset was augmented by a random affine transformation. The algorithm was implemented with a standard cross entropy loss function and the Adam optimizer with an initial learning rate of 0.001 [6]. [PC1]What does this mean? Scale each image so that the min/max intensity value is the same?Results:
Table 1 summarizes the 5 characteristic DCE parameters measured from the manually placed ROI. The wash-out slope and kep showed a significance difference between lung cancer and other tumors. The mean wash-out slope was 0.25% in lung cancer, indicating most lung cancer showed a plateau DCE kinetic pattern. The mean wash-out slope was -9.8% for other tumors, indicating that most of them showed the wash-out DCE kinetic pattern. The breast (-12.9%) and thyroid (-15.6%) cancers had the most prominent wash-out. The accuracy achieved by the CHAID decision tree classification using washout slope followed by wash-in SE% was 0.79 (Figure 4). The accuracy achieved by the CLSTM network on 10-fold cross-validation was 0.75-0.84, overall better than ROI-based CHAID decision tree analysis.Conclusions:
Our results show that the DCE kinetic measure of wash-out slope (kep) is the best parameter to differentiate primary lung from non-pulmonary osseous spinal metastatic disease. A CHAID decision tree using wash-out and wash-in derived from a small tumor ROI can achieve an accuracy of 0.79. By comparison, a CLSTM using the entire tumor as an input can achieve a higher accuracy of up to 0.84. These DCE analysis methods may provide vascular information not only for diagnosis, but also for predicting prognosis.Acknowledgements
This study is supported in part by NIH R01 CA127927, the National Natural Science Foundation of China (81701648, 81471634), and the Beijing Natural Science Foundation (7164309).References
[1] Sciubba DM, Petteys RJ, Dekutoski MB, et al. Diagnosis and management of metastatic spine disease. J Neurosurg Spine 2010;13(1):94–108. [2] Molina CA, Gokaslan ZL, Sciubba DM. Diagnosis and management of metastatic cervical spine tumors. Orthop Clin North Am. 2012;43(1):75-87. [3] Khadem NR, Karimi S, Peck KK, et al. Characterizing hypervascular and hypovascular metastases and normal bone marrow of the spine using dynamic contrast-enhanced MR imaging. AJNR Am J Neuroradiol 2012; 33:2178–2185. [4] Lang N, Yuan H, Yu HJ, Su MY. Diagnosis of Spinal Lesions Using Heuristic and Pharmacokinetic Parameters Measured by Dynamic Contrast-Enhanced MRI. Acad Radiol. 2017;24(7):867-875. [5] Xingjian SH, Chen Z, Wang H, Yeung DY, Wong WK, Woo WC. Convolutional LSTM network: A machine learning approach for precipitation nowcasting. In Advances in neural information processing systems 2015 (pp. 802-810). [6] Kingma D, Ba J. Adam: A method for stochastic optimization. arXiv preprint arXiv:1412.6980. 2014 Dec 22. [7] Nair V, Hinton GE. Rectified linear units improve restricted boltzmann machines. In Proceedings of the 27th international conference on machine learning (ICML-10) 2010 (pp. 807-814). [8] Srivastava N, Hinton GE, Krizhevsky A, Sutskever I, Salakhutdinov R. Dropout: a simple way to prevent neural networks from overfitting. Journal of machine learning research. 2014 Jan 1;15(1):1929-58.Figures
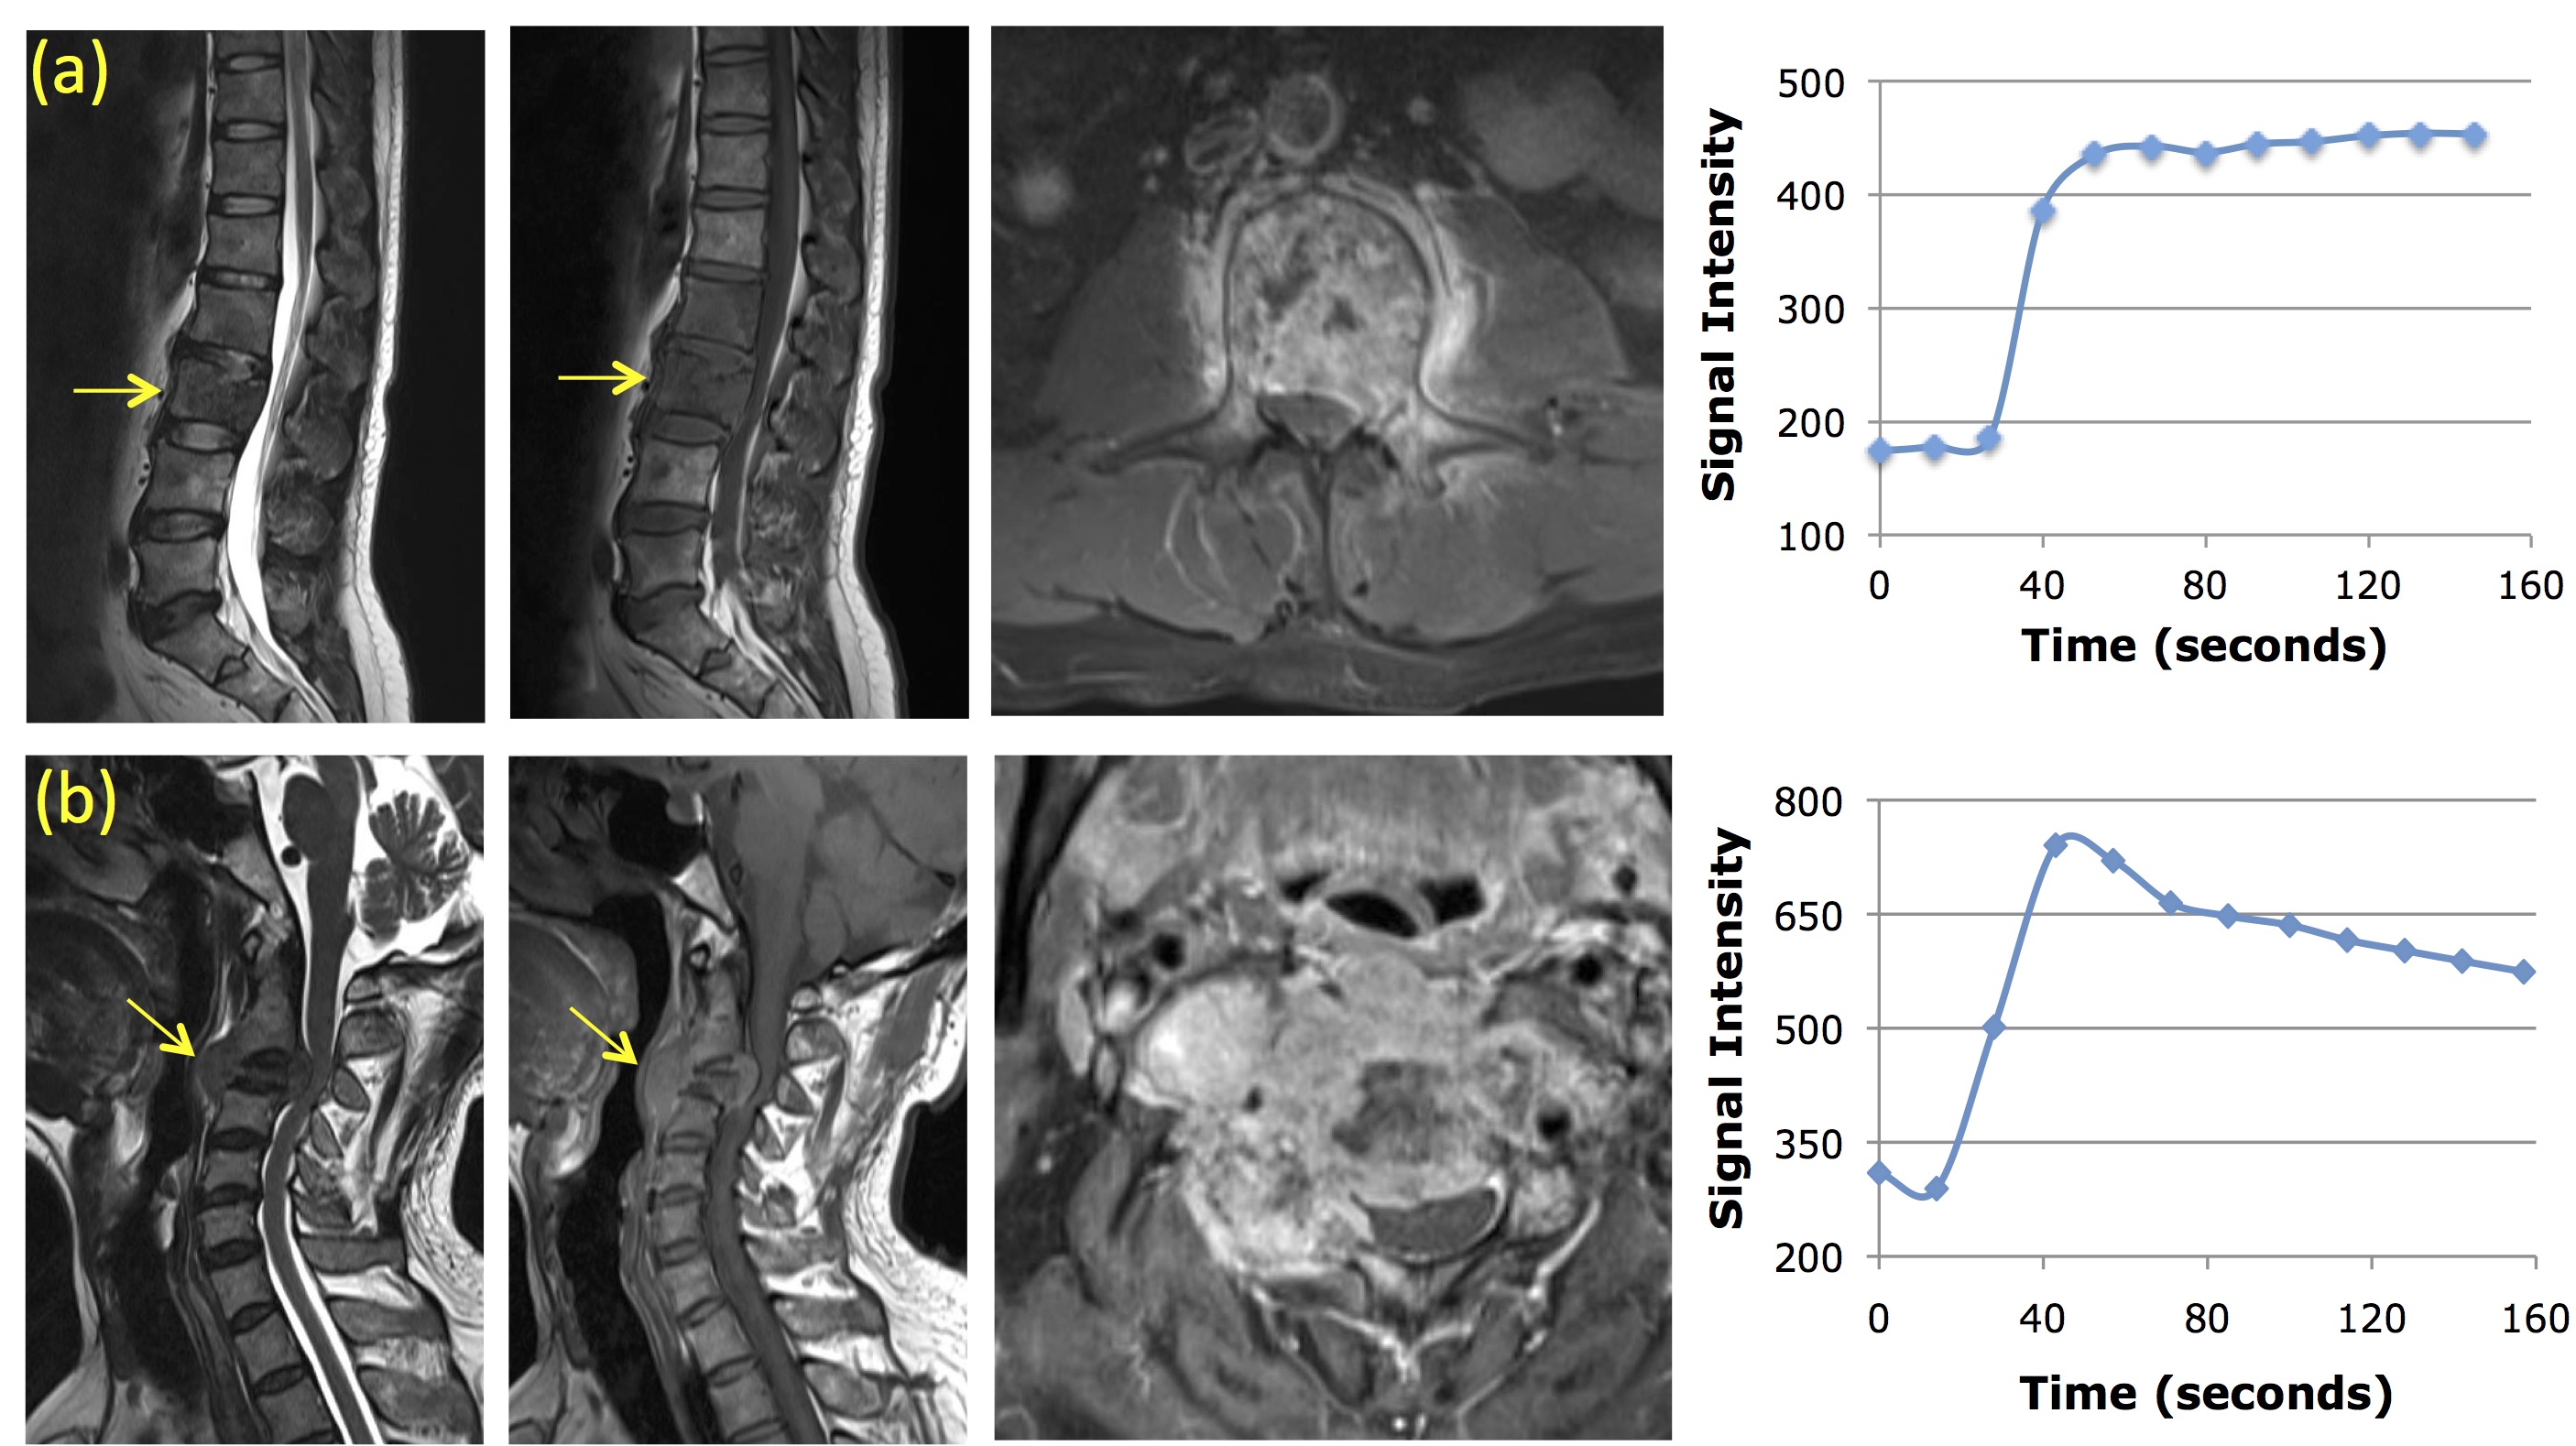
Figure
1: Two case examples. From left to right: the sagittal
T2-weighted, T1-weighted, axial contrast-enhanced images, and the signal
intensity time course measured from a region of interest placed on the
strongest enhancement area. Top panel: (a) A 45-year-old man with metastatic
lung cancer, showing the plateau DCE kinetic pattern. Bottom panel: (b) A
55-year-old man with metastatic thyroid cancer, showing the wash-out DCE
kinetic pattern.
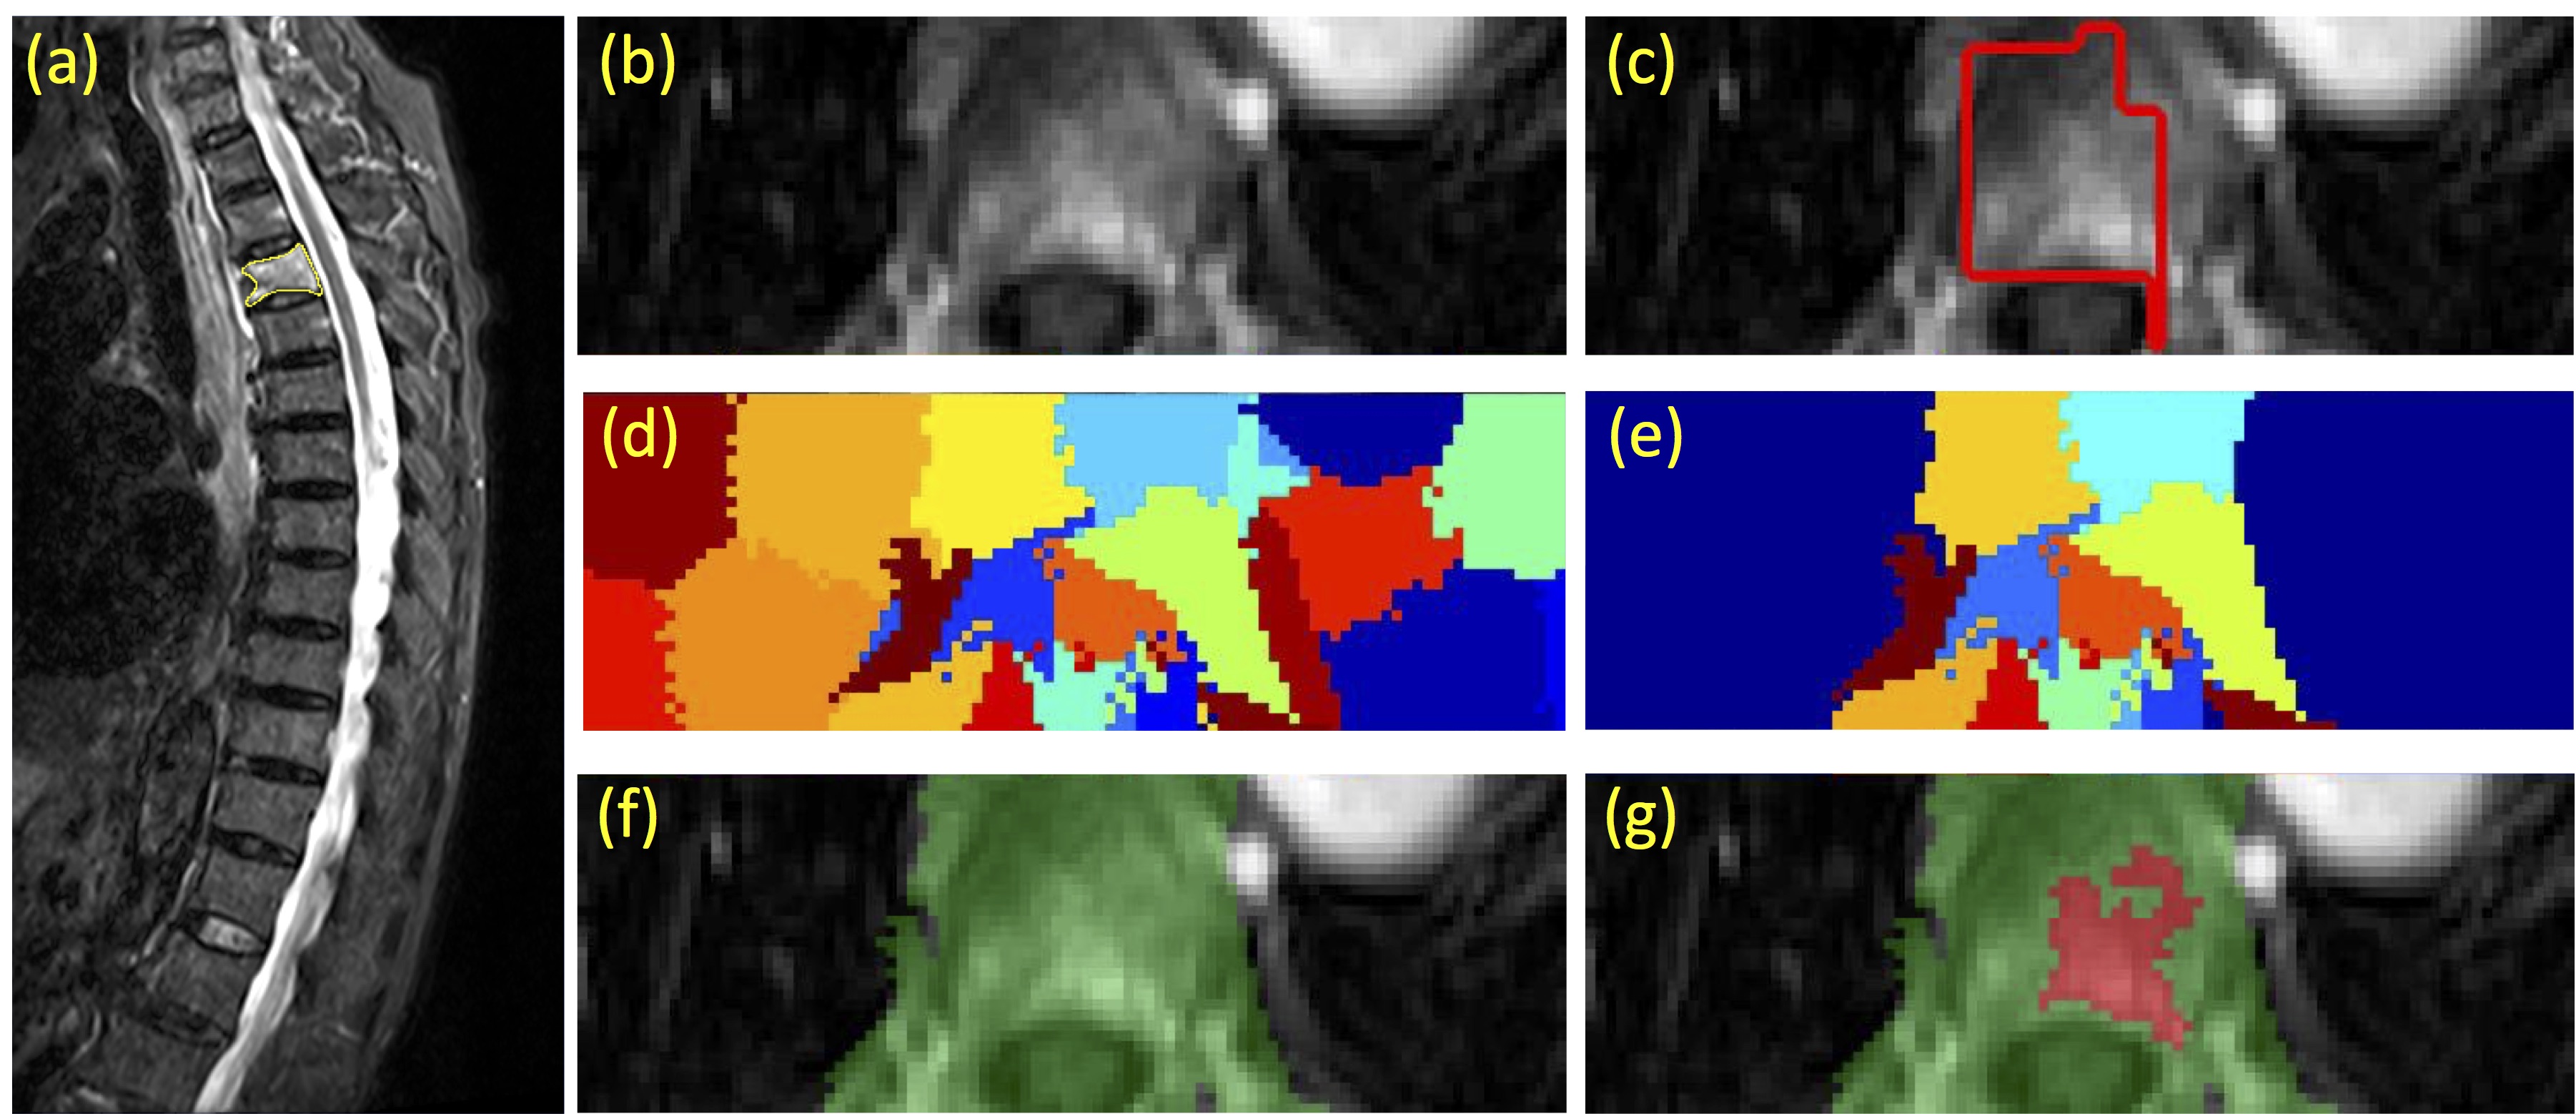
Figure
2:
Identification and segmentation of the enhanced tumor on Axial DCE images based
on the diseased segment drawn on Sagittal T2W images using the normalized cut
algorithm. (a) Sagittal T2W image with marked diseased segment. (b) Axial view
contrast-enhanced image. (c) The diseased segment in yellow in (a) is
transferred to the axial image, shown as red box. (d) The clusters generated
using the normalized cut. (d) The clusters containing any part of the red box
ROI. (f) The vertebral region combining all remaining clusters. (g) The
enhanced tumor lesion (in red) is generated by region growing within the green
field.
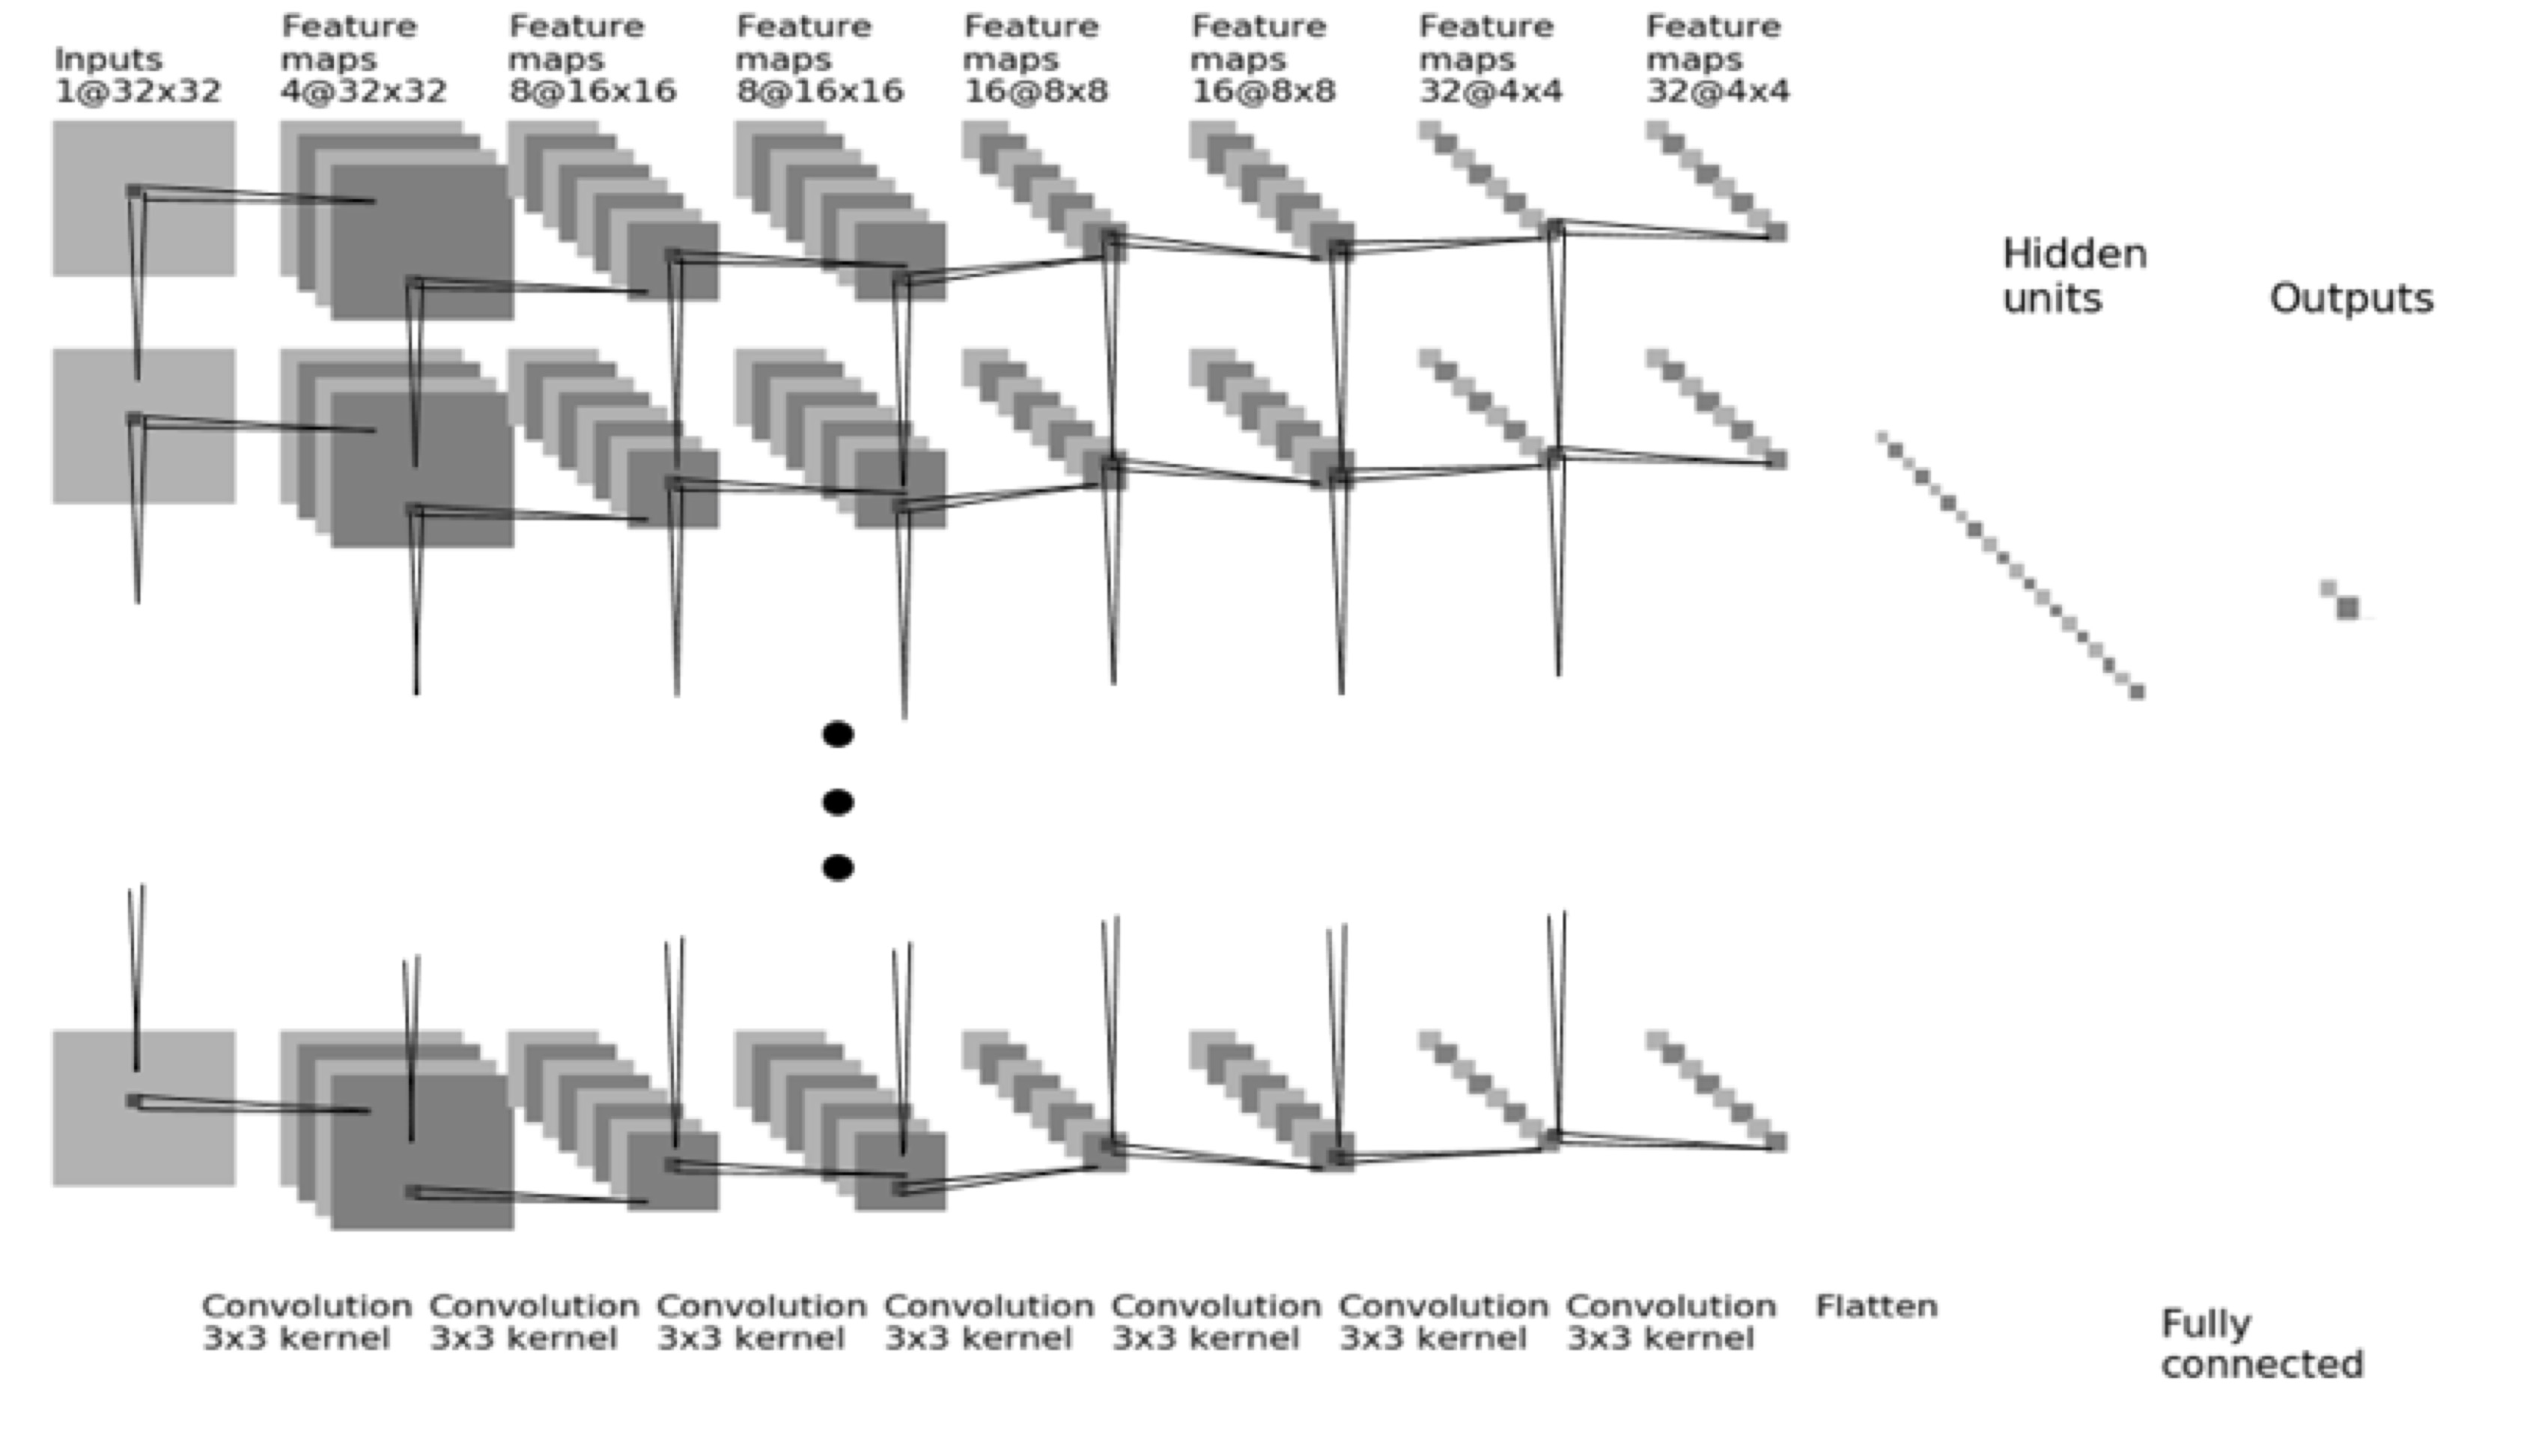
Figure
3: Diagram
of CNN. The architecture uses 7 serial convolutional LSTM layers via 3x3
filters followed by the ReLU nonlinear activation function [7]. All 12 sets of
DCE images are used as inputs, and normalized with the same intensity scale. Dropout at 50% is applied to all convolutional and fully-connected
layers after the second layer [8]. Feature maps are down sampled to 25% of the
previous layer by convolutions with a stride length of two. The last dense
layer is obtained by flattening the convolutional output feature maps from all
states. Softmax is used as the activation function of the last fully connected
layer.
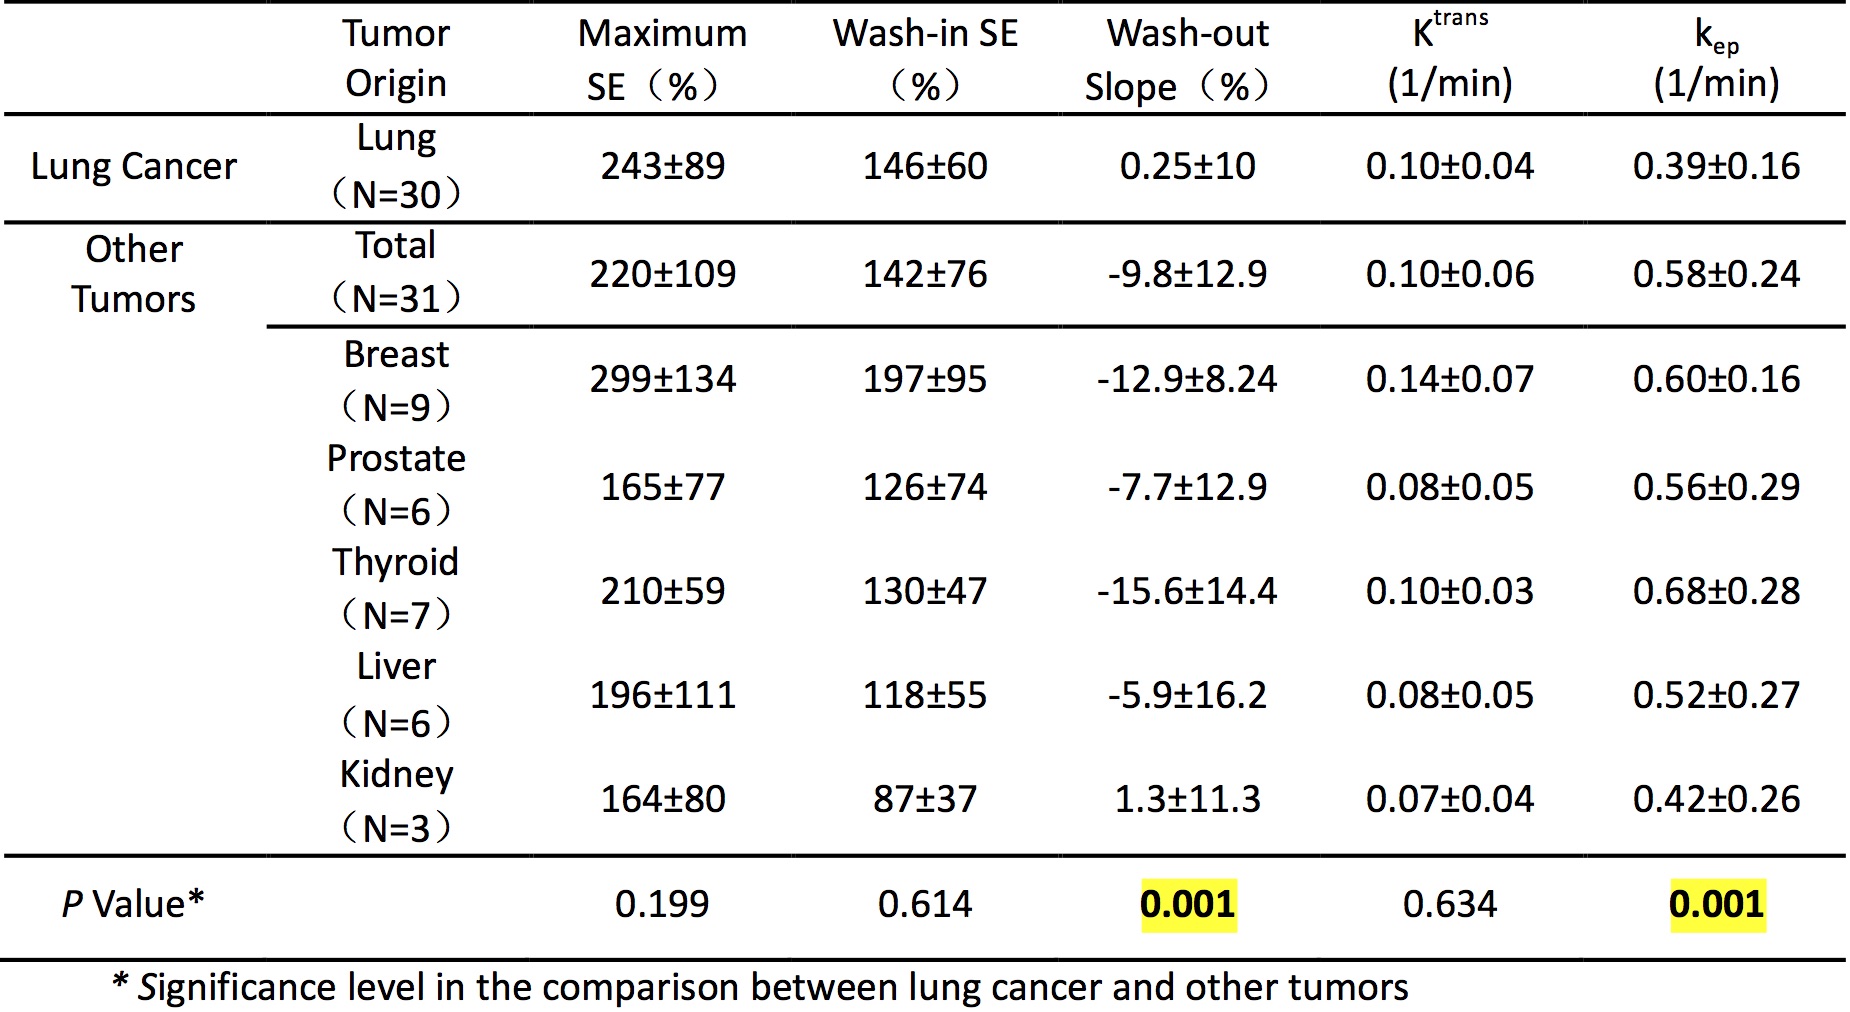
Table
1: The [mean ± standard deviation] of DCE parameters
analyzed from the manually-drawn ROI placed on the strongly enhanced tissue.
The wash-out slope and the kep analyzed using the two-compartmental
pharmacokinetic model show significant differences between lung metastasis and
other tumors.
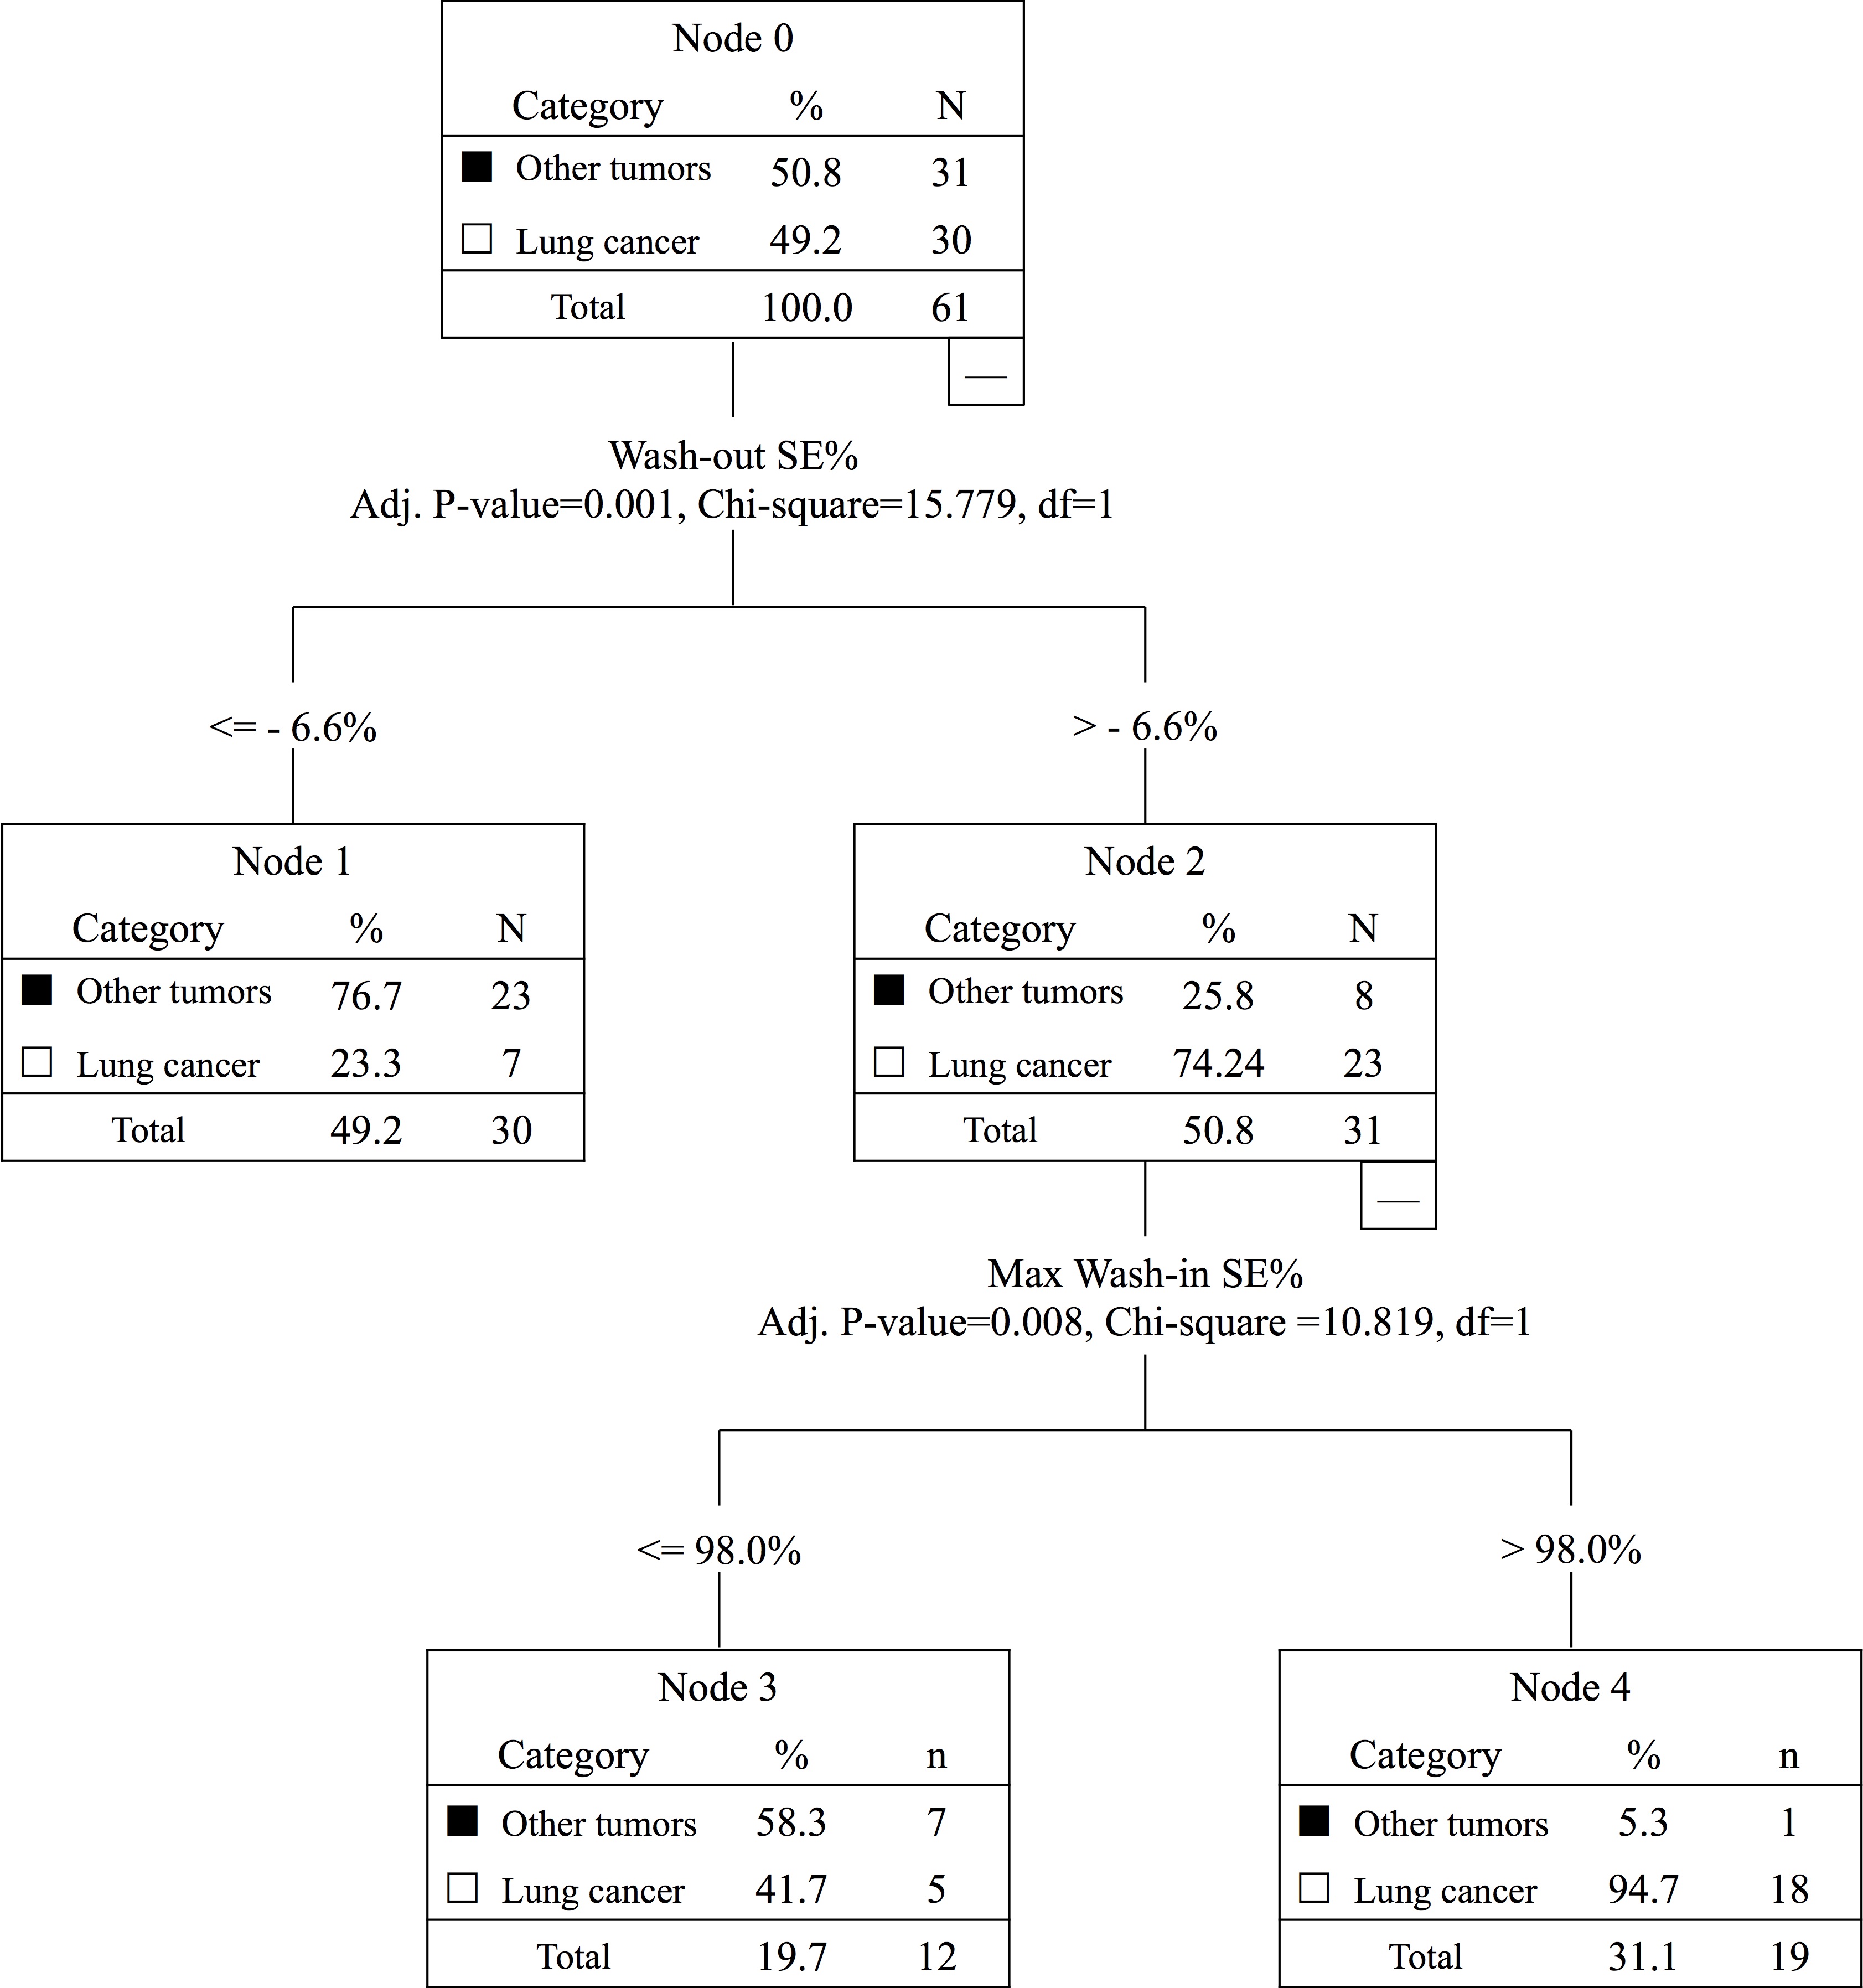
Figure 4: The diagnostic results analyzed using
the Chi-square Automatic Interaction Detector (CHAID) decision tree classification
method. Using the first threshold of wash-out slope - 6.6%, followed by the
second threshold of wash-in SE 98%, can achieve an overall diagnostic accuracy
of 0.79. True Positive (TP) for diagnosis of lung cancer = 18 cases; False
Negative (FN) = 12 cases; True Negative (TN) for diagnosis of other tumors = 30
cases; and False Positive (FP) = 1 case. The Sensitivity = 60%; Specificity =
96.8%; Positive Predicting Value = 94.7%; and Negative Predicting Value =
71.4%.