5165
Comparison of cortical bone visualization in the hip using ZTE and in-phase 3D gradient echo MRI sequences at 3T1Radiology, Mayo Clinic, Rochester, MN, United States
Synopsis
Visualizing cortical bone with MRI is challenging, as it appears as signal void in conventional MRI. Both the “black bone” technique and the zero-TE (ZTE) sequence have been proposed for cortical bone visualization. While the “black bone” technique potentially provides better cortical bone to soft tissue contrast, the ZTE sequence enables differentiation from air. This work aimed to compare the two techniques for visualizing cortical bone in the hip. Our results show that cortical bone visualization was compromised using the “black bone” technique due to chemical shift artifacts, while ZTE MRI delivered excellent depiction of the cortical bone.
Introduction
There is a growing interest in using MRI to visualize solid cortical bone structures. Due to its relatively low water content and short transverse relaxation time, cortical bone often appears as signal void in conventional MRI. The resultant high contrast between cortical bone and surrounding tissue has been utilized for cortical bone visualization by the gradient echo-based “black bone” technique.1 The proton density (PD)-weighted zero-TE (ZTE) sequence has also been used for cortical bone visualization2-4, where cortical bone still appears dark compared to soft tissue but has appreciable signal to allow for differentiation from air.5 This work aimed to compare the performance of ZTE MRI and the “black bone” technique for visualizing cortical bone in the hip. Our results show that cortical bone visualization was compromised using the “black bone” technique due to chemical shift artifacts, while ZTE MRI delivered excellent depiction of the cortical bone in the hip.Materials and methods
Imaging experiments were performed on GE Discovery MR750w 3T scanners (GE, Waukesha, WI) with IRB approval. “Black bone” imaging was achieved using a fast 3D gradient recalled echo (GRE) sequence with “In-Phase” option and the following acquisition parameters: TR/TE/FOV/FA/receiver bandwidth (rBW)/resolution/slice thickness = 6.3ms/2.1ms/34cm/5°/31.25kHz/1mm/1.2mm. The sequence was run with frequency encoding/readout in both the anterior-posterior (AP) and right-left (RL) directions to access the effects of fat/water chemical shift on the images. ZTE imaging was performed using the vendor provided Silenz sequence. Acquisition parameters included: TR/FOV/FA/rBW/resolution/slice thickness = 2.9ms/32cm/2°/83.3kHz/1mm/1mm. To facilitate cortical bone visualization, the intensity corrected ZTE magnitude images were inverted to obtain “bright bone” images simulating the CT appearance of bone using Matlab (Mathworks, Natick, MA).5
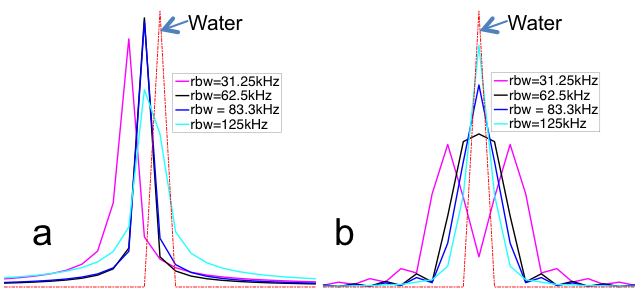
To investigate the effect of chemical shift on cortical bone visualization, the one-dimensional point-spread-functions (PSFs) in the frequency encoding direction were simulated in Matlab for both sequences with relevant input parameters identical to those used in data acquisition.
Results and discussion
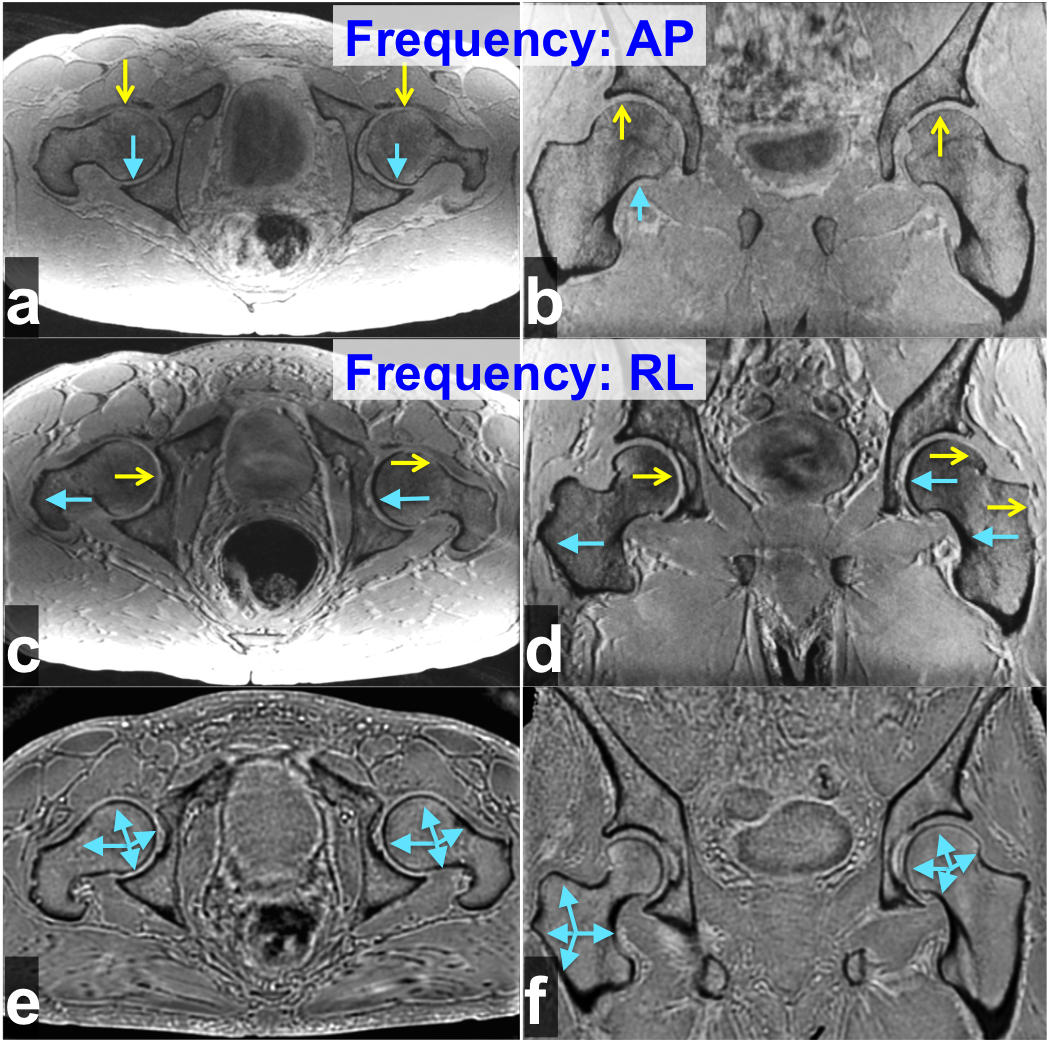
Representative axial (Fig. 1a) and coronal images (Fig. 1b) with AP frequency encoding demonstrate that visualization of the anterior side of the cortical bone (which normally appears as a dark rim around bone marrow) is significantly compromised (yellow “stealth” arrows), while the posterior side remains dark and visible (light blue arrows). Similar findings are present in the axial (Fig. 1c) and coronal (Fig. 1d) images with RL readout, where visualization of the left side of the cortical bone is now compromised. The axial (Fig. 1f) and coronal (Fig. 1g) ZTE reformats show cortical bone more consistently as darker signal (light blue arrows).
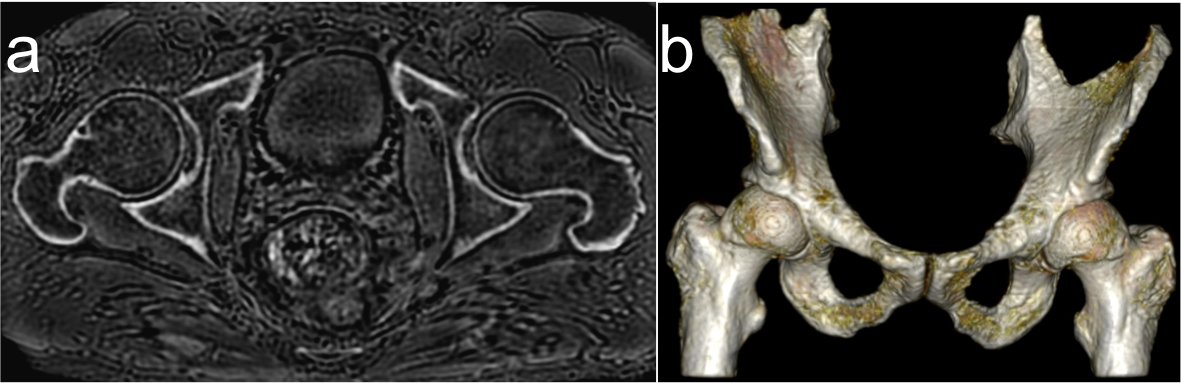
The capability of the ZTE MRI for visualizing cortical bone in the hip can be appreciated in Fig 2. Cortical bone is easily visualized with bright intensity after processing (Fig. 2a). This enables volume-rendering to be used to reconstruct the cortical bone in the entire hip (Fig. 2b). Currently, this volume rendering is routinely created from CT data for diagnosis and surgical planning in patients with structural hip disorders.
The frequency-encoding dependent degradation in cortical bone visualization with the 3D GRE based sequence is due to the chemical shift artifacts from the high fat signals in the nearby bone marrow voxels. As demonstrated in the PSFs in Fig. 3, significant shift in fat peak relative to water signal still exists even at a rBW of as high as 125kHz. To make the matter more complicated, the shifted fat peak amplitude remains high and does not change monotonously with rBW. For ZTE imaging, where near zero TE time and true 3D radial acquisition is used, fat peak is broadened but its center location remains unshifted relative to water signal (Fig. 3b). The fat peak becomes narrower and increasingly focused to the desired voxel as the rBW increases. With reasonably high rBW the fat signal spreading into the nearby cortical bone voxels can be minimized, making the ZTE sequence less affected by chemical shift artifacts.
Conclusion
Our study has demonstrated that the use of 3D GRE based “black bone” technique for visualization of cortical bone in the hip is susceptible to chemical shift artifacts. The “bright bone” ZTE technique is relatively resistant to chemical shift and allows for excellent depiction of the cortical bone in the hip. Further investigation on its clinical application is therefore warranted.Acknowledgements
No acknowledgement found.References
1. Eley KA, Watt-Smith SR, Sheerin F, Golding SJ. "Black Bone" MRI : a potential alternative to CT with three-dimensional reconstruction of the craniofacial skeleton in the diagnosis of craniosynostosis. Eur Radiol. 2014;24:2417–2426.
2.Weiger M, Stampanoni M, Pruessmann KP. Direct depiction of bone microstructure using MRI with zero echo time. Bone 2013; 54: 44–47 .
3. Wiesinger F, Sacolick LI, Menini A, et al. Zero TE MR bone imaging in the head. Magn Reson Med. 2016;75:107–114.
4. Delso G, Wiesinger F, Sacolick LI, et al. Clinical evaluation of zero-echo-time MR imaging for the segmentation of the skull. J Nucl Med. 2015;56:417–422.
5. Lu A, Gorny KR, Ho M, et al. Improved delineation of air-bone interface in in-vivo high-resolution bright bone ZTE MRI at 3T. Proc 25th ISMRM 2017. P5109
Figures