5164
What is the role of MRS-based bone marrow fatty acid unsaturation level compared to fat fraction in predicting vertebral bone strength?1Department of Diagnostic and Interventional Radiology, Technical University Munich, Munich, Germany, 2Engineering Product Development, Singapore University of Technology and Design, Singapore, Singapore, 3Department of Diagnostic and Interventional Neuroradiology, Technical University Munich, Munich, Germany
Synopsis
In addition to bone marrow fat content, bone marrow composition is attracting growing interest as an advanced biomarker in the investigation of osteoporosis and bone metabolism. Finite-element analysis of CT imaging data allows non-invasive assessment of bone fracture risk. The present vertebral specimen study showed that vertebral bone marrow fatty acid unsaturation level (UL) is positively correlated with finite-element analysis based failure load and confirmed the negative correlation between bone marrow fat fraction and failure load. However, UL estimation did not improve failure load prediction beyond bone marrow fat fraction in this in-vitro study.
Purpose
Increased bone marrow fat fraction has been shown to be associated with osteoporosis in both in-vivo and in-vitro studies1,2,3,4. Furthermore, bone marrow fat composition has been shown to be associated with osteoporosis and diabetes5,6, in particular bone marrow fatty acid unsaturation level has been proposed as an advanced imaging biomarker for osteoporotic fractures as it differentiated diabetic subjects with prevalent osteoporotic fractures from diabetic subjects without fractures6. However, little is known about the direct relationship of bone marrow fatty acid unsaturation level with bone strength and whether it improves the prediction of bone strength beyond bone marrow fat fraction. Multi-Detector Computed Tomography (MDCT)-based Finite-element (FE) modeling has increasingly been used to assess bone strength and understand the mechanisms underlying bone fracture7. FE analysis provides a non-invasive method to assess fracture risk by estimating failure load (FL). Therefore, the purpose of our study was to investigate the association of MRS-based bone marrow proton density fat fraction (PDFF) and fatty acid unsaturation level (UL) with FE-analysis-based failure load in vertebral specimens in-vitro, especially the additional value of UL estimation for the prediction of bone strength.Methods
Subjects: 10 thoracic vertebrae from human donors (6 females, 4 males, age = 60.7±12.3 years) without pathological bone changes were harvested for this study. The mid-vertebral specimens as the middle third of each vertebra were cut out parallel to the endplates by using a band saw (FK 22, Bizerba, Balingen, Germany).
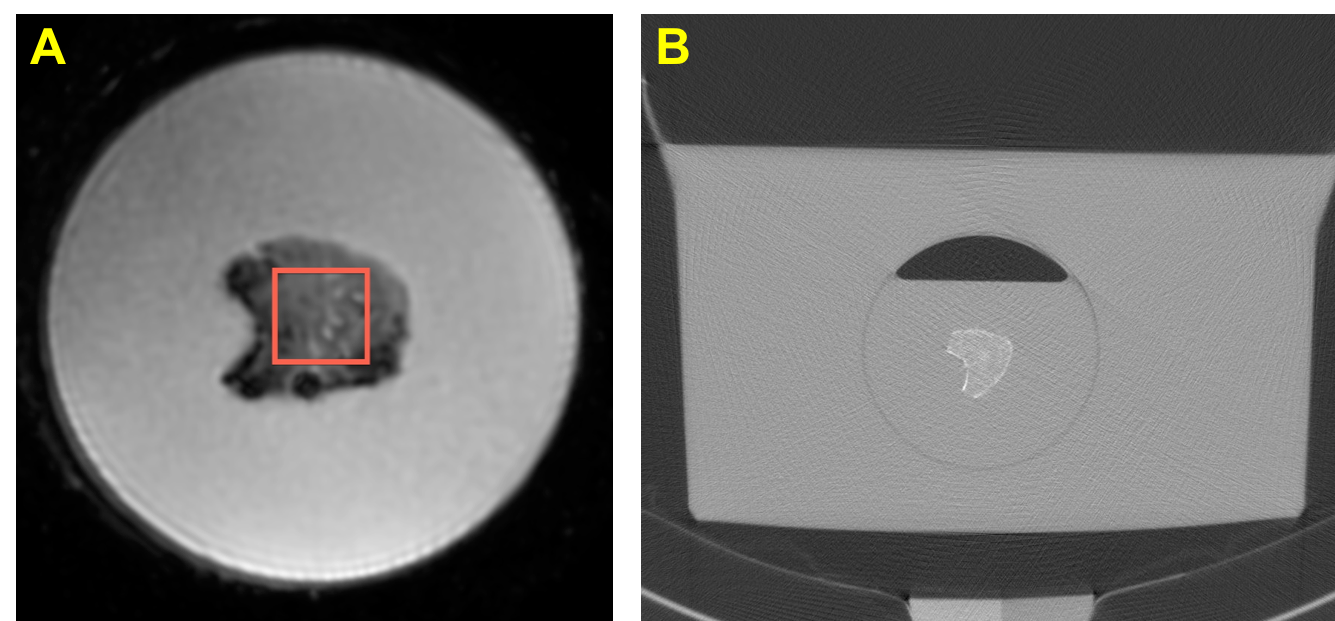
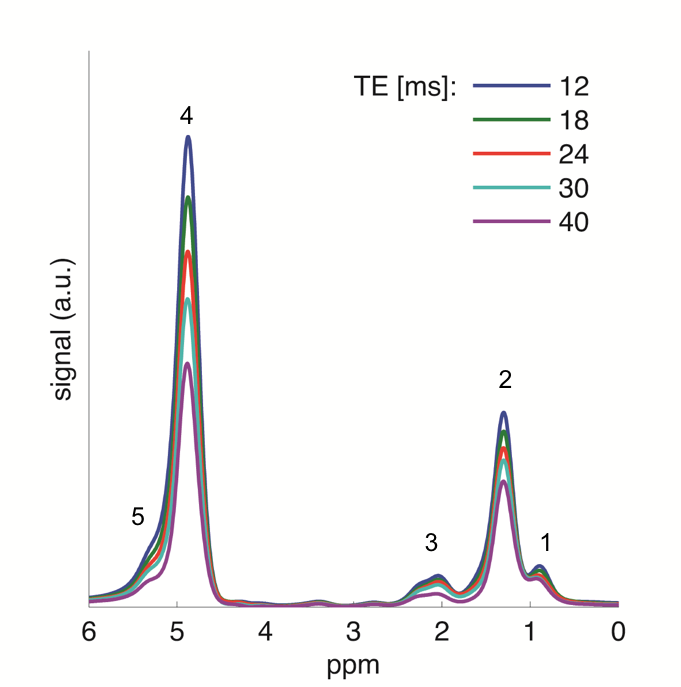
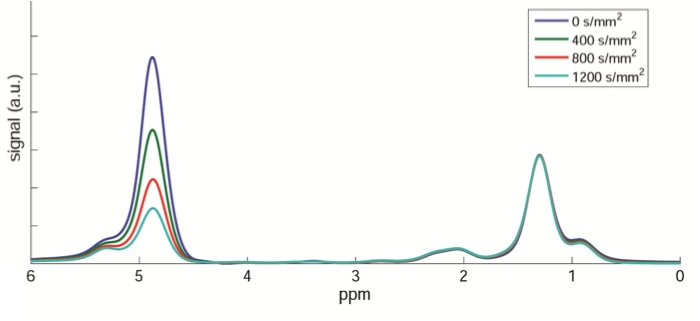
MR Imaging and Data Analysis: Before being cut, all specimens underwent 3T MRS (Ingenia, Philips Healthcare) using an 8-channel extremity coil (Fig. 1A). A multi-TE STEAM sequence was applied for PDFF quantification using the following parameters: TE = 12/18/24/30/ ms, TR/TM = 5000/18 ms. A diffusion-weighted multi-b-value STEAM sequence was applied for quantification of fatty acid unsaturation using the following parameters: TE/TR/TM = 5/32/32 ms, b-values = 0/400/800/1200 s/mm2. Voxel size = 15x15x15 mm3, acquisition bandwidth = 3 kHz in both sequences. In the MRS data analysis five peaks were considered (Fig. 2). UL was calculated as the ratio of the olefinic and methylene/β-carboxyl peak based on the multi-b-value DW-STEAM data which offers a better separation of the water peak and olefinic peak (Fig. 3)8.
CT Imaging and Data Analysis: All mid-vertebral specimens underwent MDCT imaging (64-row MDCT scanner, SOMATOM Definition AS, Siemens Healthcare) in a water bath (Fig. 1B) to simulate the soft tissue environment using the following scan parameters: tube exposure = 220 mAs, tube voltage = 120 kVp, image matrix 512x512 pixels, pixel spacing 0.44x0.44 mm2, slice thickness 0.4 mm. BMD was determined with the reference phantom in the table mat. FL as a predictor of bone strength was estimated using the finite-element method described in Ref. 9.
Results
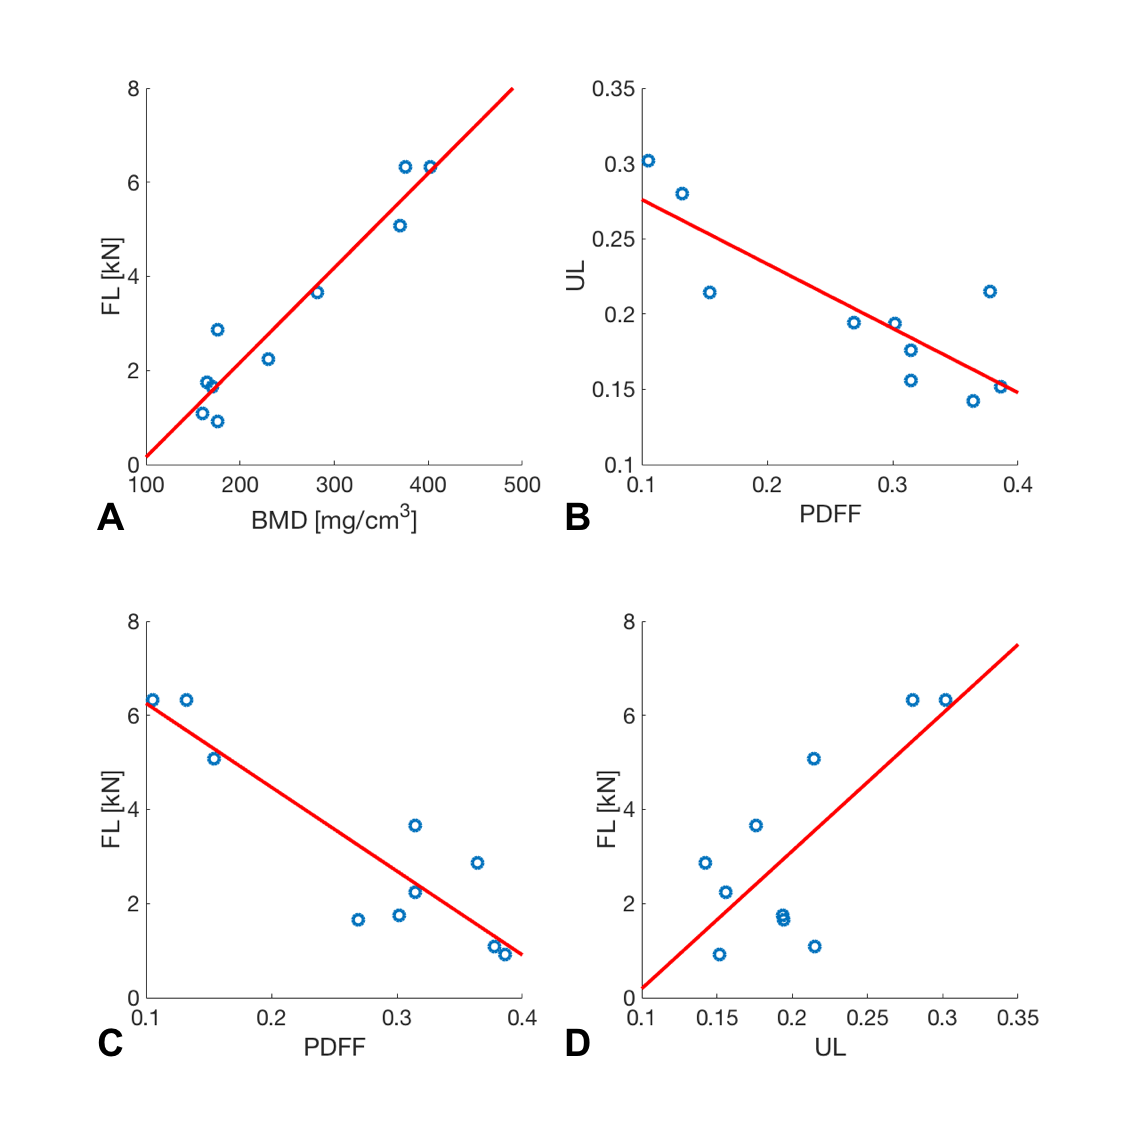
Mean and standard deviation of the measured parameters were BMD = 250.7±98.6 mg/cm3, FL = 3189.6±2067.5 N, PDFF = 0.2720±0.1045, UL = 0.2025±0.0530. Linear regression analysis (Fig. 4) revealed statistically significant correlation (p < 0.05) between BMD and FL (Pearson’s r = 0.96), PDFF and UL (r = -0.84), PDFF and FL (r = -0.90), UL and FL (r = 0.75). In a multi-variate regression model, PDFF but not UL was a statistically significant (p < 0.05) predictor of FE-based failure load.Discussion and Conclusion
Both vertebral bone marrow
PDFF and unsaturation level showed significant correlation with FE-based
vertebral failure load, PDFF (R2 = 0.81) showed higher correlation
than unsaturation level (R2 = 0.56). This finding suggests their use
as potential predictor of bone strength. However, multivariate regression
analysis revealed no improvement of failure load prediction when both
parameters were used. In conclusion, MRS-based estimation of vertebral bone
marrow fatty acid unsaturation level showed no improvement of FE-based failure
load prediction beyond PDFF. Further studies in specific subcohorts with
impaired bone health, such as diabetic patients, are needed to investigate
whether unsaturation level can improve fracture risk prediction beyond PDFF.Acknowledgements
The present work was supported by the European Research Council (grant agreement No 677661 – ProFatMRI and grant agreement No 637164 – iBack), TUM Faculty of Medicine KKF grant H01, and Philips Healthcare.References
- Karampinos et al.: Association of MRS-Based Vertebral Bone Marrow Fat Fraction with Bone Strength in a Human In Vitro Model. J Osteoporos. 2015; 2015:152349.
- Schwartz et al.: Vertebral bone marrow fat associated with lower trabecular BMD and prevalent vertebral fracture in older adults. J Clin Endocrinol Metab. 2013; 98:2294.
- Griffith et al.: Vertebral Marrow Fat Content and Diffusion and Perfusion Indexes in Women with Varying Bone Density: MR Evaluation. Radiology. 2006; 241:831.
- Yeung et al.: Osteoporosis Is Associated with Increased Marrow Fat Content and Decreased Marrow Fat Unsaturation: A Proton MR Spectroscopy Study. J Magn Reson Imaging. 2005; 22:279.
- Baum et al.: Does vertebral bone marrow fat content correlate with abdominal adipose tissue, lumbar spine bone mineral density, and blood biomarkers in women with type 2 diabetes mellitus? J Magn Reson Imaging. 2012; 35:117.
- Patsch et al.: Bone marrow fat composition as a novel imaging biomarker in postmenopausal women with prevalent fragility fractures. J Bone Miner Res 2013; 28:1721.
- Pahr et al.: Finite Element-Based Mechanical Assessment of Bone Quality on the Basis of In Vivo Images. Curr Osteoporos Rep. 2016; 14:374.
- Dieckmeyer et al.: ADC Quantification of the Vertebral Bone Marrow Water Component: Removing the Confounding Effect of Residual Fat. Magn Reson Med. 2017; 78:1432.
- Anitha et al.: Effects of dose reduction on bone strength prediction using finite element analysis. Sci Rep. 2016; 6:38441.
Figures