5163
Sex dependence of age-related vertebral bone marrow PDFF and T2 relaxation time changes in a cohort of nearly 200 subjects using multi-TE single-voxel MR spectroscopy1Department of Diagnostic and Interventional Radiology, Technical University of Munich, Munich, Germany, 2Department of Nutritional Medicine, Technical University of Munich, Freising, Germany, 3Department of Diagnostic and Interventional Neuroradiology, Technical University of Munich, Munich, Germany
Synopsis
Fat quantification of vertebral bone marrow (VBM) has been often performed with single-TE MRS. Using MRS the differences in the T2-decay of water and fat is neglected and therefore the extracted fat fraction (FF) measure comprises T2-weighting. The aim of this study was to examine differences between T2-weighted FF and proton density fat fraction (PDFF) using multi-TE single-voxel MRS and to relate the observed differences with changes in T2-relaxation of water with age in 197 subjects. The T2-relaxation of water remained constant in males and showed an age dependence in females resulting in amplified gender differences of T2-weighted FF with age compared to PDFF.
Purpose
The quantification of vertebral bone marrow (VBM) fat fraction (FF) using MR spectroscopy (MRS) has recently attracted significant interest due to its link to bone health1. VBM FF is known to physiologically increase with age. Previous studies using single-voxel MRS have shown a difference in the age-dependent VBM FF increase between male and female subjects2,3. However, many of these previous studies have employed PRESS sequences with long TEs and therefore reported T2-weighted FF measures2,3. A recent study measuring VBM FF used multi-TE MRS to correct for T2-weighting to extract proton density fat fraction (PDFF) values and thereby showed that T2-correction was important as water T2 was reported to depend on PDFF differently for males and females4. However, there is still limited data on the sex dependence of age-related changes of VBM PDFF and T2-relaxation times. The purpose of the present study was to perform multi-TE MRS in VBM in a large healthy cohort and examine the age and sex dependence of VBM PDFF and T2-relaxation times, respectively.Methods
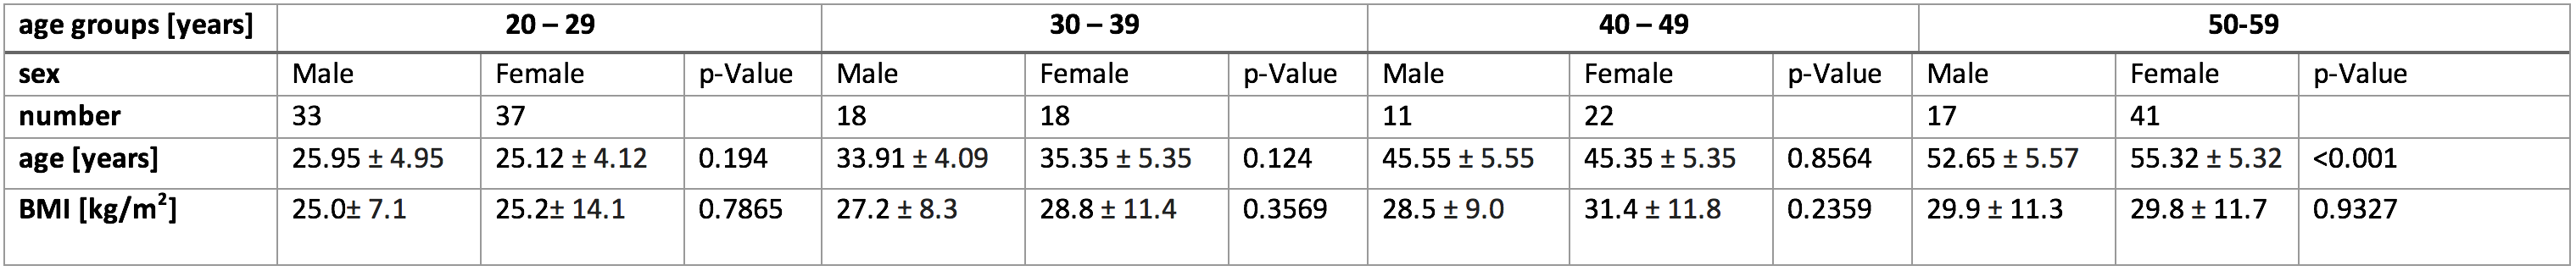
Study design: 197 subjects (79 male, 118 female) (Table 1) with no history of pathological bone changes underwent single-voxel STEAM MRS (TR=6000ms, TM=16 ms, VOI=15x15x15mm3, 8 averages per TE) of the VBM in the trabecular compartment of L5 vertebrae at increasing echo times (TE=11/15/20/25ms). All measurements were performed on a 3T scanner (Ingenia, Philips Healthcare) using the built-in posterior coil for signal reception.
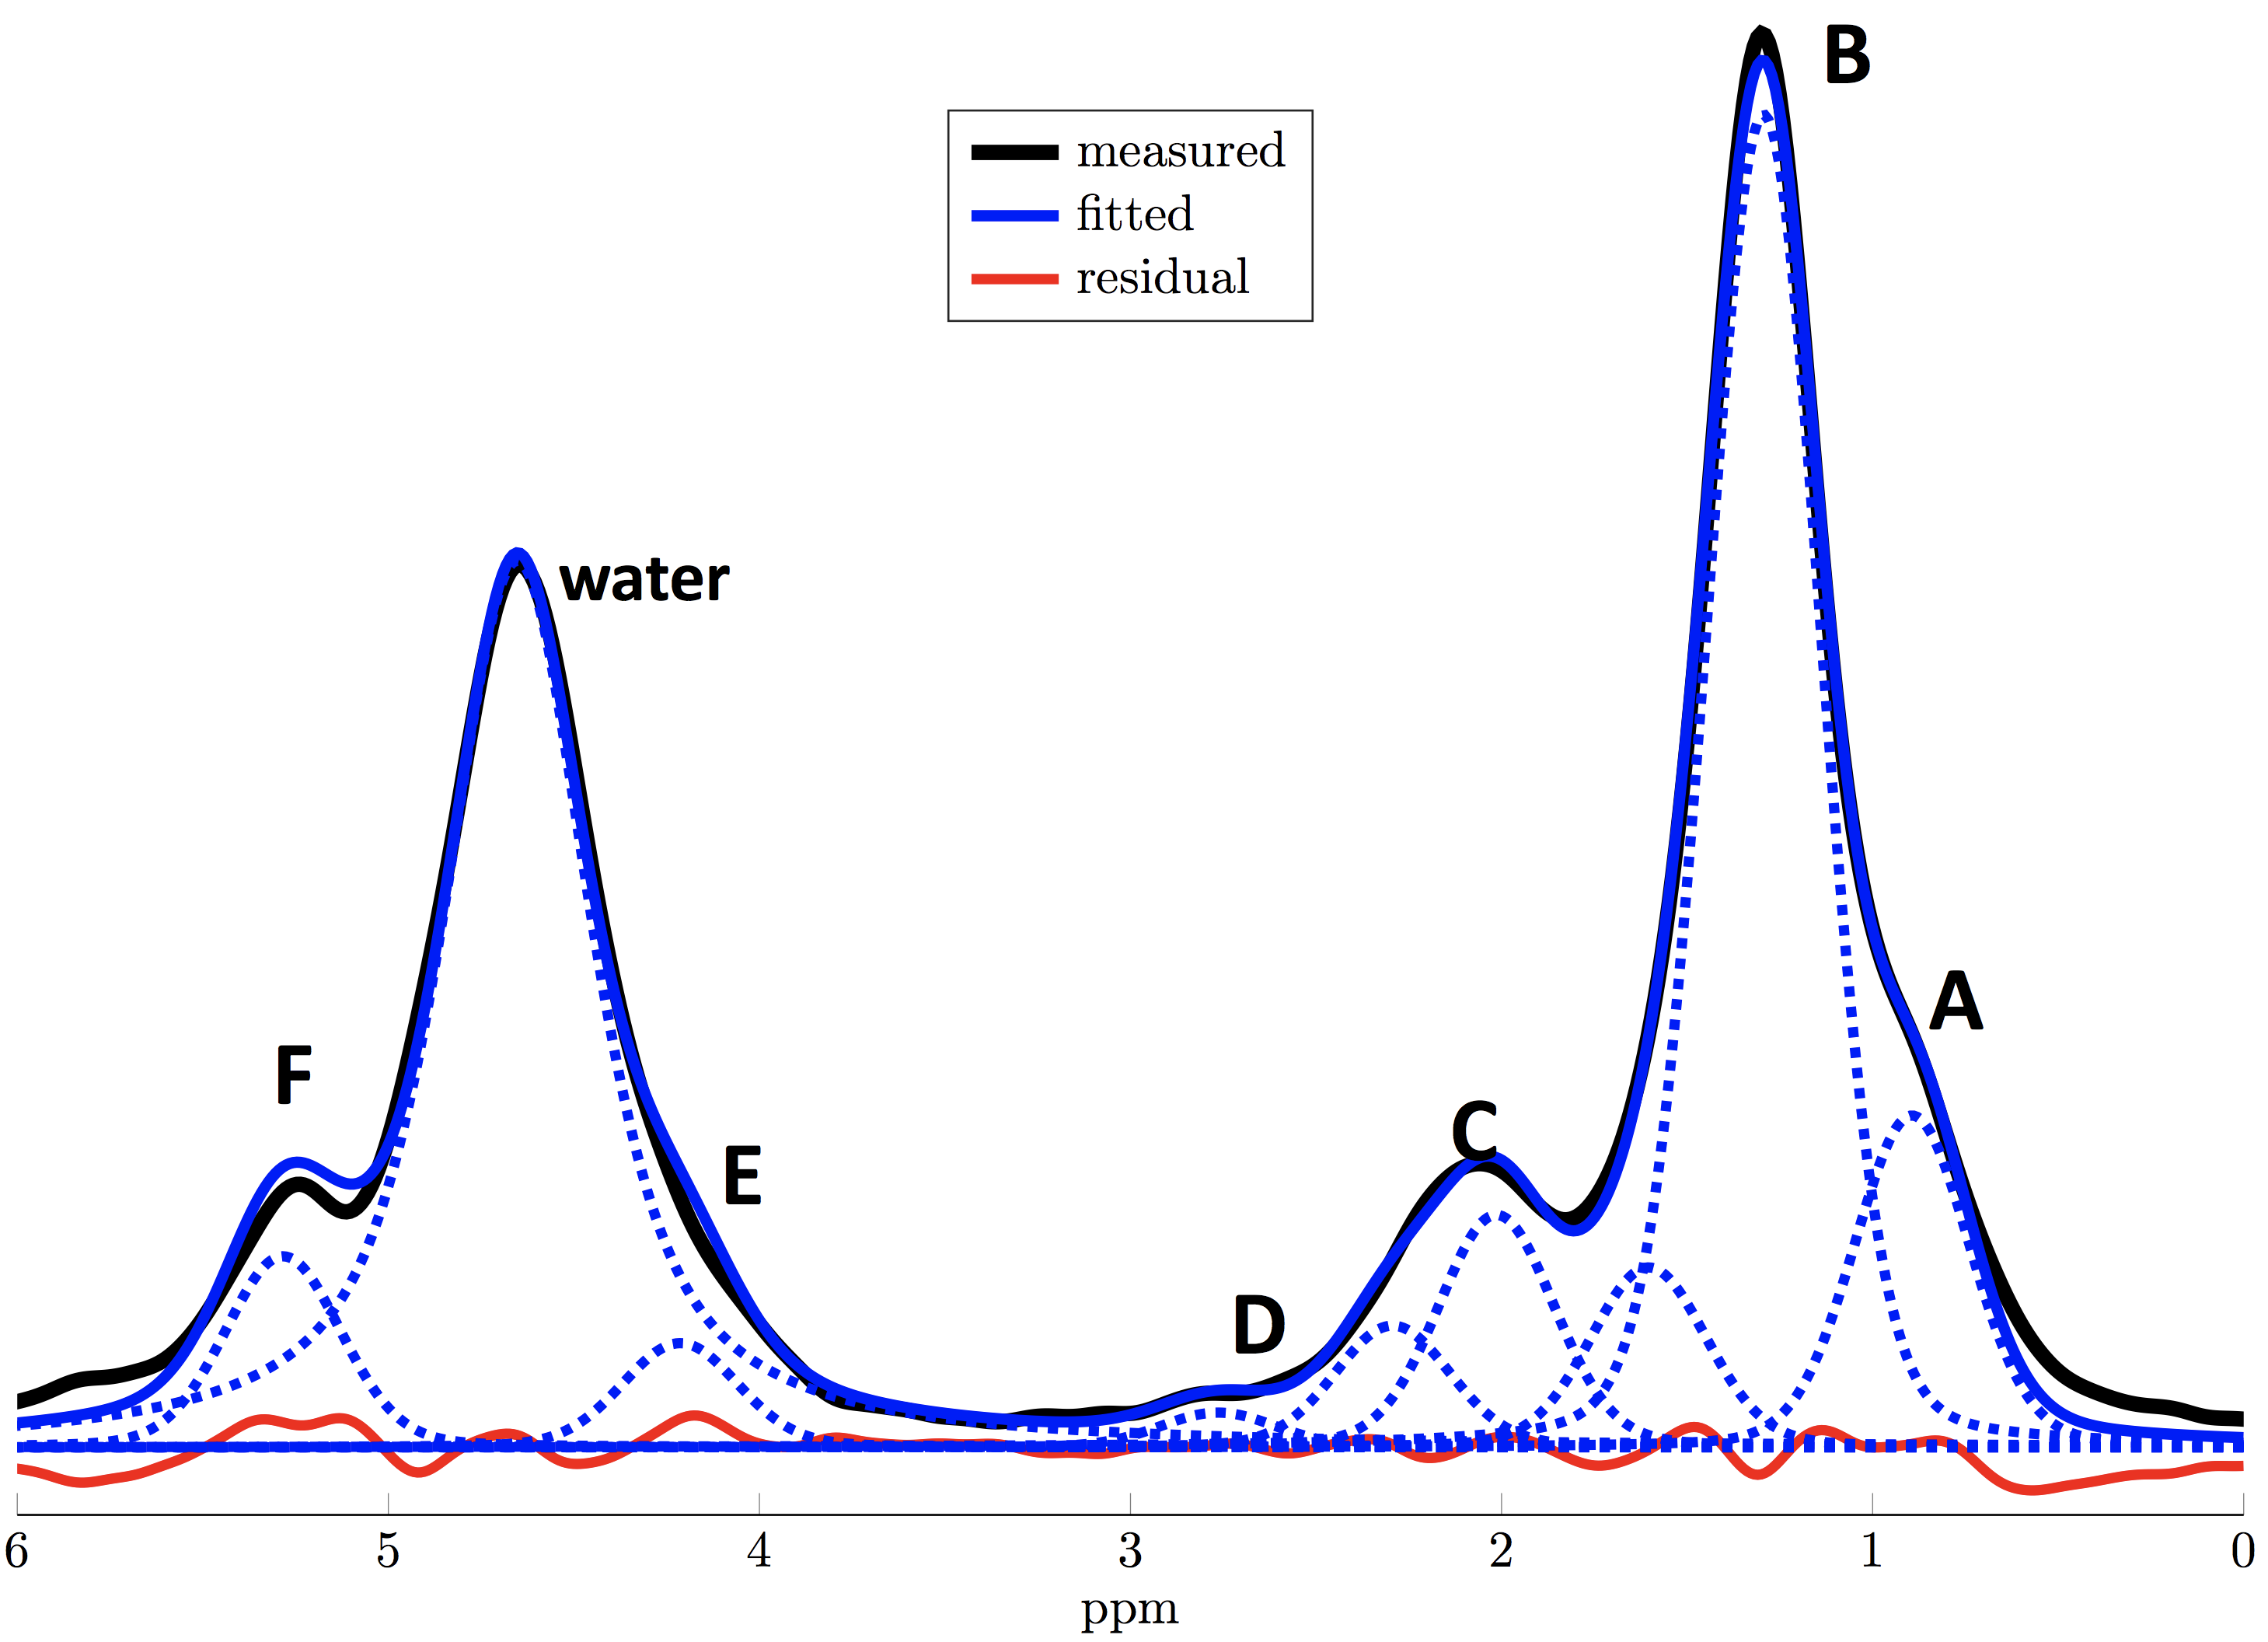
MRS Quantification: Peak fitting was performed with an in-house-written MATLAB routine using a 9-peak-model (Fig 1) with the following peaks: A (methyl at 0.90ppm), B (superposition of methylene at 1.30ppm, β-carboxyl at 1.60ppm), C (superposition of α-olefinic at 2.02ppm, α-carboxyl at 2.25ppm), D (diacyl at 2.77pm), E (glycerol at 4.20ppm), F (olefinic at 5.29ppm) and water (at 4.67ppm). As peaks E and F overlap with the water peak, they were constrained to the measurable fat peaks A+B assuming a triglyceride structure5 with pre-calibrated fatty acid profile parameters from 4 (Fig. 1). T2-relaxation times were determined based on a joint TE-fitting, assuming one mono-exponential T2-relaxation time constant for water and a common mono-exponential T2-relaxation time constant for all fat peaks. PDFF was calculated as the T2-corrected sum of all fat peak areas divided by the T2-corrected sum of all peak areas. Additionally, a T2-weighted FF at TE=25ms was determined.
Results
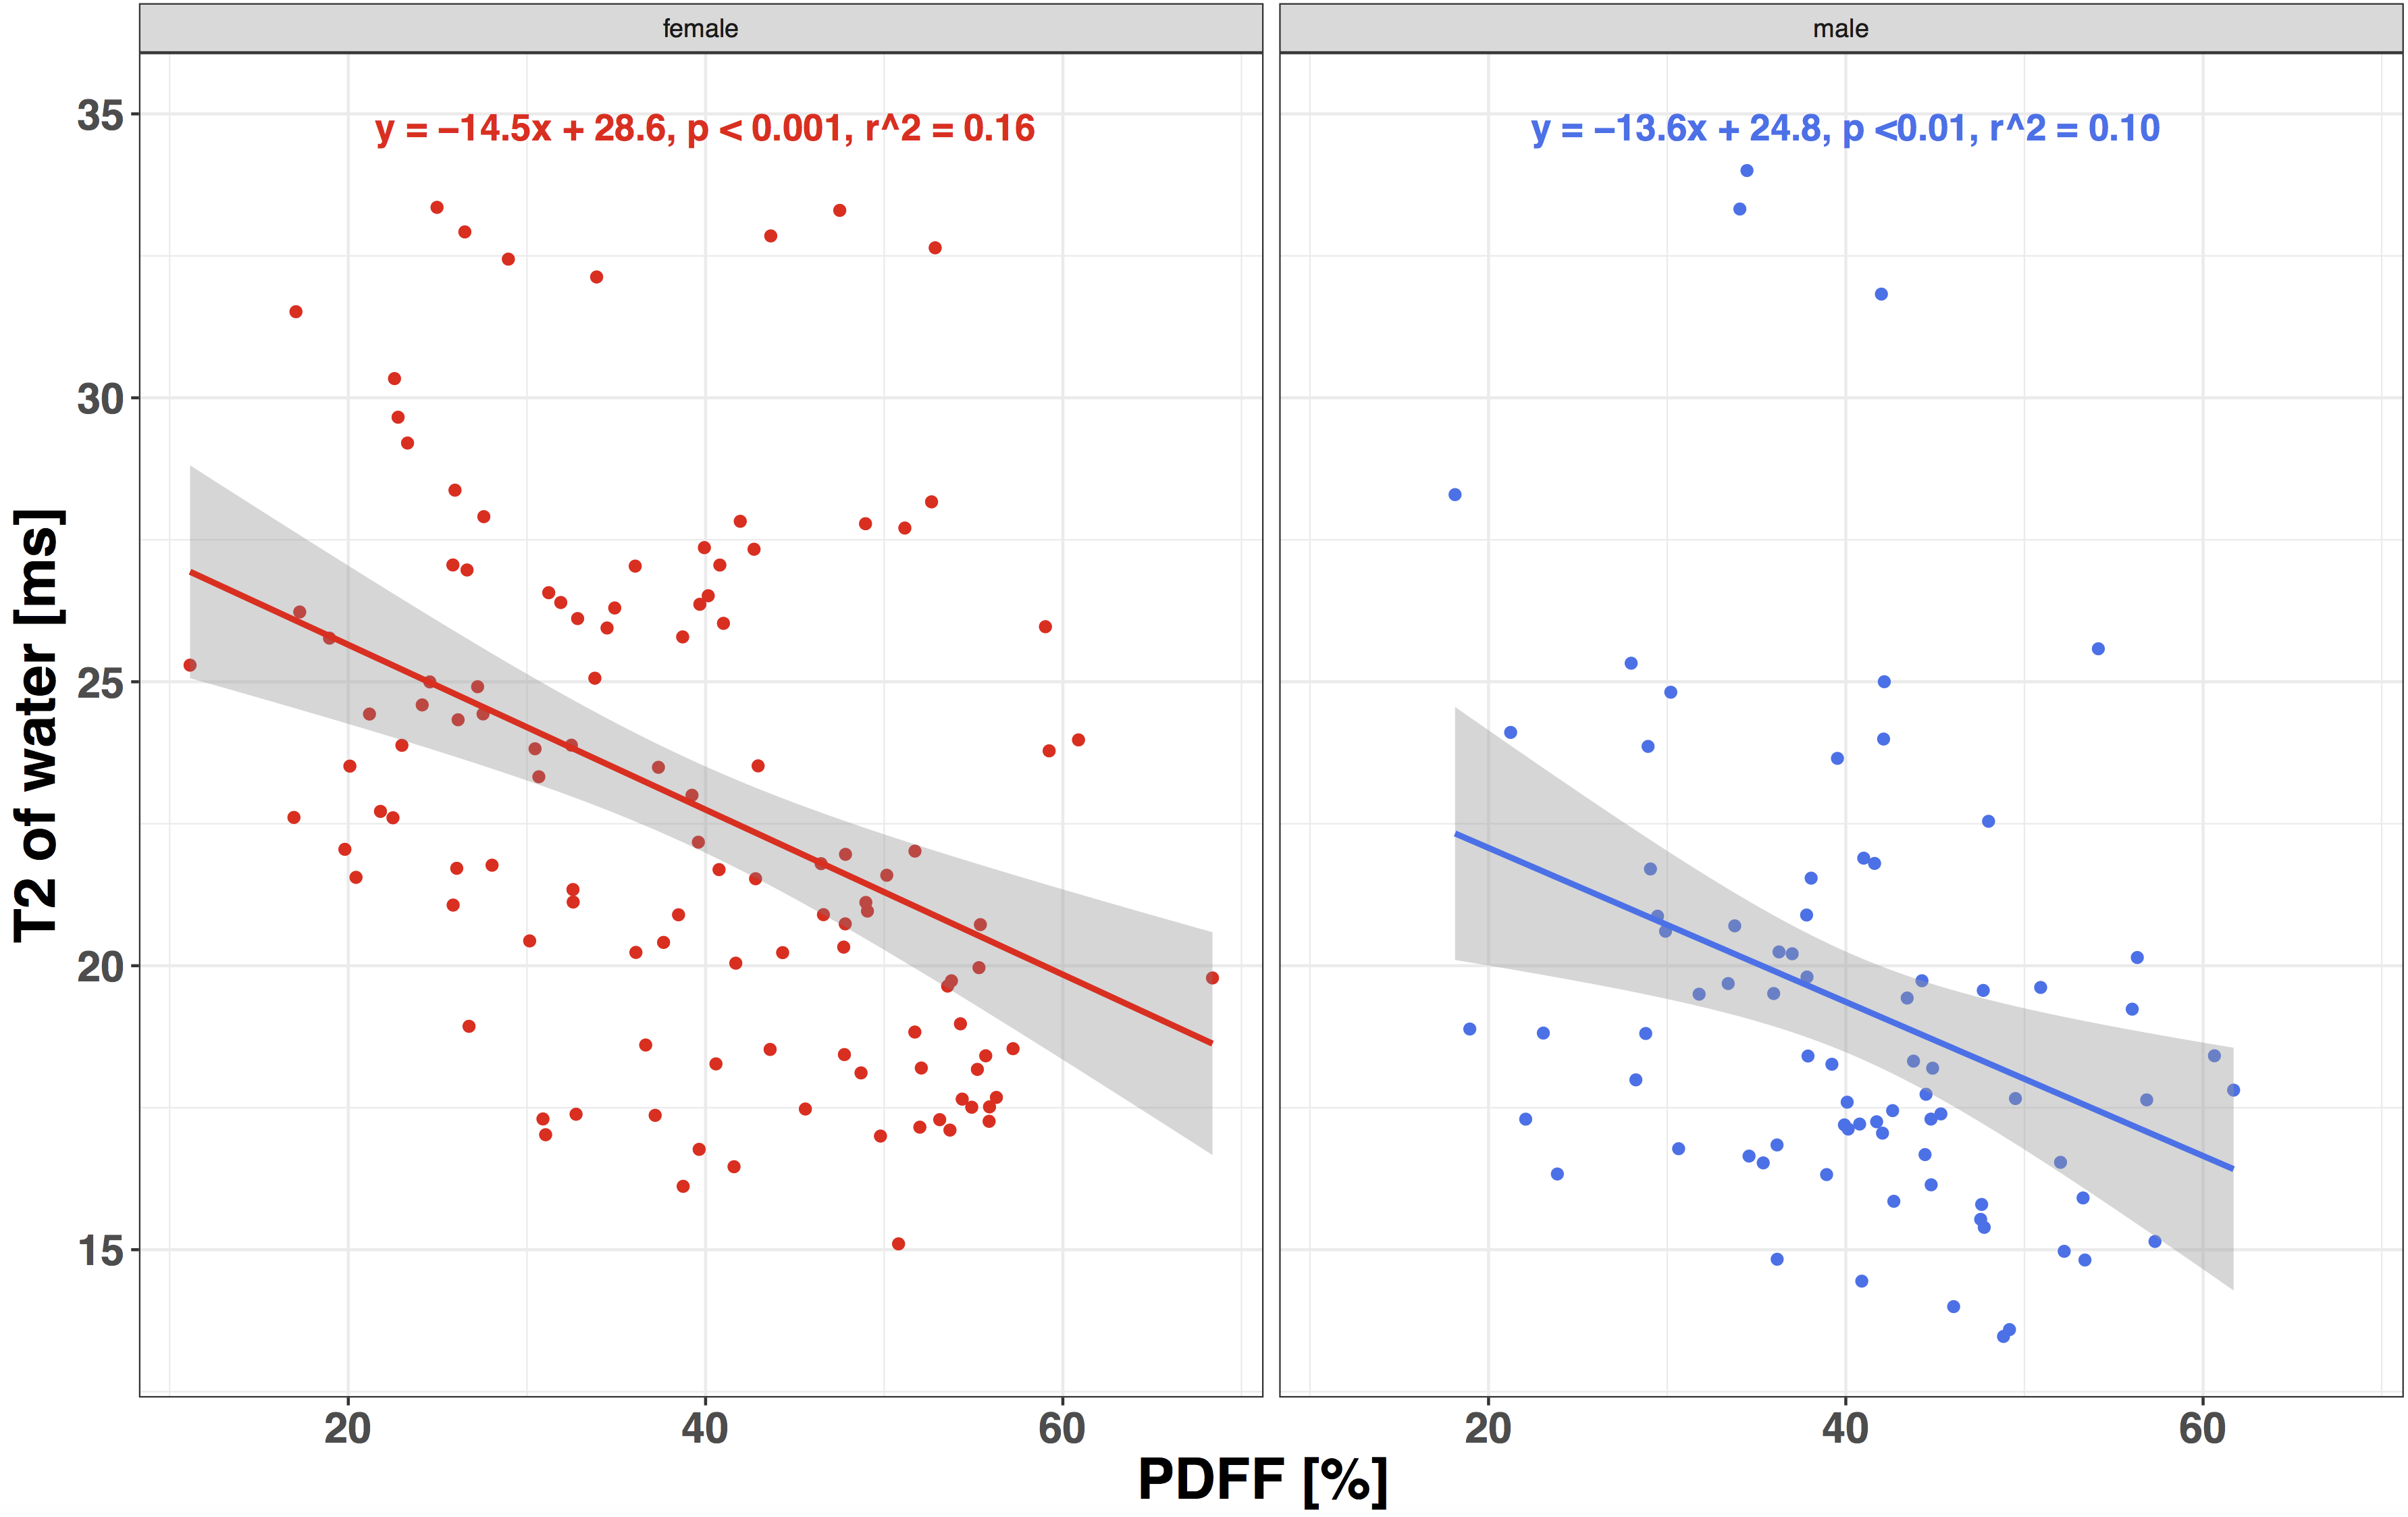
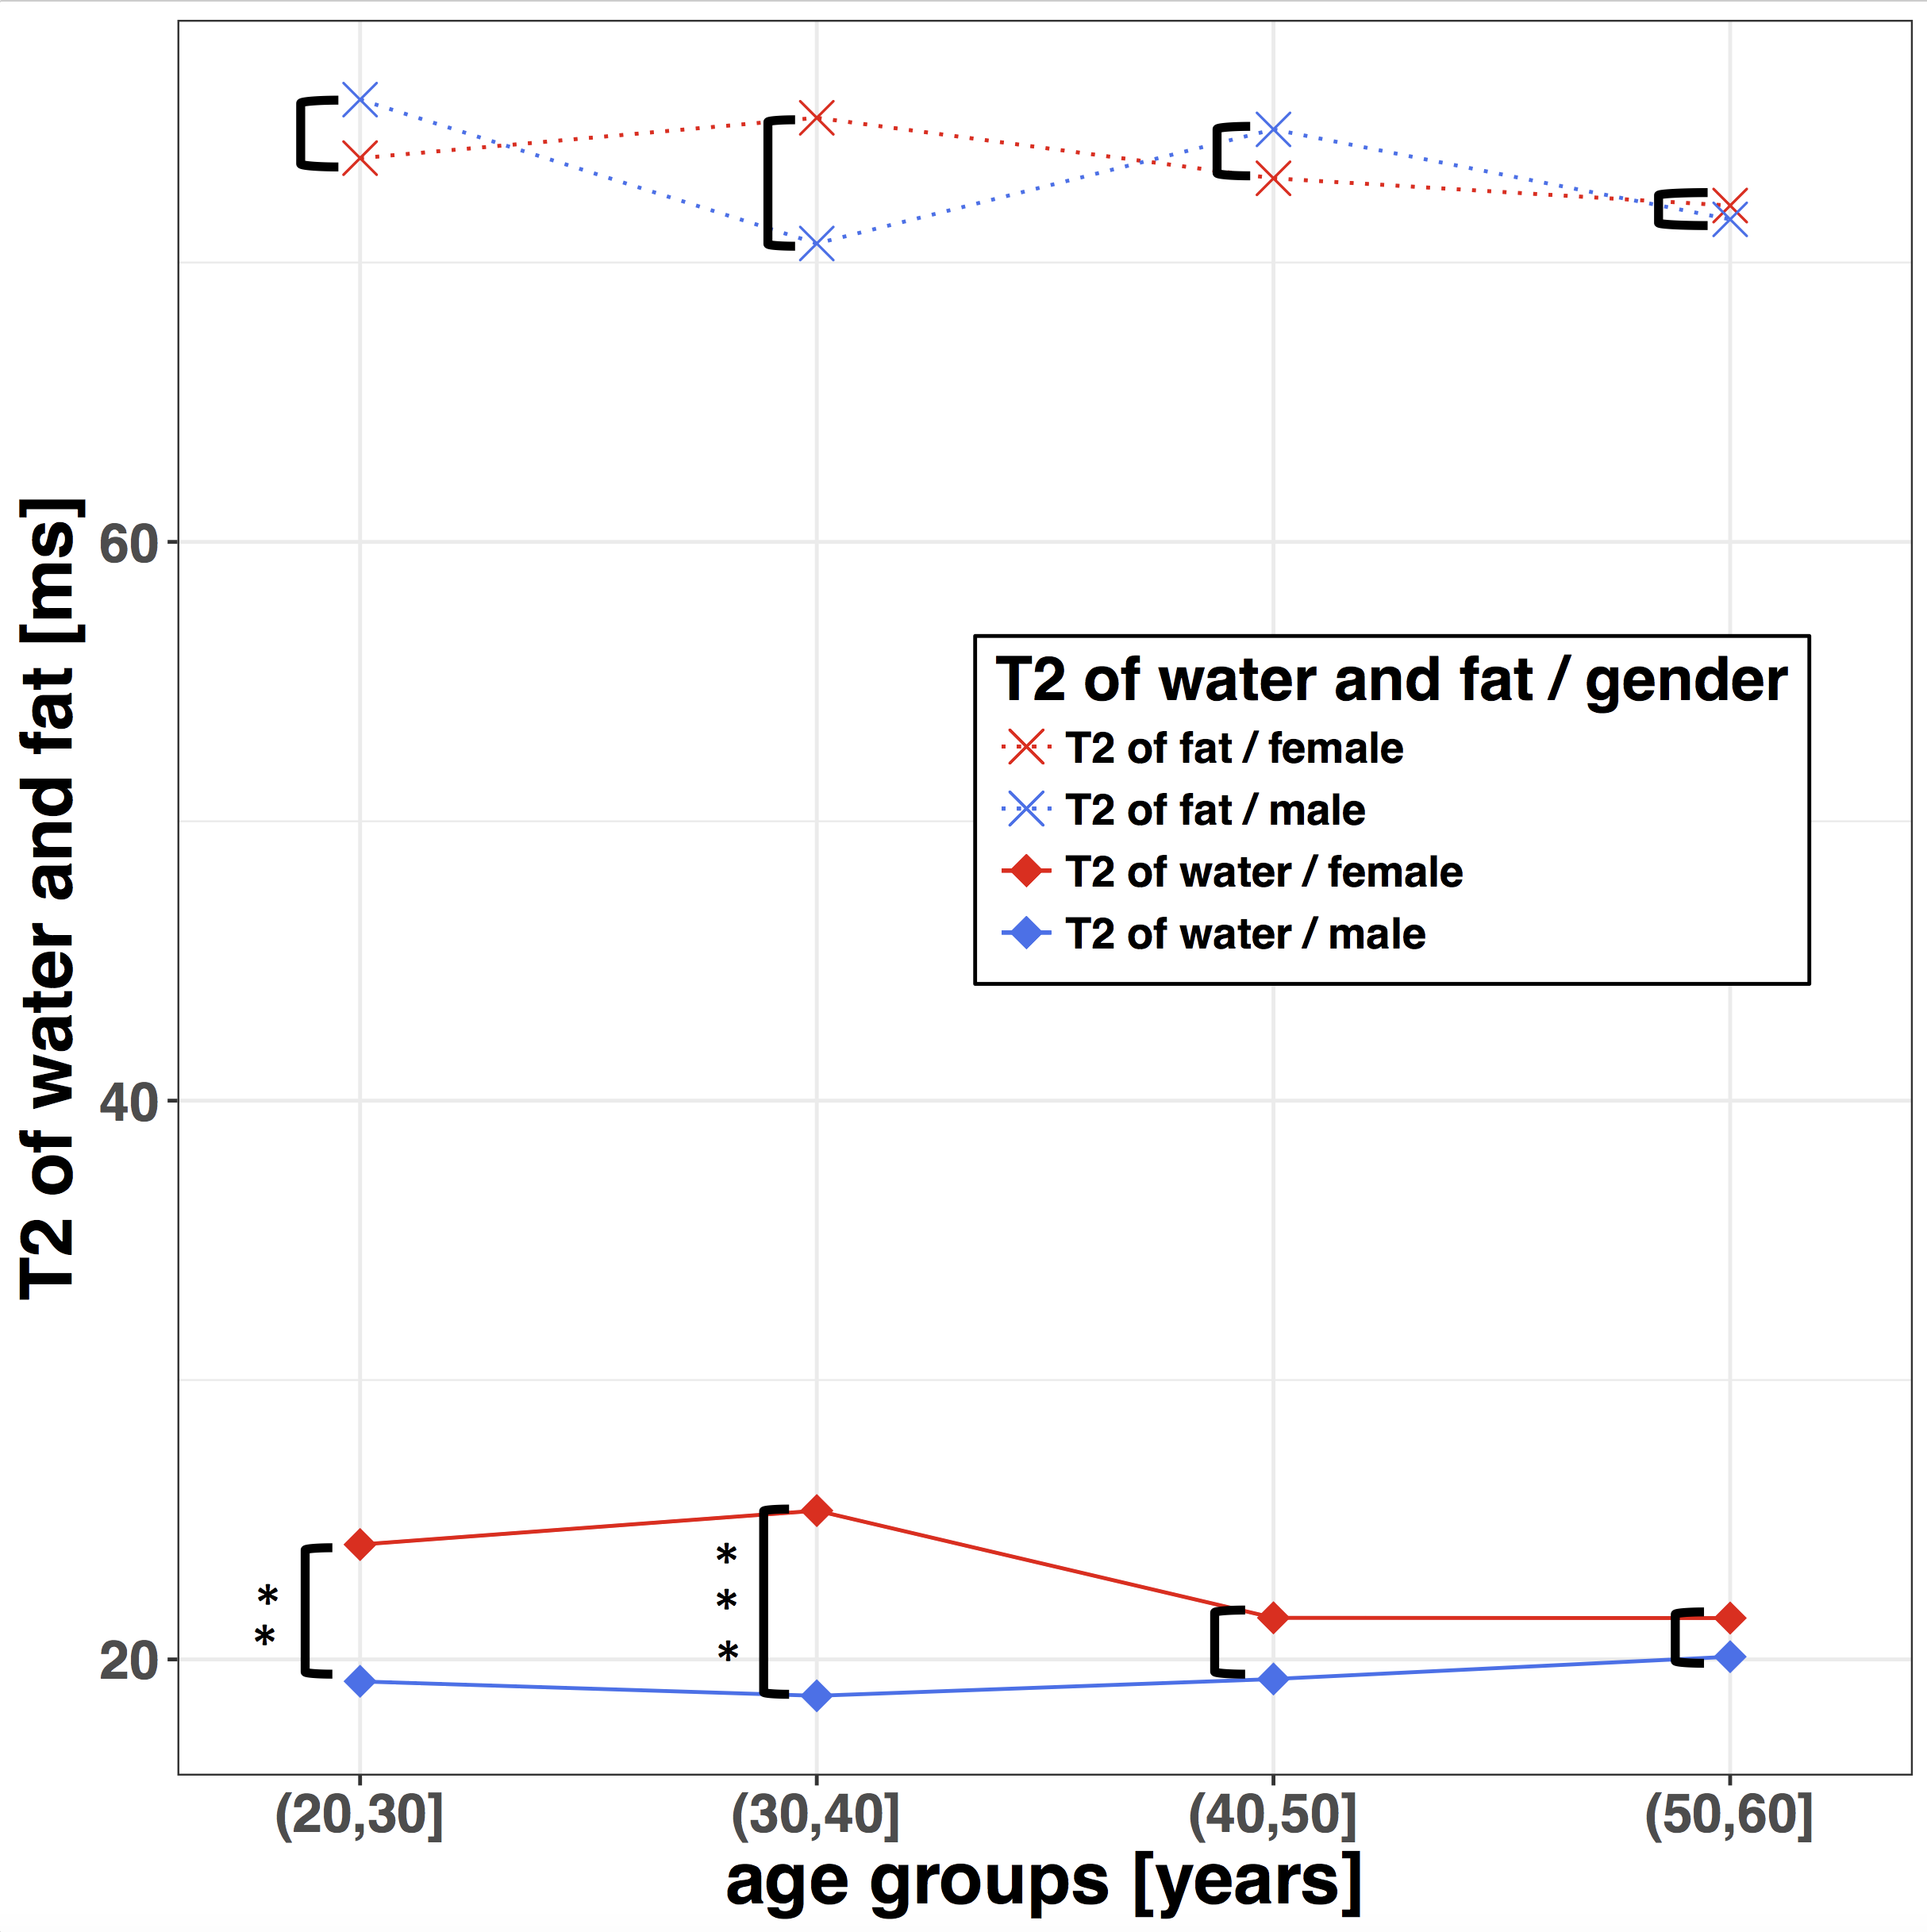
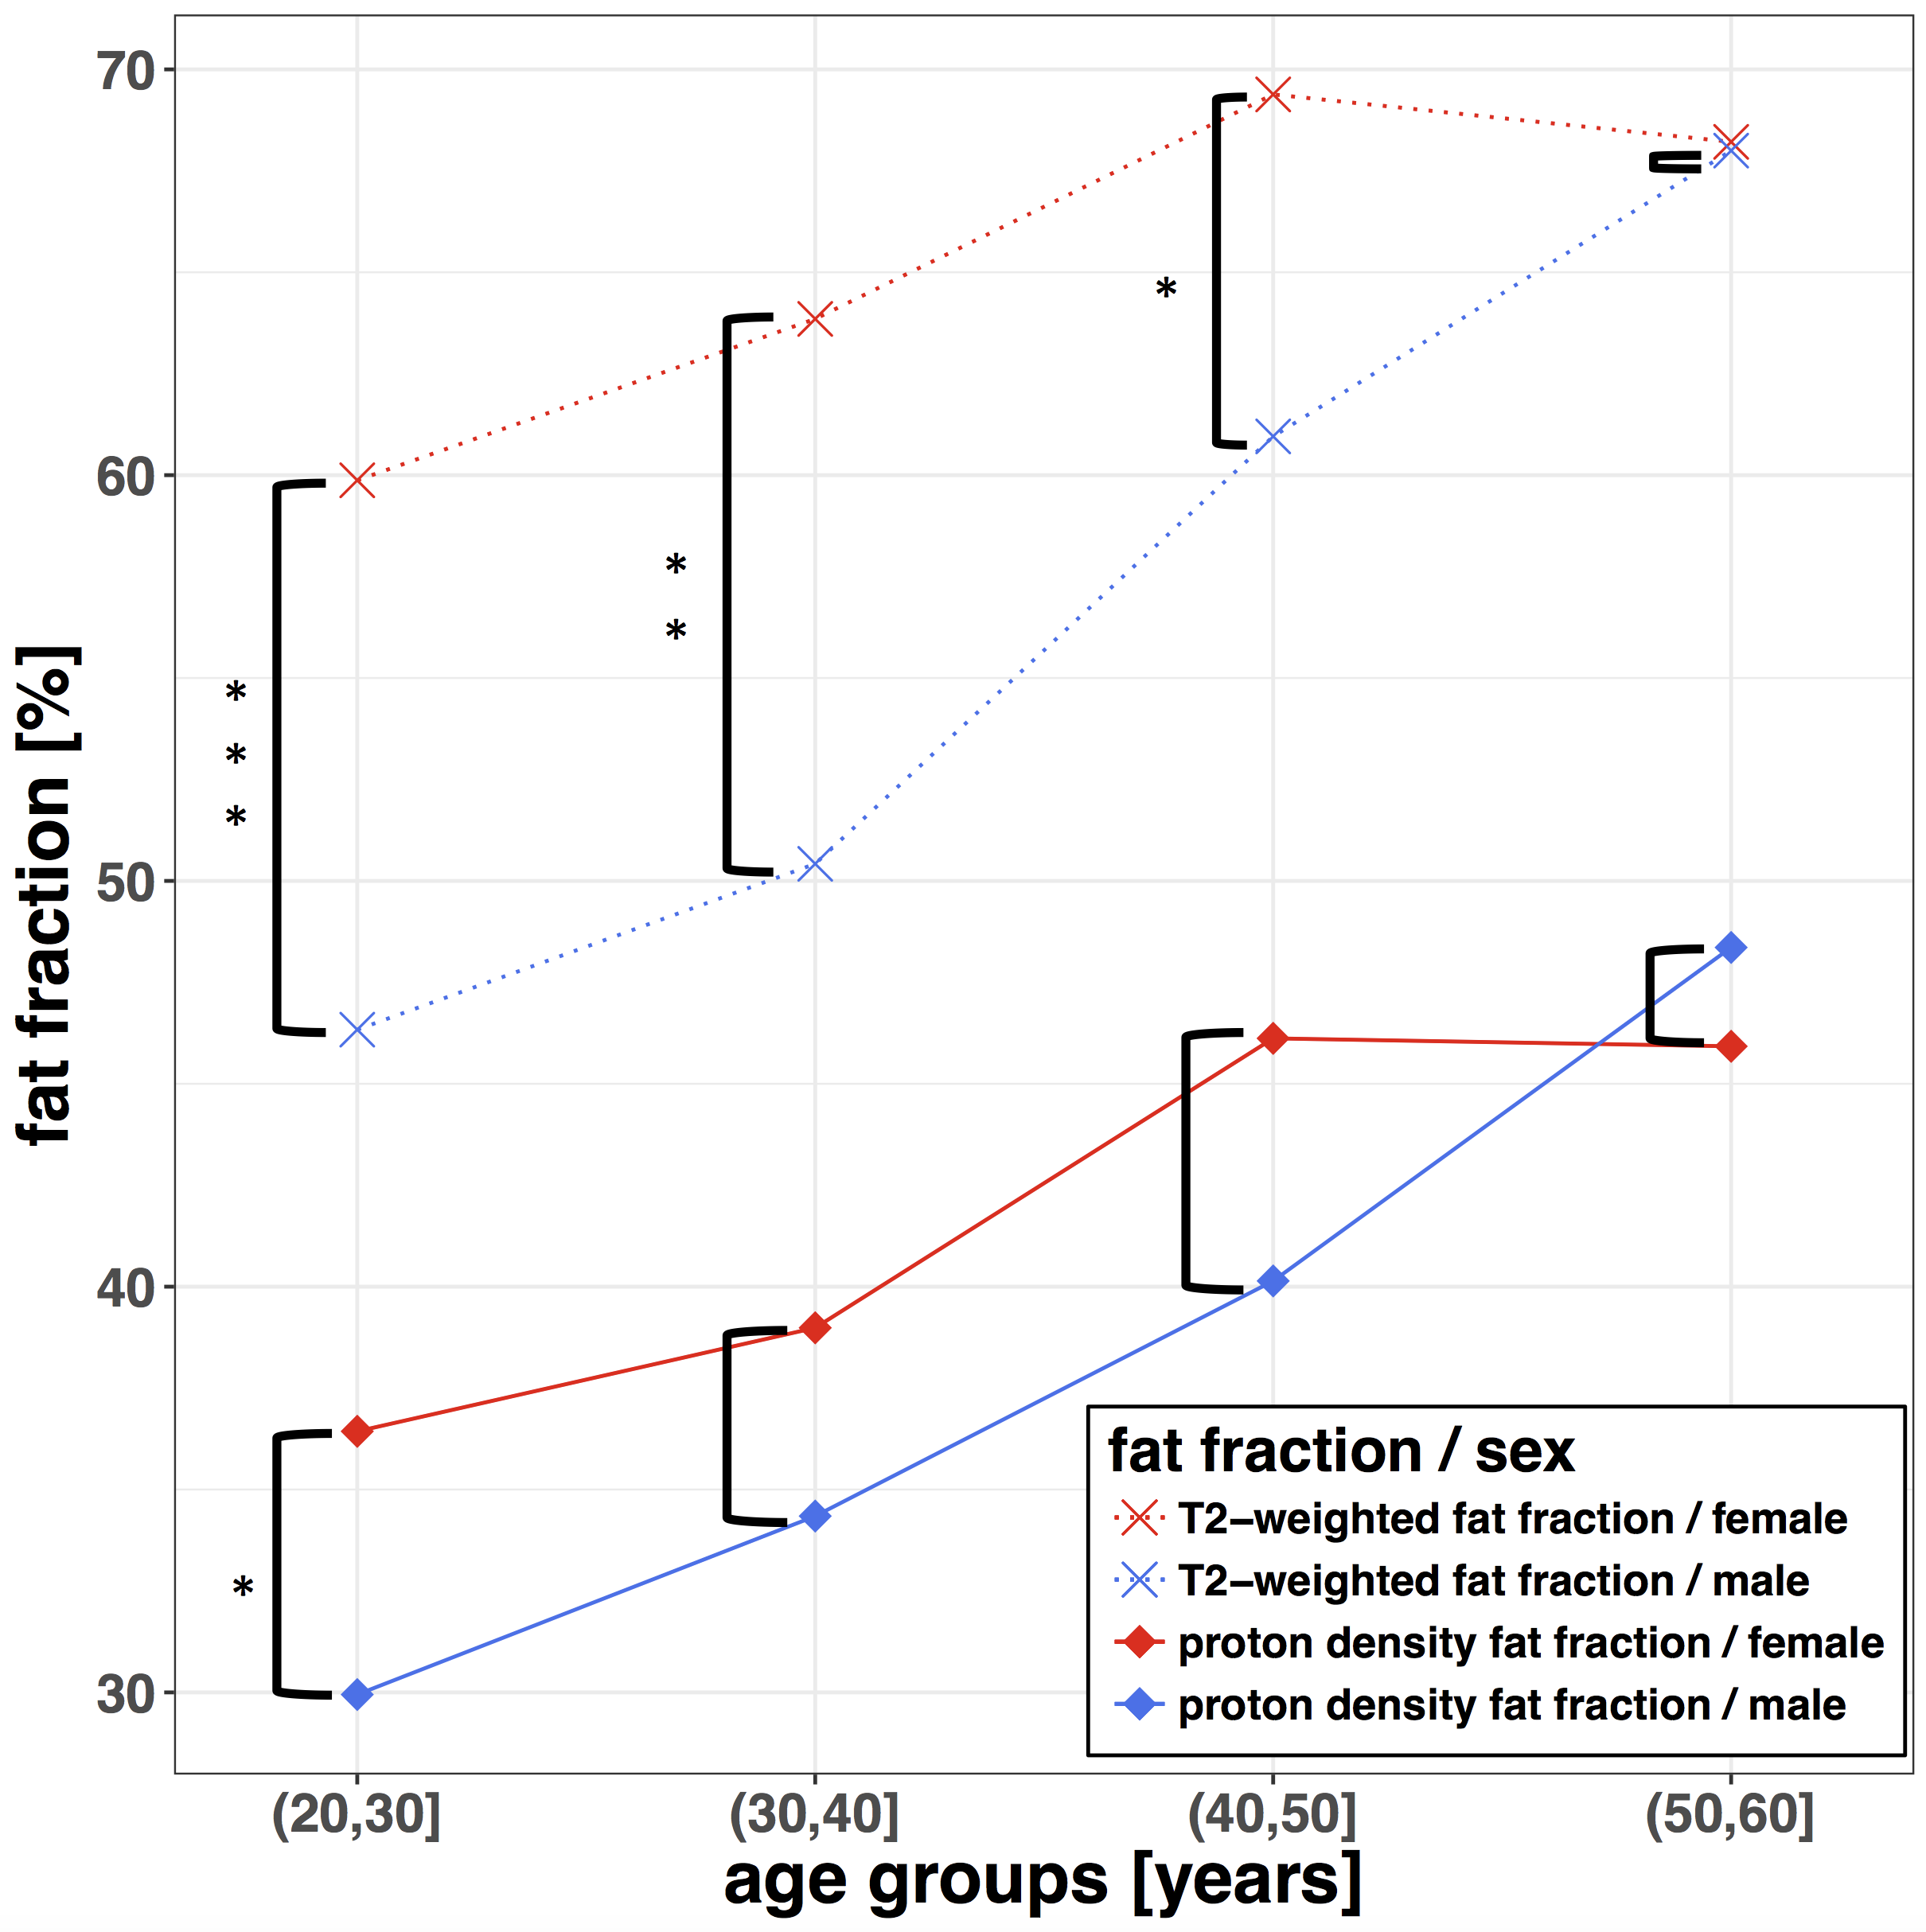
T2-decay of water showed a negative correlation with PDFF in both sex groups (Fig 2). T2 of water showed a significant difference between males and females in the age-groups 20–30(m:19.2ms, f:24.1ms; p<0.01) and 30–40(m:18.7ms, f:25.3ms; p<0.001)(Fig 3). Older subjects showed no significant T2 difference between the sex groups. Female subjects showed a significant decrease of the T2 of water (p < 0.05) between the age-groups 30–40 (f:25.3ms) and 40–50 (f:21.5ms), respectively. There was no significant sex-dependent difference in the T2 of fat in any considered age-group. The T2-weighted FF showed a significant difference (p < 0.001) between male and female subjects in the age group 20–30(m:59.9%, f:46.3%). In this age group, also the sex-dependent difference in PDFF (m:36.4%, f:29.9%) was significant (p < 0.05) (Fig 2). The T2-weighted FF sex-dependent difference was significant in the age groups 30–40 (m:63.9%, f:50.4%; p < 0.01) and 40–50 (m:69.4%, f:61.0%; p <0.05), respectively. In the age group 50–60, the T2-weighted FF (m:68.2%, f:68.0%) showed no significant sex-dependent difference. There was no significant sex-dependent PDFF difference in the age-groups 30–40 (m:39.0%, f:34.3%), 40–50 (m:46.1%, f:40.1%) and 50–60 (m:45.9%, f:48.4%) , respectively.Discussion and Conclusion
The reported results confirmed some of the previous results by Dieckmeyer et al. 4 in a larger subject cohort showing that T2 of water is negatively associated with PDFF in females. Additionally, it was shown that there is a negative correlation between the T2-relaxation time of water and PDFF not only in female, but also in male subjects. A sex-dependent difference in water T2-relaxation times was found for subjects under 40 years. Above the age of 40 years, the water T2-relaxation time difference between male and female subjects decreased, with the water T2-relaxation time decreasing with age in females and remaining constant with age in males. The abovementioned sex difference in the age dependence of the T2-relaxation time of water results in a faster increase of the T2-weighted FF with age in females compared to males. The slope of the age dependence of VBM PDFF is similar for male and female subjects, but starts with a lower PDFF for females than for males at younger ages. In conclusion, VBM water T2-relaxation times of water are both sex-dependent and age-dependent and therefore required a multi-TE MRS measurement to remove T2-weighting effects and to quantitatively measure VBM PDFF.Acknowledgements
The present work was supported by the European Research Council (grant agreement No 677661 –ProFatMRI) and Philips Healthcare.References
1Cordes et al. “MR-based assessment of bone marrow fat in osteoporosis, diabetes, and obesity”. In Frontiers in endocrinology (06.2011)
2Kugel et al.: “Age- and sex-specific differences in the 1H-spectrum of vertebral bone marrow.” In Journal of Magnetic Resonance Imaging (02.2001)
3Griffith et al. ”Bone marrow fat content in the elderly: a reversal of sex difference seen in younger subjects.” In Journal of Magnetic Resonance Imaging
4Dieckmeyer et al. “The need for T2 correction on MRS-based vertebral bone marrow fat quantification: implications for bone marrow fat fraction age dependence”. In: NMR in Biomedicine (04.2015)
5Hamilton et al. “In vivo characterization of the liver fat 1H MR spectrum”. In: NMR in biomedicine (07.2011), pp. 784–790.
Figures