5162
Estimating vertebral bone marrow triglyceride unsaturation based on the extraction of the olefinic peak in short-TE STEAM MRS using a constrained fitting model1Department of Diagnostic and Interventional Radiology, Technical University of Munich, Munich, Germany, 2Department of Nutritional Medicine, Technical University of Munich, Freising, Germany, 3Department of Diagnostic and Interventional Neuroradiology, Technical University of Munich, Munich, Germany
Synopsis
The measurement of vertebral bone marrow triglyceride unsaturation using single-voxel STEAM MRS serves as a potential biomarker for bone health. The required quantifiction of the olefinic fat peak (OFP) is often prevented by an overlapping water signal. The aim of this study was to investigate the feasibility of measuring the OFP by defining a quantification reliability measure (QRM) based on the comparison of two constrained triglyceride models. Result: The feasibility of estimating the OFP depends on the water linewidth and proton density fat fraction, increases with the QRM and may not be achievable if the water peak and OFP are not intercepting.
Purpose
Vertebral bone marrow (VBM) fat unsaturation has been proposed as a potential biomarker in assessing bone health in patients with osteoporosis and bone diseases1-3. Traditionally, the measurement of VBM fat unsaturation has been performed based on the extraction of the olefinic fat peak (OFP) using short-TE STEAM MRS. However, VBM is embedded within the cavities of the trabecular bone matrix and is therefore characterised by broad peak linewidths4. In addition, especially in younger subjects, the dominant water peak is preventing the extraction of the surrounding olefinic and glycerol fat peaks4. It is therefore unknown which range of proton density fat fractions (PDFF) and water peak linewidths, allows a feasible OFP extraction. Recently, a constrained triglyceride model5 based peak fitting has been proposed in adipose tissue regions6. Therefor, the purpose of the present study was to define the range of bone marrow fat fractions and linewidths for which the extraction of the OFP appears to be feasible using the comparison of two fitting models.Methods
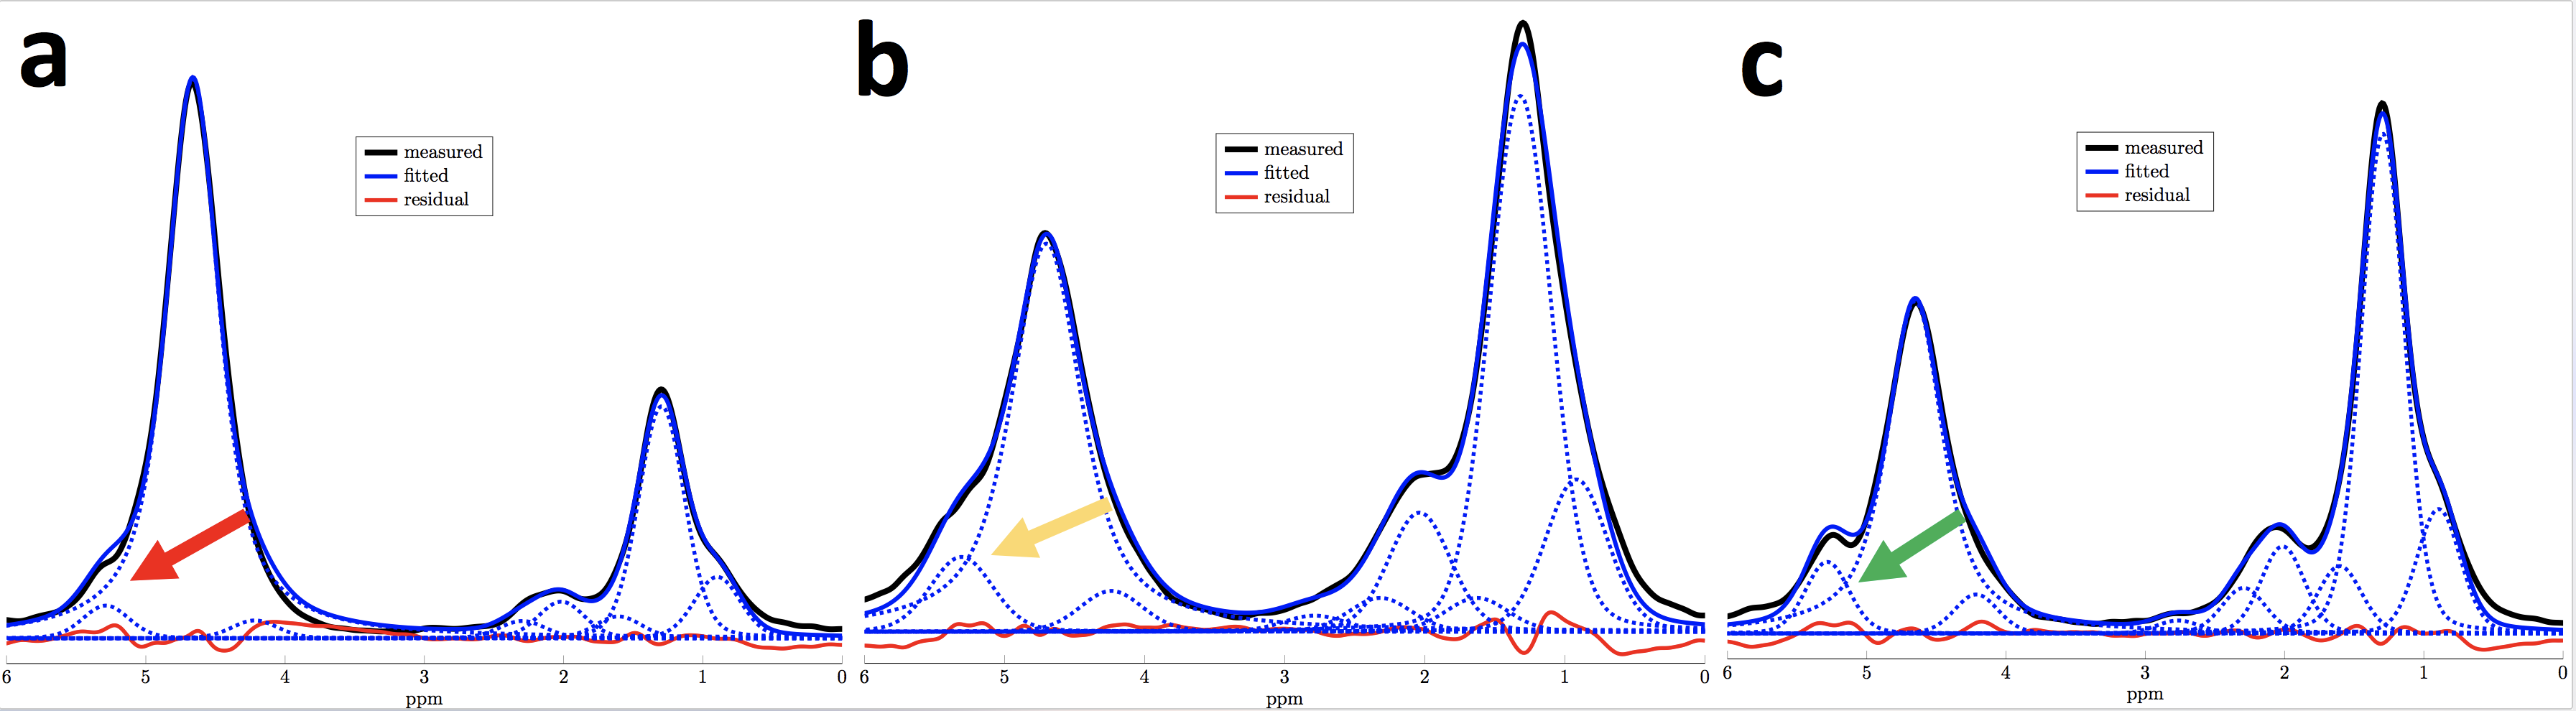
For this study, 244 subjects with no history of pathological bone changes underwent single-voxel STEAM MRS (TR = 6000ms, TM = 16ms, VOI = 15x15x15mm3, 8 repetitions per TE) at 4 TEs (TE = 11/15/20/25ms) of the VBM at the trabecular compartment of the L5 vertevra on a 3T scanner (Ingenia, Philips Healthcare) using the built-in-table posterior coil. Three 9-peak fitting models were applied: Model 1: constrained olefinic and glycerol peak using all TEs4; Model 2: unconstrained OFP and constrained glycerol peak using TE = 11ms only; Model 3: triglyceride model proposed by Hamilton et al.6 fitting for the number of double bonds (ndb) and number of methylene-interrupted double bonds (nmidb)6 with a fixed chain-length of 17.337using TE = 11ms only. Spectra were grouped based on QRM (Fig. 1) which was defined as:
QRM = (Signal(OFP) - Signal(intercept-location)) / Signal(OFP)
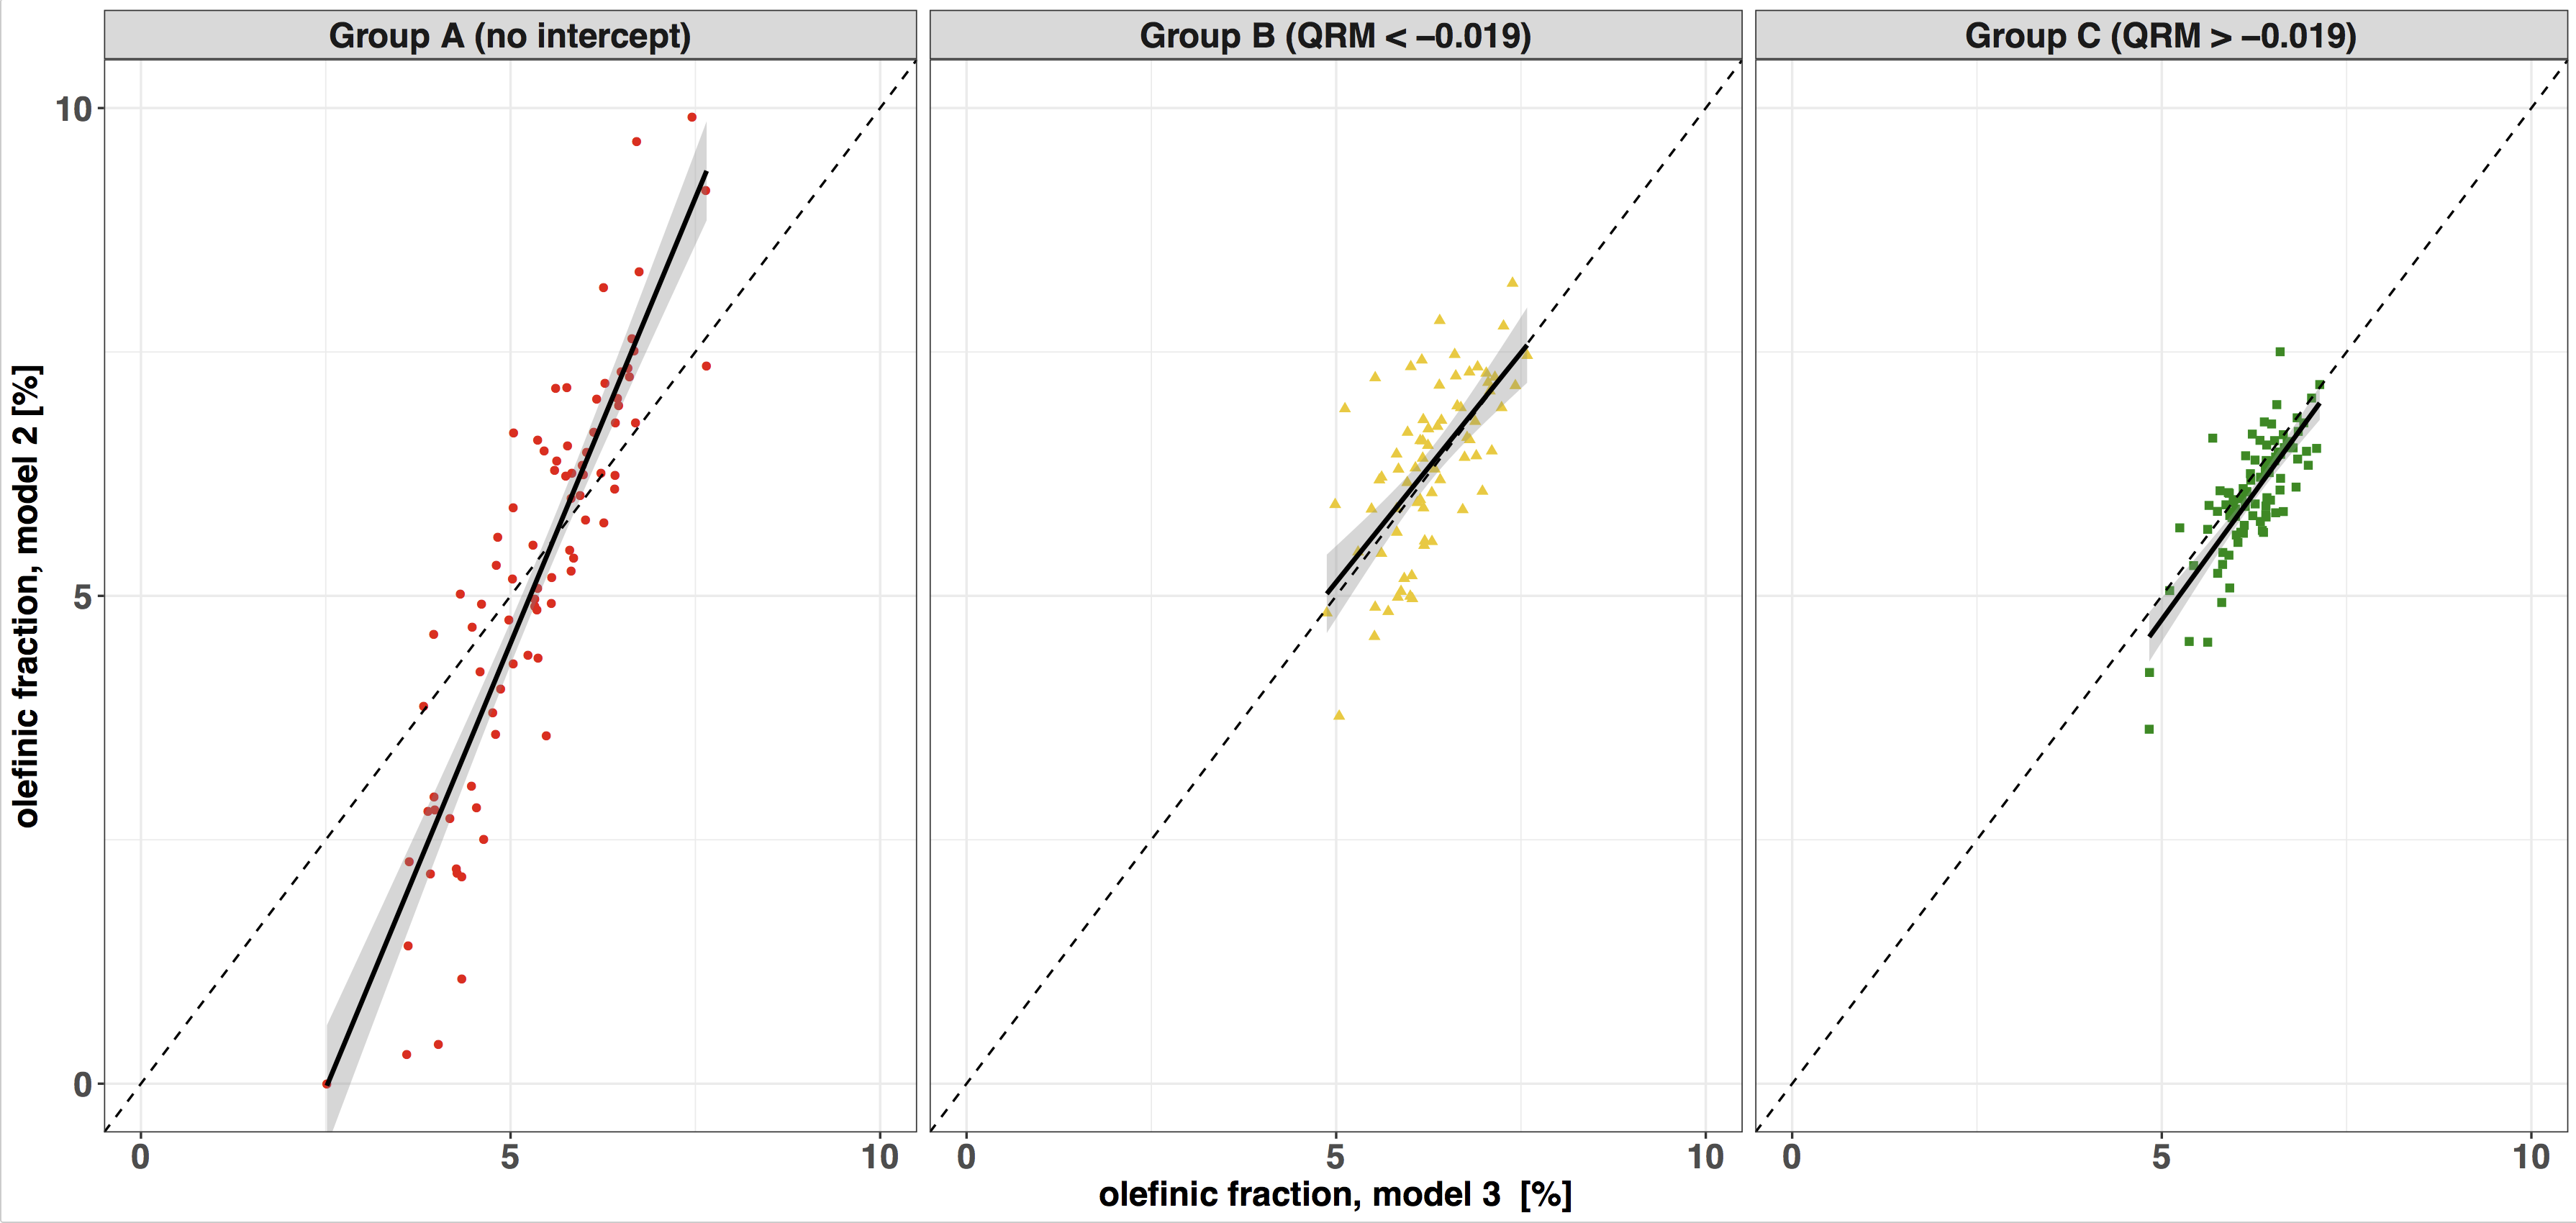
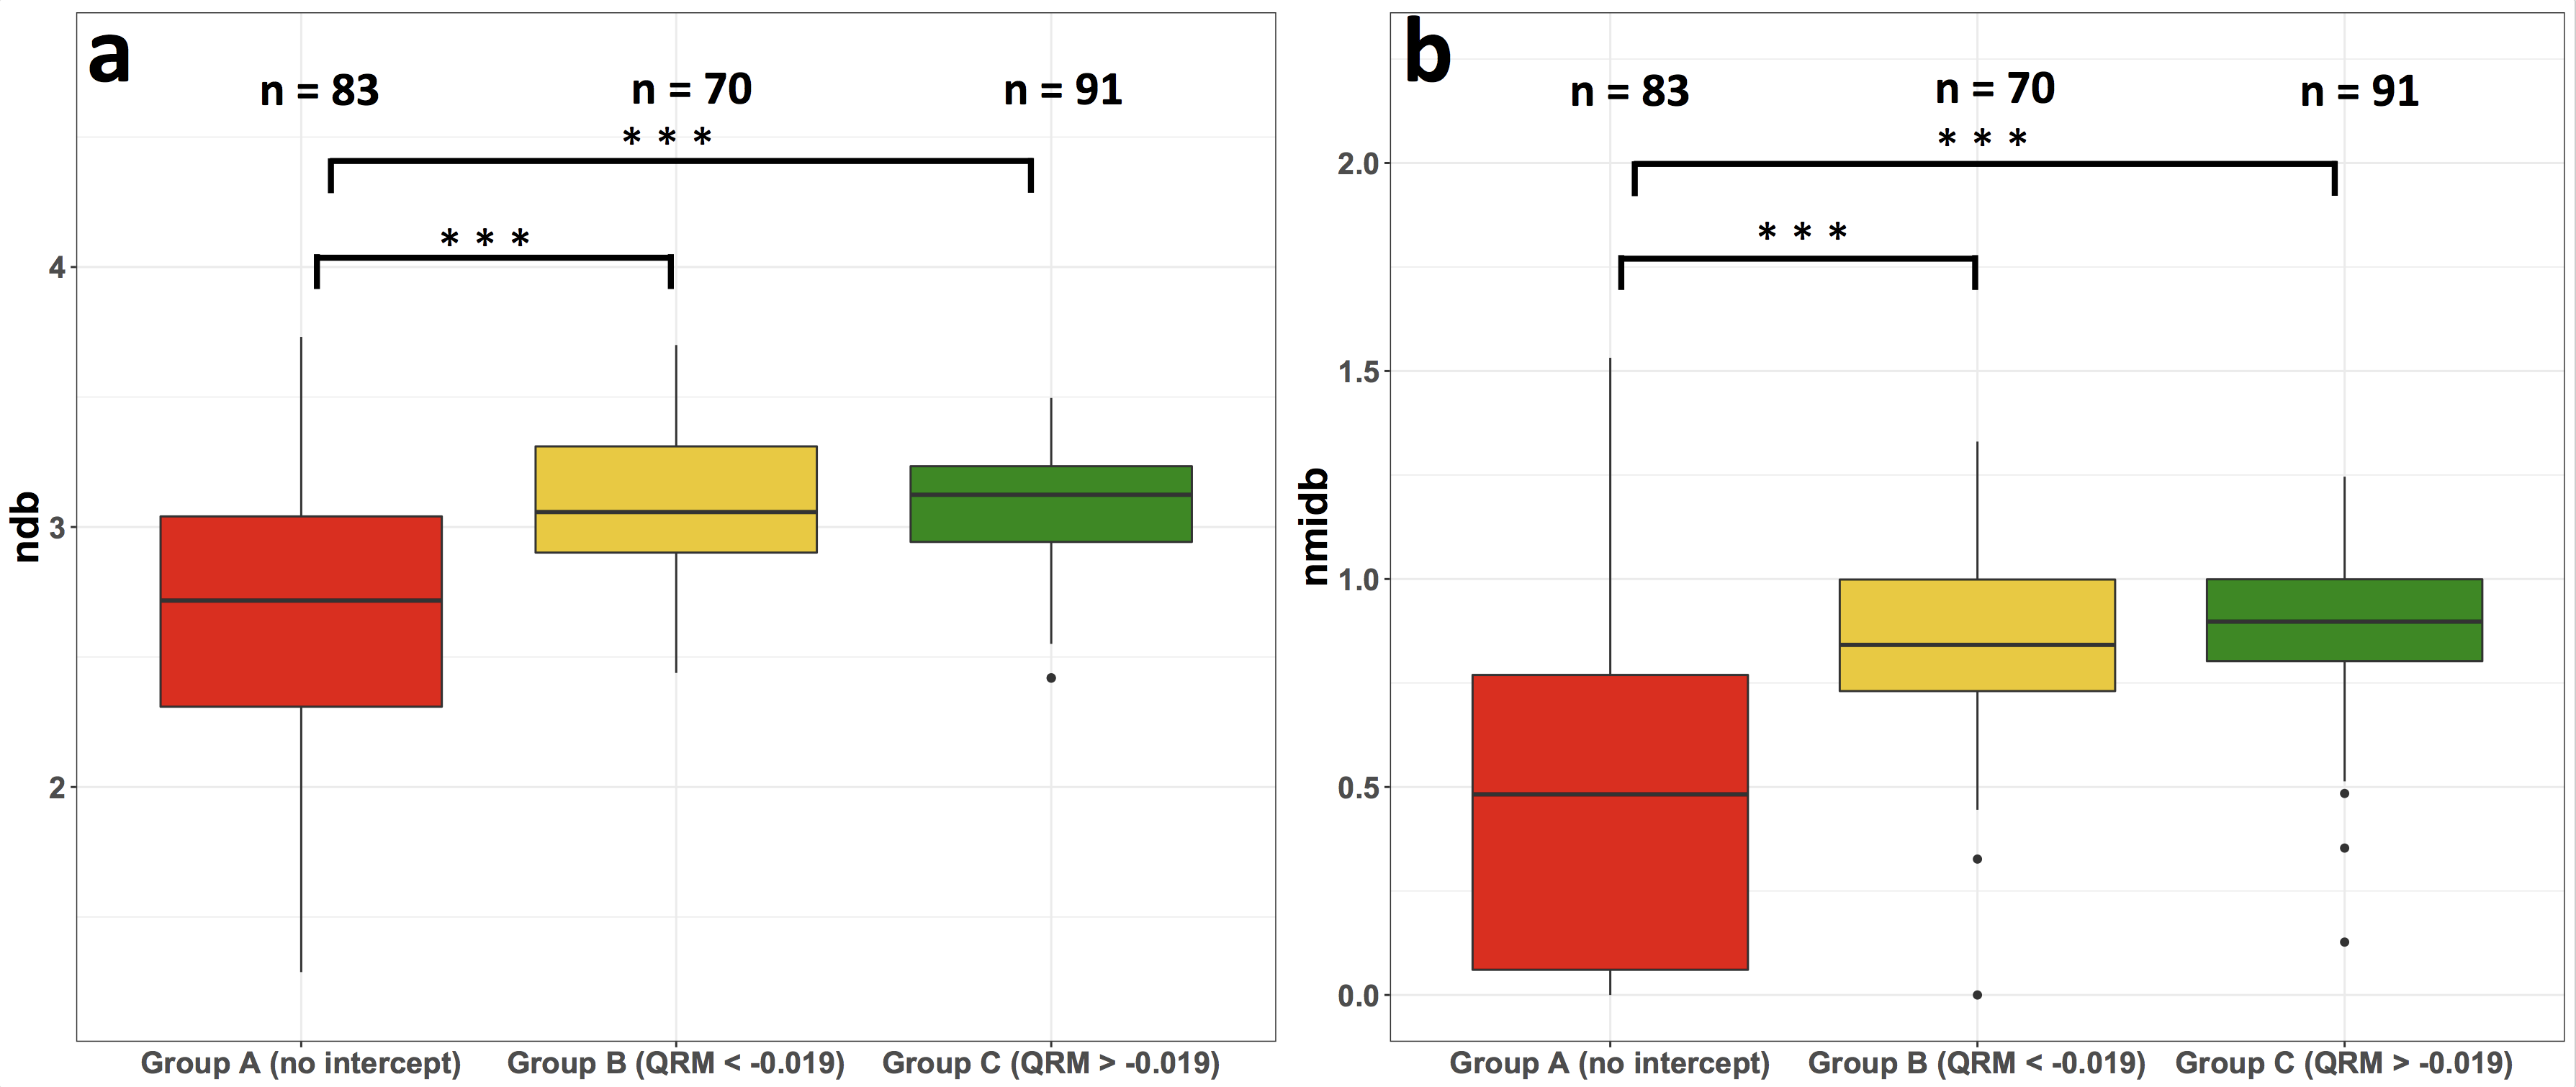
Three groups were defined based on the QRM cut-off value of –0.019: A (Fig. 2a): no intercept of fitted water peak and olefinic peak (n = 83); B (Fig. 2b): QRM < –0.019 (n = 70); and C (Fig. 2c): QRM > –0.019 (n = 91) (Fig.2). The optimal cut off value of QRM was calculated by maximizing R2 and minimizing the absolute differences to the identity line, for the olefinic fraction (OF) measures of model 2 against model 3 (Fig. 4). The OF was defined as the ratio of the OFP area divided by the sum of all fat peak areas. Ndb and nmidb (Fig. 5) were calculated using model 3.
Results
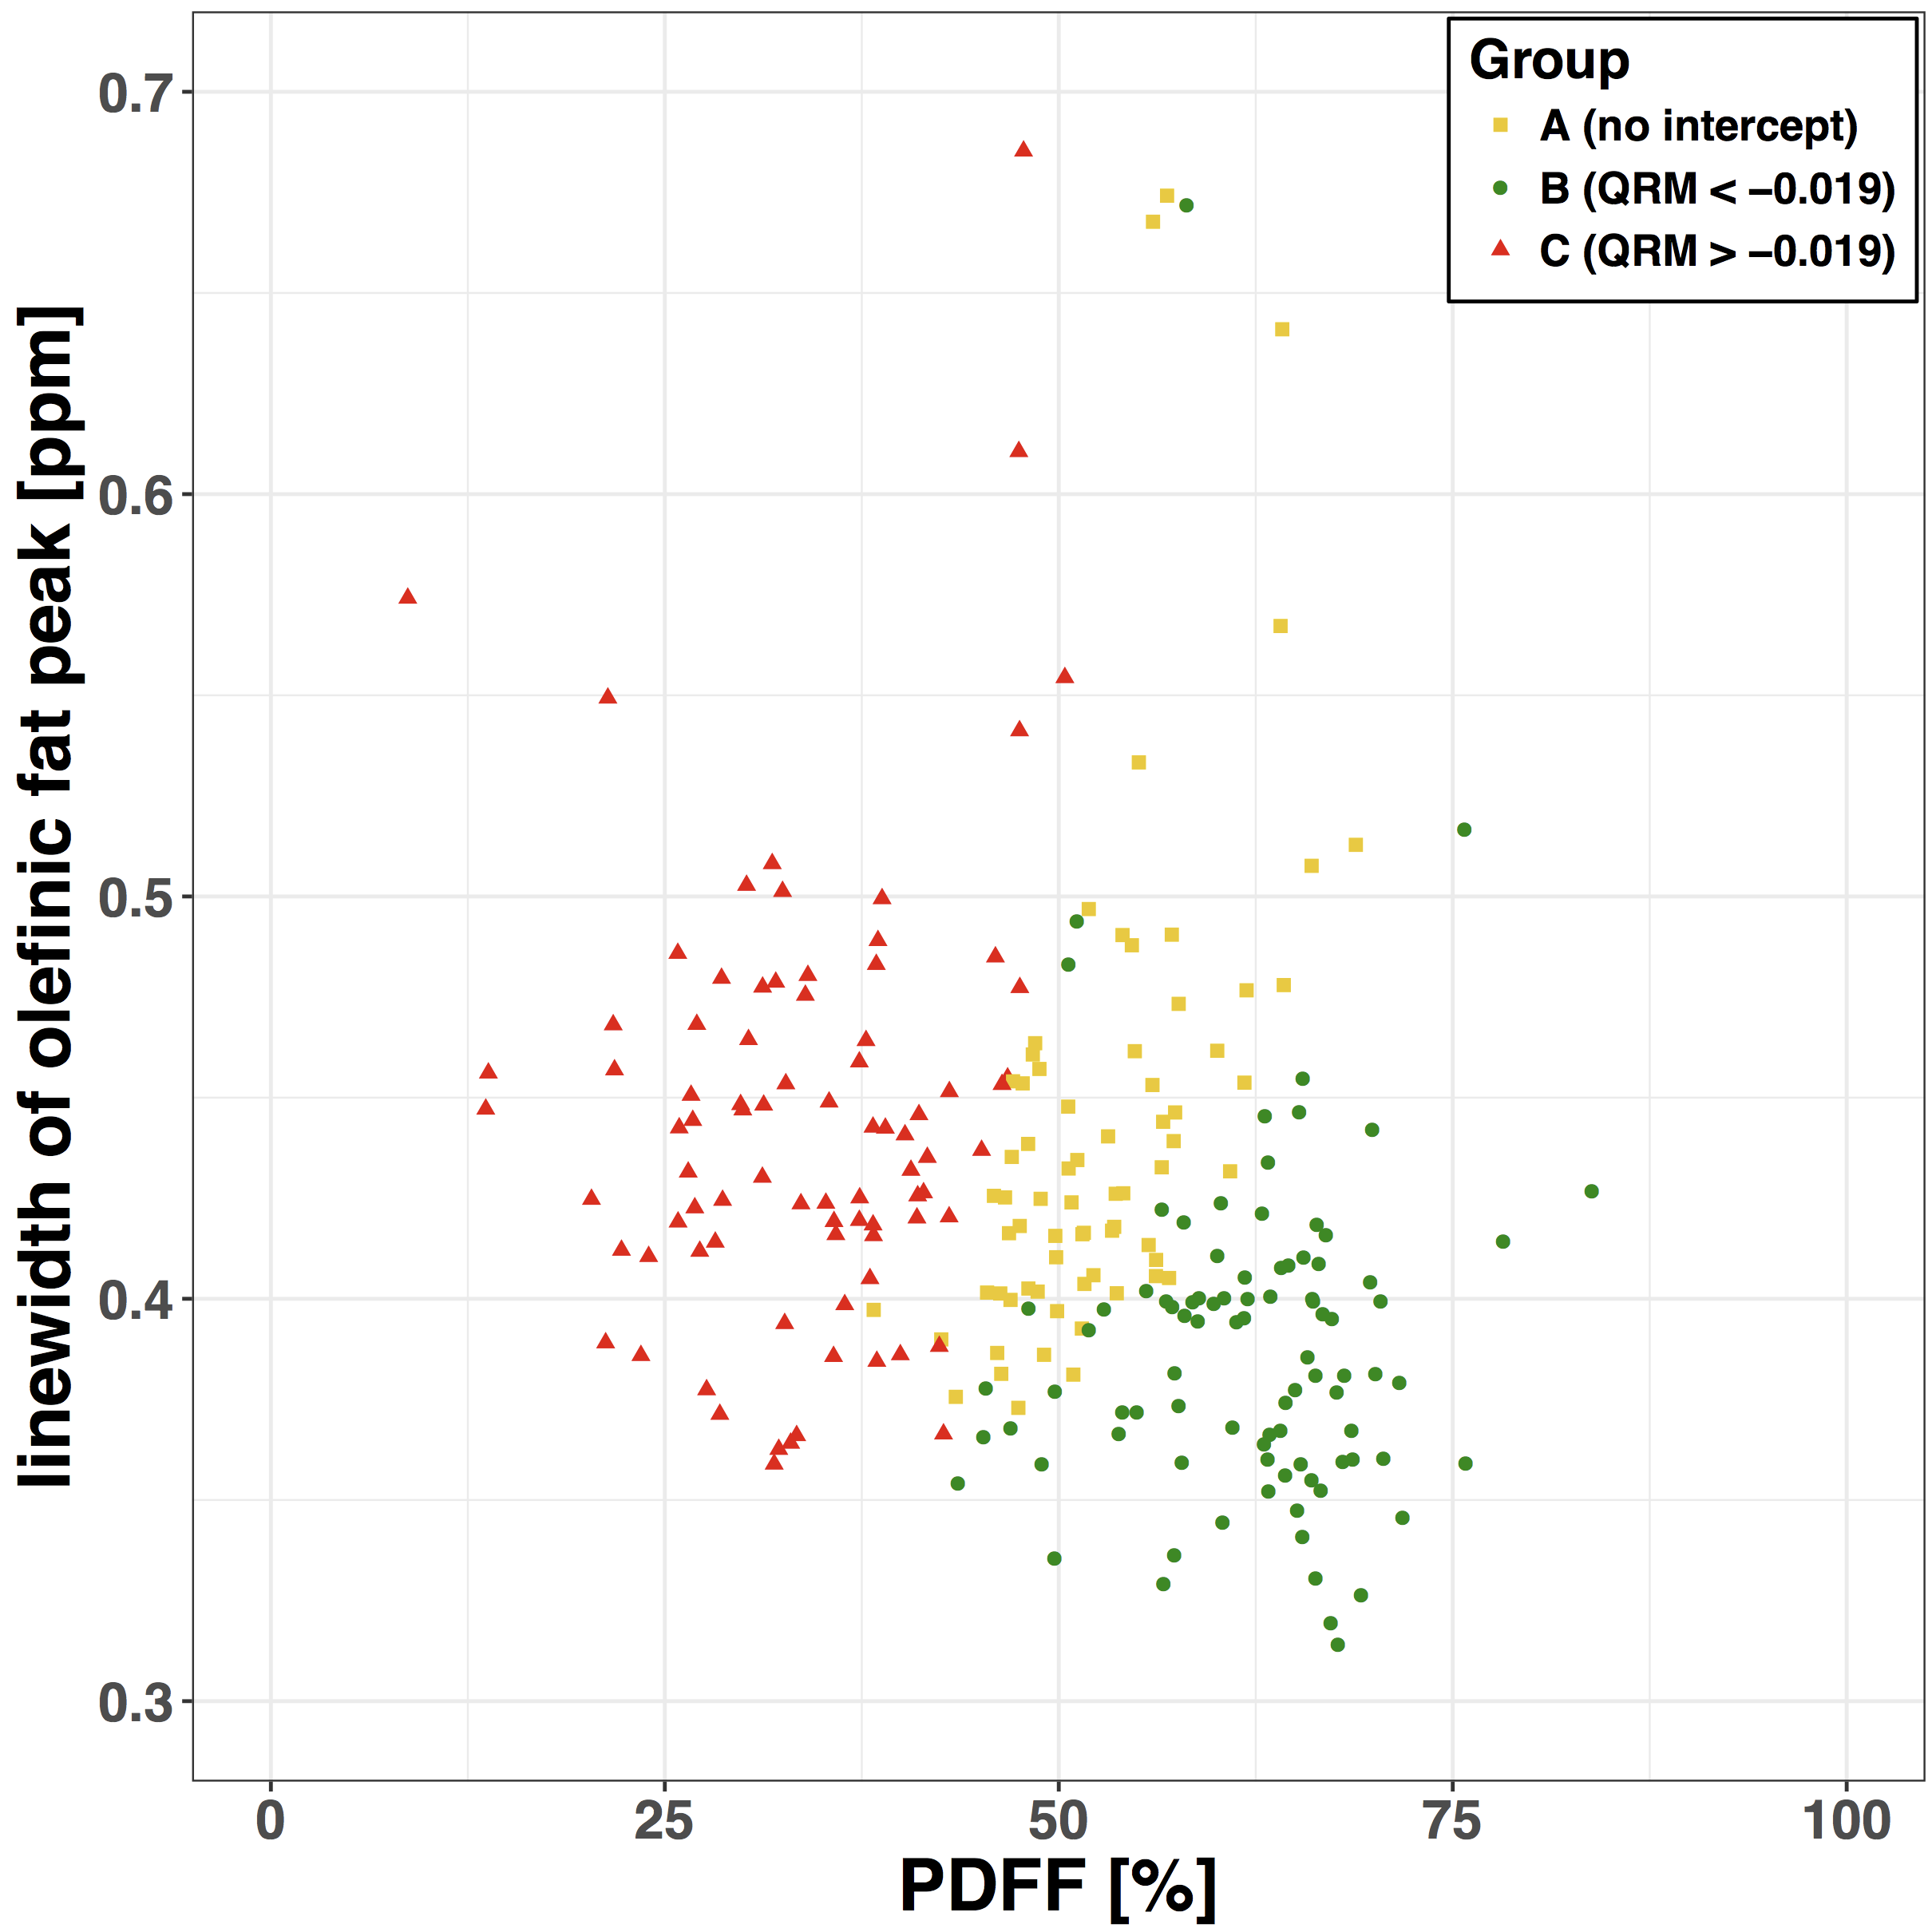
QRM depends on the water linewidth and the PDFF(Fig. 3). Measured PDFF was significantly (p<0.01) different between all groups A, B and C. The linewidth of water was significantly (p<0.001) different between groups C versus B and C versus A, respectively, but not significantly (p>0.05) different between group B versus C. The extracted OF using model 2 and model 3 (Fig. 4) showed following statistically significant (Student’s t-test, p<0.01) correlations: A (slope = 1.83; intercept = –4.61, R2 = 0.80), B (slope = 0.94, intercept = 0.44, R2 = 0.42), C (slope = 1.04, intercept = –0.44, R2 = 0.62 ). Measured ndb and nmidb in groups B (ndb = 3.1 ± 0.29, nmidb = 0.85±0.25) and C( ndb = 3.1 ± 0.22, nmidb = 0.88 ± 0.18) are significantly (p<0.001) different compared to group A (ndb = 2.7 ± 0.49, nmidb = 0.48 ± 0.39) after adjusting for sex, age and BMI in a multivariable linear regression model (Fig 5.). Differences of ndb and nmidb between group B and group C were not statistically significant (p>0.05).Discussion & Conclusion
Groups A, B and C were defined based on a cut-off value of QRM = –0.019 found by maximising the agreement between model 2 and model 3. Highest agreement between model 2 and model 3 measuring the OF was achieved in group C followed by group B and A. This result indicated that an olefinic–water intercept is required to quantify the OFP; otherwise a model-dependent bias occurs. Therefore, measurements with no intercept of the water peak and the OFP (group A) the quantification of the OFP not be feasible. As a consequence, measured ndb and nmidb in group A showed lower mean values and higher standard deviations compared to groups B and C, as well as reported literature 7, respectively. In conclusion, the feasibility of estimating triglyceride unsaturation based on the extraction of the OFP depends on water linewidth and PDFF. A missing intercept between the water and the OFP may prevent reliable OFP quantification, while an QRM > –0.019 was found to be optimal.Acknowledgements
Acknowledgement: The present work was supported by the European Research Council (grant agreement No 677661 –ProFatMRI) and Philips Healthcare.References
1 A. V. Schwartz, “Marrow fat and bone: review of clinical findings.,” Front. Endocrinol., vol. 6, no. 107, p. 40, 2015.
2 J. M. Patsch, X. Li, T. Baum, S. P. Yap, D. C. Karampinos, A. V. Schwartz, and T. M. Link, “Bone marrow fat composition as a novel imaging biomarker in postmenopausal women with prevalent fragility fractures.,” J. Bone Miner. Res., vol. 28, no. 8, pp. 1721–1728, Aug. 2013.
3 D. K. W. Yeung, J. F. Griffith, G. E. Antonio, F. K. H. Lee, J. Woo, and P. C. Leung, “Osteoporosis is associated with increased marrow fat content and decreased marrow fat unsaturation: a proton MR spectroscopy study.,” J Magn Reson Imaging, vol. 22, p. 285, Aug. 2005.
4M. Dieckmeyer, S. Ruschke, C. Cordes, S. P. Yap, H. Kooijman, H. Hauner, E. J. Rummeny, J. S. Bauer, T. Baum, and D. C. Karampinos, “The need for T₂ correction on MRS-based vertebral bone marrow fat quantification: implications for bone marrow fat fraction age dependence.,” NMR Biomed, vol. 28, no. 4, pp. 432–439, Apr. 2015.
5 G. Hamilton, G. Hamilton, T. Yokoo, T. Yokoo, M. Bydder, M. Bydder, I. Cruite, I. Cruite, M. E. Schroeder, M. E. Schroeder, C. B. Sirlin, C. B. Sirlin, M. S. Middleton, and M. S. Middleton, “In vivo characterization of the liver fat ¹H MR spectrum.,” NMR Biomed, vol. 24, no. 7, pp. 784–790, Aug. 2011.
6 G. Hamilton, A. N. Schlein, M. S. Middleton, C. A. Hooker, T. Wolfson, A. C. Gamst, R. Loomba, and C. B. Sirlin, “In vivo triglyceride composition of abdominal adipose tissue measured by 1H MRS at 3T,” J Magn Reson Imaging, vol. 45, no. 5, pp. 1455–1463, May 2017.
7 M. Bydder, O. Girard, G. Hamilton, and G. Hamilton, “Mapping the double bonds in triglycerides.,” Magn Reson Imaging, vol. 29, no. 8, pp. 1041–1046, Oct. 2011.
Figures