5160
Femoral Head Perfusion Color Mapping using DCE-MRI in Slipped Capital Femoral Epiphysis: Preliminary Experience1Radiology, Chiba Children's Hospital, Chiba, Japan, 2Orthpedic Surgery, Chiba Children's Hospital, Chiba, Japan, 3Radiology, Chiba Cancer Center, Chiba, Japan
Synopsis
There is no established method for diagnosing femoral head necrosis before surgery, because it is difficult to predict AN due to SCFE. In this study, we propose a scheme and optimization to evaluate the femoral head perfusion in children with SCFE. Our objective is to optimize DCE-MRI and to provide useful color maps for diagnosing the femoral head perfusion.Femoral head perfusion color mapping using DCE-MRI in SCFE is useful for decision of surgical treatment method. Color maps of positive enhancement integral and maximum slope of increase contributes to evaluation of perfusion status.
Background and Purpose
Slipped capital femoral epiphysis (SCFE) is one of the childhood lesion about hip joint to appear most commonly on the boys of the elementary and junior high school student. To diagnose avascular necrosis (AN) of the femoral head which could be caused by SCFE has a major influence on treatment strategy and prognosis. Whereas, there is no established method for diagnosing femoral head necrosis before surgery, because it is difficult to predict AN due to SCFE. Recently there have been reports about usefulness of dynamic contrast-enhanced magnetic resonance imaging (DCE-MRI) to evaluate femoral head perfusion. It is also reported that DCE-MRI could be applied to SCFE.1 In this study, we propose a scheme and optimization to evaluate the femoral head perfusion in children with SCFE. Our objective is to optimize DCE-MRI and to provide useful color maps for diagnosing the femoral head perfusion taking into account the clinical cases of 3 patients.Methods
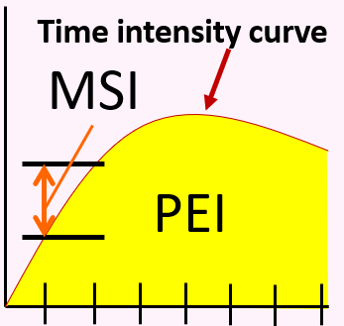
Theory of perfusion color mapping: DCE-MRI was a promising method for quantitative assessment of perfusion imaging. In this study, we calculated 2 types of perfusion color mapping such as Positive Enhanced Integral (PEI) and Maximum Slope of Increase(MSI). (Figure 1) The PEI value was obtained to calculate the signal integration as time intensity carve (TIC) by DCE-MRI as follows equation; PEI value =∑ SIi where SIi is signal intensity (SI) at a given time phase. The MSI value was to calculate maximum value obtained a function of the slopei as follows equation; MSI value = 0, N (slopei), where slopei was to calculate the slope of SI at each time phase index i as follows equation; slopei = SIi+1 – SIi. Color mapping of PEI will be expected to visualize overall contrast enhancement during dynamic time. However, MSI will be expected to visualized degree of wash-in until time to peak of TIC.
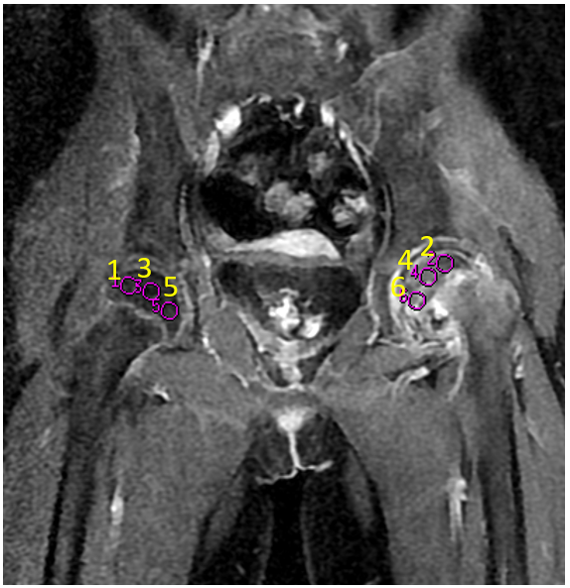
Clinical Experience: Three patients with SCFE before surgery were subjects of this study. (Male/Female = 1/2, mean age = 11.7 years old) All subjects were scanned by 1.5 Tesla MRI scanner with 8ch cardiac coil; Signa excite Ver. 12 (GE Healthcare, Vienna, U. S. A). The DCE-MRI sequence was performed by using LAVA (Liver Acquisition with Volume Acceleration) sequence with SPECIAL. The imaging parameters of DCE-MRI sequence were as follows; LAVA sequence, Coronal section, FOV = 360 * 360 mm, Matrix size = 320 * 224, Slice Thickness/ Gap = 4 mm/ -2 mm, TR/ TE = 4.2/ 2.0 ms, Bandwidth = 83.3 kHz, Fat suppression = SPECIAL. DCE-MRI was scanned until 3-4.5 minutes immediately after administration of a contrast agent. We evaluated perfusion status in the following the ways. That is how 1) we calculated color mapping of PEI and MSI, and 2) we calculated TIC of femoral head both SCFE and healthy sides (Figure 2). All regression algorithms were performed with Functool 11. 3. 03, MR standard (GE Healthcare, Vienna, U.S.A).
Results and Discussion
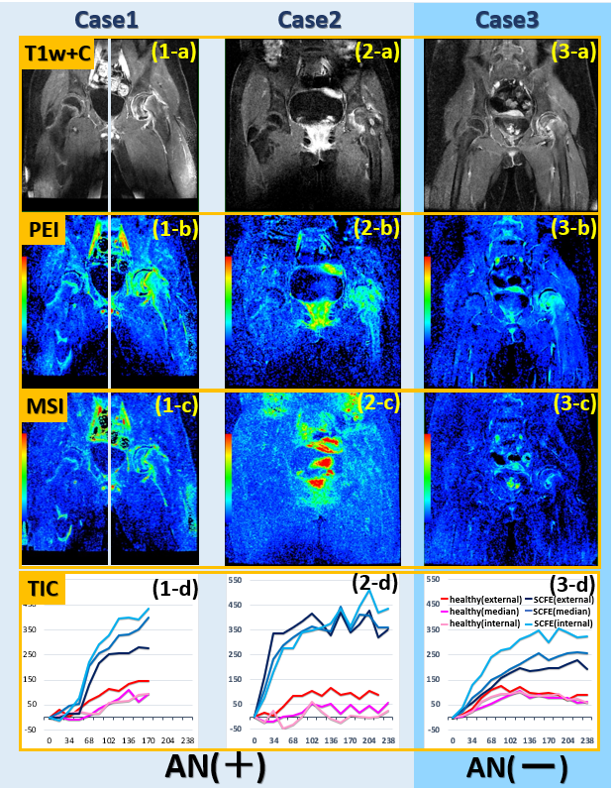
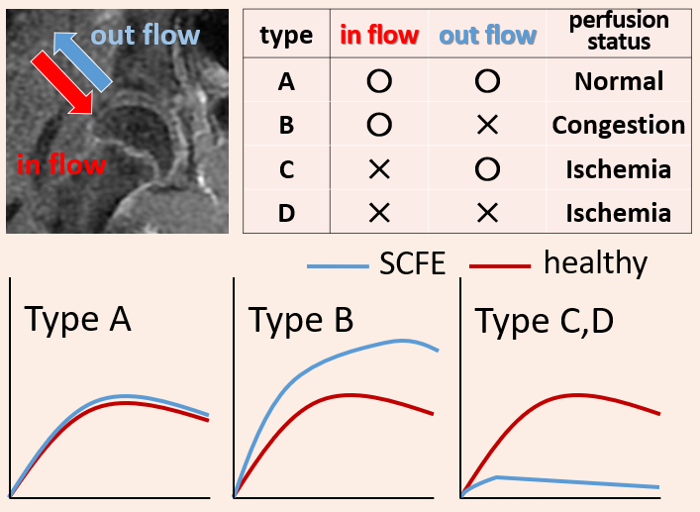
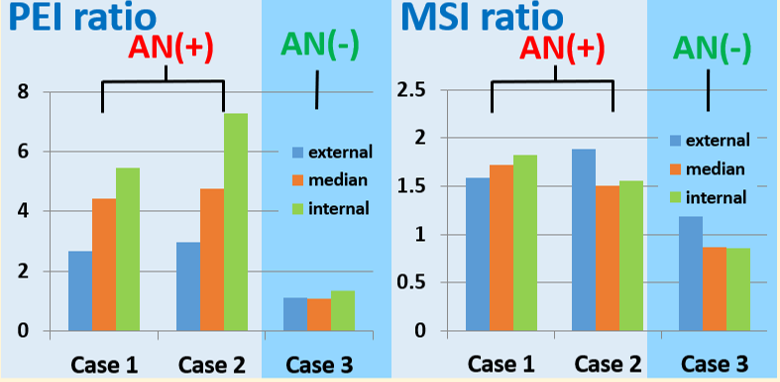
Figure 3 illustrates T1 weighted contrast enhanced (T1w+C) images and perfusion images (PEI and MSI) using the DCE-MRI and TIC. In the all case, the PEI in femoral head with SCFE was increased relative to healthy side, since it was caused to impaired venous perfusion due to slipped capital femoral. In short, it was observed to depict status of congestion.2 There were four types of predicted perfusion states (Figure 4). In the case 1 and 2, the femoral head had necrosis that was observed actually at operation. The wash out of TIC was observed in the case 2, but it could not be in the case 1. Because, the case 1 had dynamic time shorter than the case 2. But in the case 3, the femoral head had not necrosis. The TIC was observed to have slope and curve similar to healthy side, and it was also same in MSI value. We compared these cases by calculated the PEI and MSI ratio between the SCFE and the healthy sides (Figure 5). The case 1 and 2 was higher for the PEI and MSI ratio than case 3, these femoral head of which had avascular necrosis. Therefore, the PEI and MSI ratio could depicts condition of congestion which cause femoral head necrosis.Conclusion
In conclusion, the femoral head perfusion imaging using DCE-MRI in SCFE is useful for decision of treatment strategy. Because, the PEI and MSI using DCE-MRI contributes to evaluation of perfusion status. However, DCE-MRI should be scanned, including late phase of 4 minutes or more after administration of a contrast agent.
Acknowledgements
No acknowledgement found.References
1. Chambenois Edouard MD, et al.: Is the femoral head dead or alive before surgery of slipped capital femoral epiphysis? Interest of perfusion Magnetic Resonance Imaging. Journal of clinical orthopaedics and trauma. 2014 5: 18-26
2. Satoshi Tokuya, et al.: Dynamic MRI of the transient osteoporosis of the hip- A report of two cases. J East Jpn Orthop Traumatol, 2008 20: 89-94.
Figures