5159
Correlation study between micro-architecture of trabecular bone and magnetic resonance transverse relaxation times at multiple spatial resolutions1Bio-Medial Engineering, Ulsan National Institute of Science and Technology, Ulsan, Republic of Korea, 2Division of Magnetic Resonance, Korea Basic Science Institute, Ochang, Republic of Korea
Synopsis
The effects of magnetic resonance (MR) imaging resolutions on the correlations between standard trabecular structural indices and MR transverse relaxation-times (T2 and T2*) were evaluated by performing Monte Carlo proton diffusion simulations, ex vivo experiments with defatted human trabecular specimens, and bovine knee trabecular samples with intact bone marrow via 7T system. T2 relaxation-time robustly represented the trabecular micro-architecture, such as trabecular spacing and number, while T2* was vulnerable with degrading spatial resolution. T2 relaxation times may facilitate the radiation-free diagnosis to assess osteoporotic fractures and therapy response for deep trabecular areas within a feasible scan time on a 7T system.
INTRODUCTION
With no risk of radiation exposure and limited scan time, measurements of magnetic resonance (MR) transverse relaxation-times potentially enable quantification of trabecular bone micro-architecture.1-7 However, the robustness of MR transverse relaxation-times against degrading MR imaging resolutions have not been systematically compared with standard trabecular structural indices. In this study, the effects of MR imaging resolutions on MR transverse relaxation-times were evaluated by computing proton diffusion simulations using a Monte Carlo (MC) approach. As degrading MR imaging resolution, MR transverse relaxation-times were compared with trabecular structural indices by performing ex vivo experiments with defatted human trabecular specimens and a bovine knee trabecular sample with intact bone marrow on preclinical and clinical 7T systems.METHODS
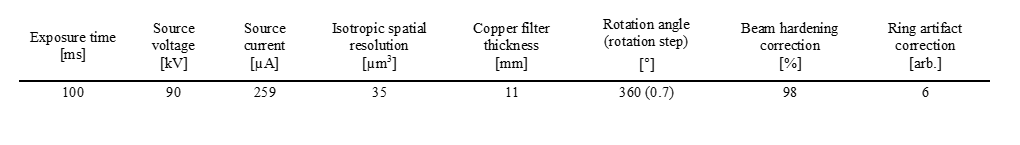
Finite perturber method was employed in order to calculate the B0 shift of forty trabecular bone volumes (0.5×0.5×0.5 mm3) from a micro-computed tomography (micro-CT).8 Multi-echo ultra-short echo-time (UTE) and multi-slice multi-echo (MSME) acquisitions were simulated by MC approach with the same imaging parameters of the defatted trabecular experiment. Voxel wise transverse relaxation-times were calculated by fitting the following mono-exponential decay model:$$S(t)=S_0\times exp(-TE/T_2^*\ or\ T_2) (1) $$
This study was approved by the Ulsan National Institute of Science and Technology Institutional Review Board in accordance with the guidelines of the Helsinki Declaration. Four trabecular bone specimens (10×10×10 mm3) were extracted from the distal femoral condyle during knee joint replacement procedures. After bone marrow was removed, the bone specimens were degassed in a water chamber and put into syringes with water. The MR transverse relaxation-times were measured with a 25 mm transmit/receiver coil on a Bruker 7T system. The imaging parameters are described in Table 1. To compensate for the differences in transverse relaxation-times of the water solutions, T2 and T2* values of the defatted trabecular samples were normalized with T2 values of the water only region.$$normalized\ T_2\ or\ T_2^*= \frac{T_2\ or\ T_2^*}{average\ T_2\ of\ water\ only\ region} (2) $$
3D structural bone images was obtained from micro-CT with the parameters described in Table 2. Micro-CT images were matched with corresponding UTE images using an 3D rigid body registration method. Each bone volume was segmented and divided into 27 sub-volumes.
A bovine knee articular cartilage cut into saws to match the size of 16 channel wrist array coils. MR transverse relaxation-times were measured using 3D multi-echo gradient echo and MSME pulse sequences on a Philips Achieva 7T system. 3D turbo spin echo acquisition was performed to obtain 3D structural information. Imaging parameters are described in Table 1. Bone included region was segmented and divided into 32 sub-regions. Trabecular structural indices, such as trabecular spacing, number, thickness, and bone volume fraction, were evaluated using a 3D sphere fitting method in BoneJ software.9-11 For each sub-volume, the mean MR transverse relaxation-times of the sub-volumes were compared with mean trabecular structural parameters.
RESULTS
Representative echo time dependent images of UTE and MSME simulations are shown in Figure 1A and 2B, respectively. The distribution of T2* reduced as the imaging voxel size increased for both the simulation and experiment (Figure 1C and 1D). By comparison, T2 was rarely affected by the imaging voxel size.
For the defatted trabecular experiment (Figure 2), strong correlations between MR transverse relaxation-times and trabecular spacing and number were found at 125 µm3. The correlation coefficients between T2* and the structural indices gradually decreased as the imaging voxel size increased while T2 maintained strong correlations.
Similar to the defatted trabecular experiment, significant correlations between MR transverse relaxation-times and structural indices of both trabecular spacing and number were observed for the bovine knee with intact marrow experiment at 400×400×500 µm3. The correlations between structural indices and T2* gradually decreased as the imaging voxel size increased (Figure 3A). However, T2 maintained robust correlations with trabecular spacing and number (Figure 3B).
DISCUSSION
We explored the effect of MR acquisition resolution on the correlations between standard trabecular structural indices with MR transverse relaxation-times in a 7T system. MR transverse relaxation-times showed strong and significant correlations especially with trabecular spacing and number at the high MR resolution. The correlations between T2* and structural indices decreased at lower MR resolutions due to the overall reduction in T2* with increasing voxel size. On the other hand, T2 values maintained strong correlations with structural indices, irrespective of MR acquisition resolution. The observed behaviors of T2 and T2* with degrading MR resolutions were consistent with corresponding MC-based simulations. For the bovine trabecular sample with intact bone marrow, corresponding resolution-varying T2 and T2* measurements showed that a feasible extension of MR T2-relaxometry (50~90 ms) to scan-time limited clinical application (~2 min) for trabecular spacing (0.5~1 mm3) and number (0.8~1.2 mm−3).Acknowledgements
This work was supported by the National Research Foundation of Korea under Grant number 2017R1A1A1A05001062, the 2017 Research Fund (1.170017.01) of the Ulsan National Institute of Science and Technology, and the Installation and Application of Human MRI Equipment of Korea Basic Science Institute (KBSI E35600).References
1. De Santis, S., et al., In vitro and in vivo MR evaluation of internal gradient to assess trabecular bone density. Phys Med Biol, 2010. 55(19): p. 5767-85.
2. Capuani, S., et al., Characterization of trabecular bone by dipolar demagnetizing field MRI. Magn Reson Med, 2001. 46(4): p. 683-9.
3. Hwang, S.N. and F.W. Wehrli, Experimental evaluation of a surface charge method for computing the induced magnetic field in trabecular bone. J Magn Reson, 1999. 139(1): p. 35-45.
4. Rebuzzi, M., et al., Potential diagnostic role of the MRI-derived internal magnetic field gradient in calcaneus cancellous bone for evaluating postmenopausal osteoporosis at 3T. Bone, 2013. 57(1): p. 155-63.
5. Cho, H., et al., Visualization of inhomogeneous local magnetic field gradient due to susceptibility contrast. J Magn Reson, 2009. 198(1): p. 88-93.
6. Sigmund, E.E., H. Cho, and Y.Q. Song, High-resolution MRI of internal field diffusion-weighting in trabecular bone. NMR in Biomedicine, 2009. 22(4): p. 436-448.
7. Sigmund, E.E., et al., Diffusion-based MR methods for bone structure and evolution. Magnetic Resonance in Medicine, 2008. 59(1): p. 28-39.
8. Pathak, A.P., B.D. Ward, and K.M. Schmainda, A novel technique for modeling susceptibility-based contrast mechanisms for arbitrary microvascular geometries: the finite perturber method. Neuroimage, 2008. 40(3): p. 1130-1143.
9. Dougherty, R. and K.-H. Kunzelmann, Computing local thickness of 3D structures with ImageJ. Microscopy and Microanalysis, 2007. 13(S02): p. 1678.
10. Hildebrand, T. and P. Rüegsegger, A new method for the model‐independent assessment of thickness in three‐dimensional images. Journal of microscopy, 1997. 185(1): p. 67-75.
11. Doube, M., et al., BoneJ: free and extensible bone image analysis in ImageJ. Bone, 2010. 47(6): p. 1076-1079.
Figures
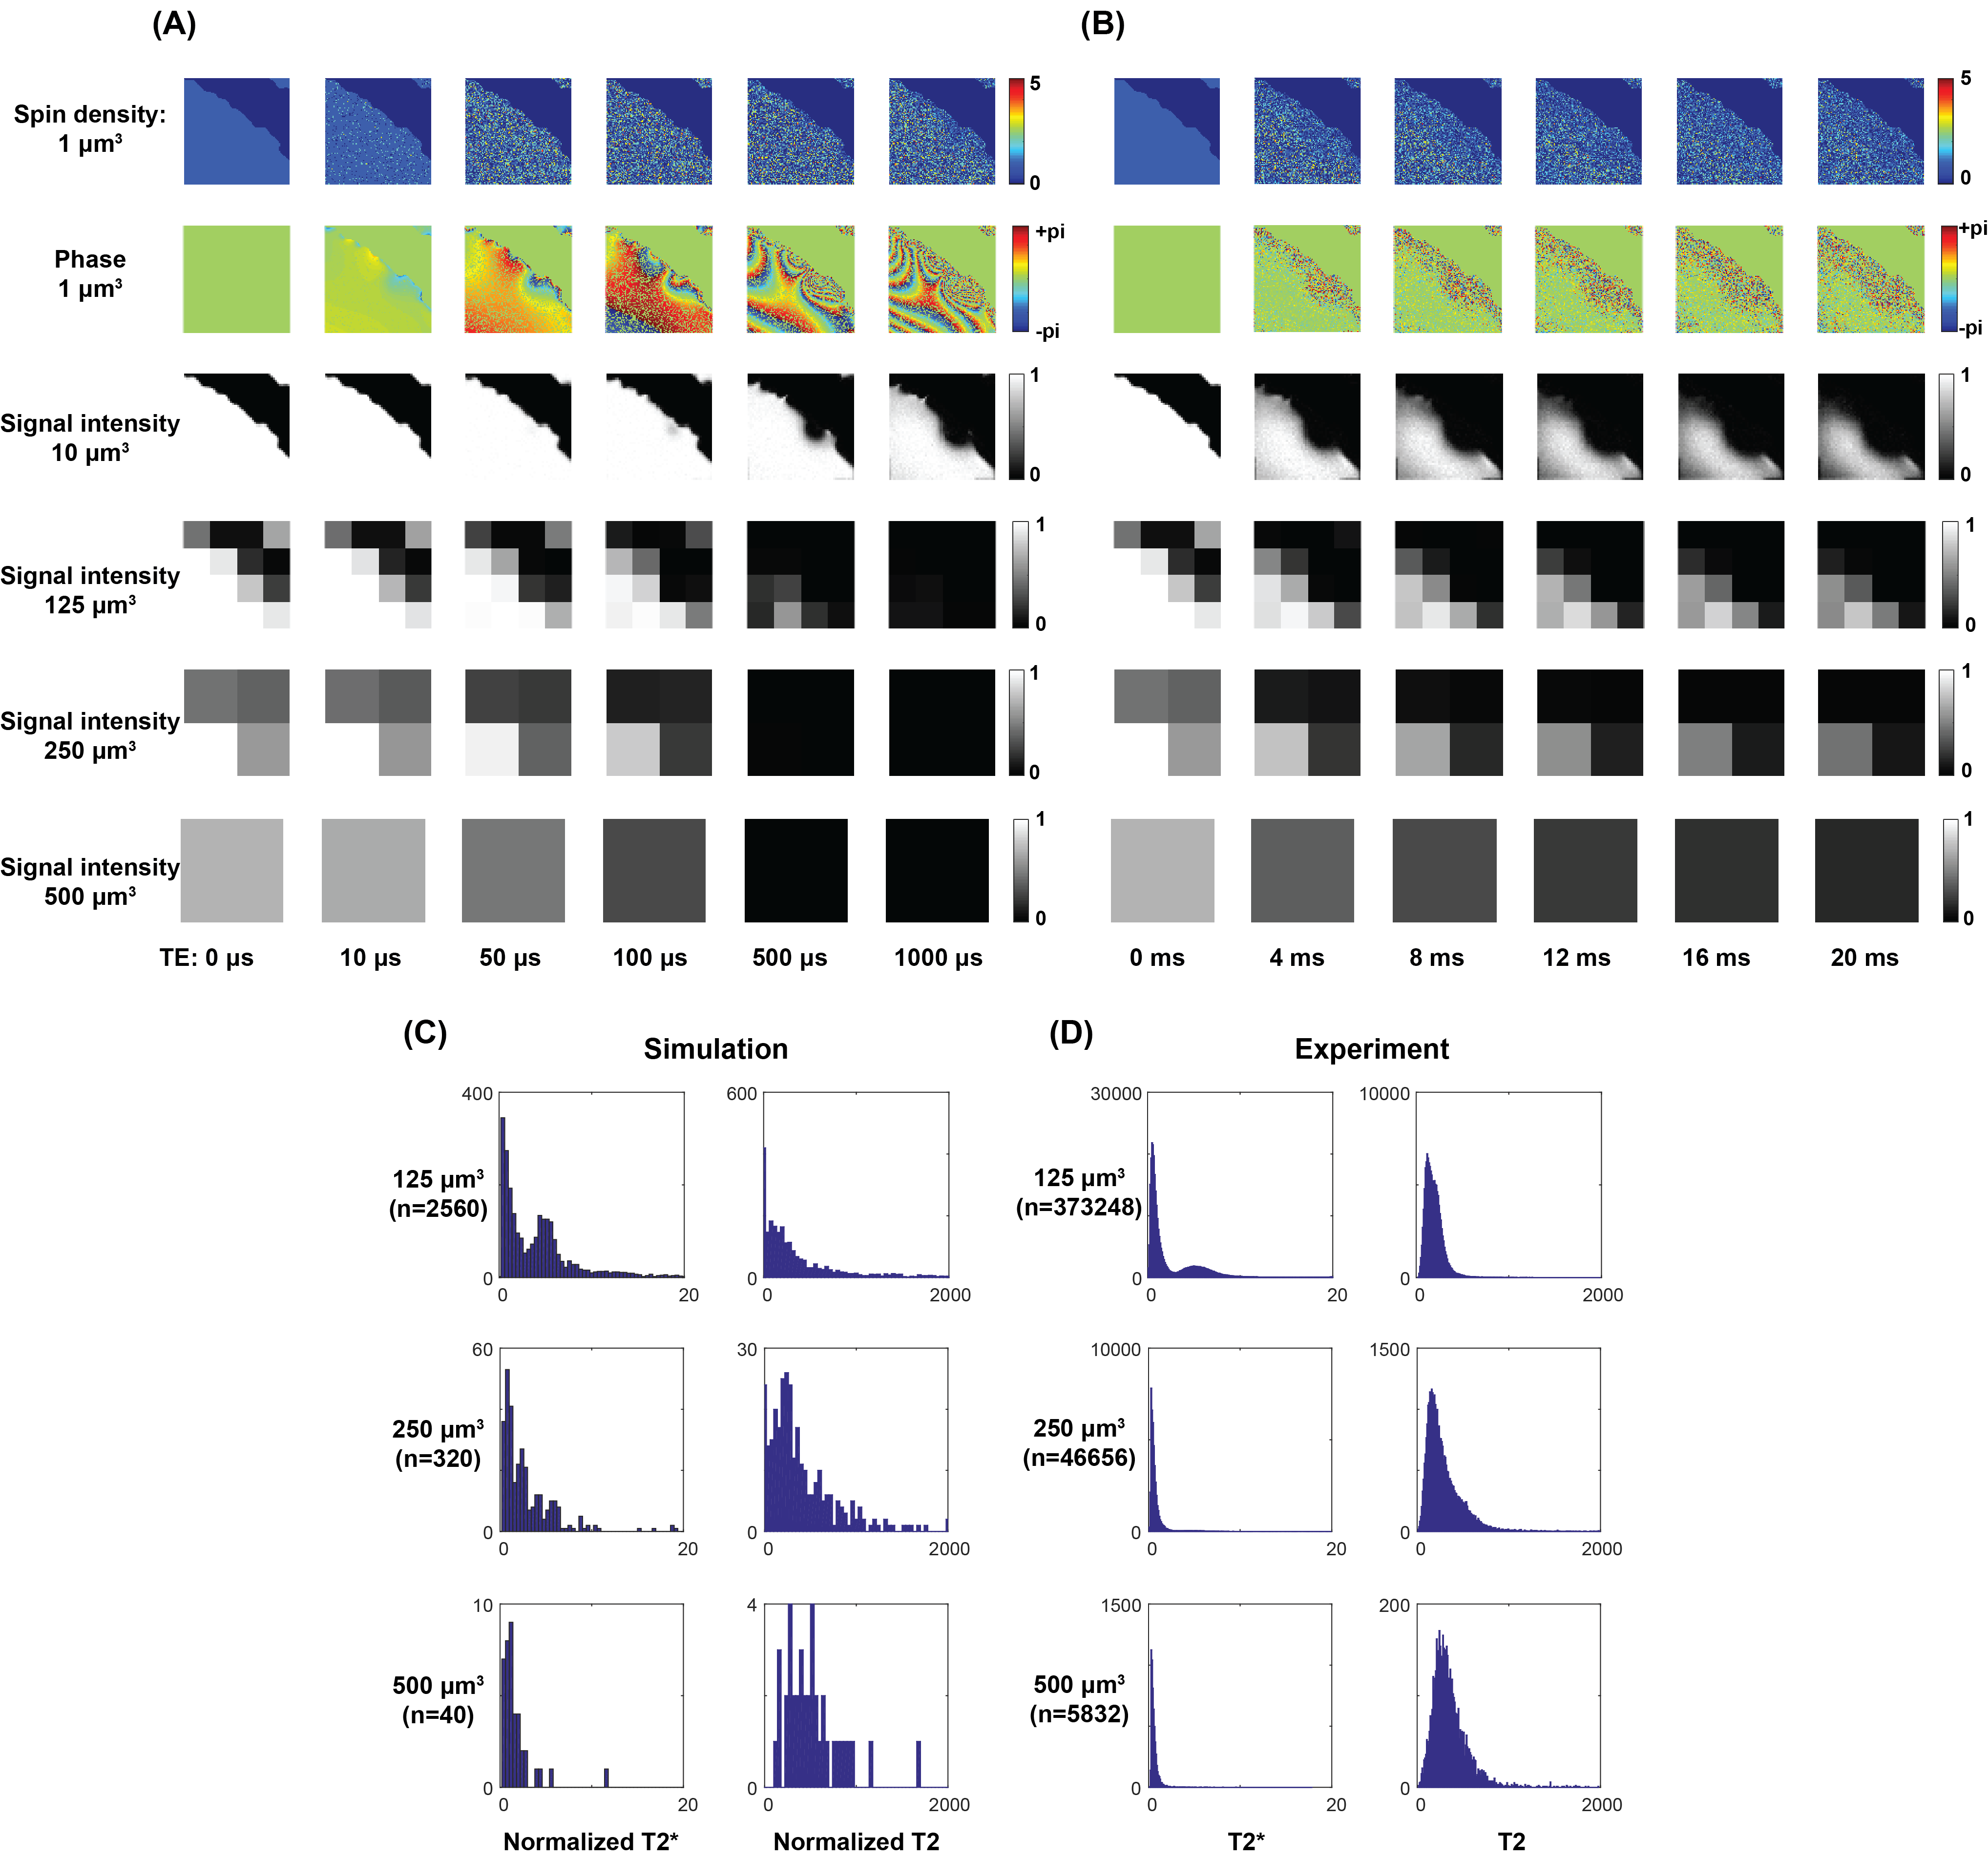
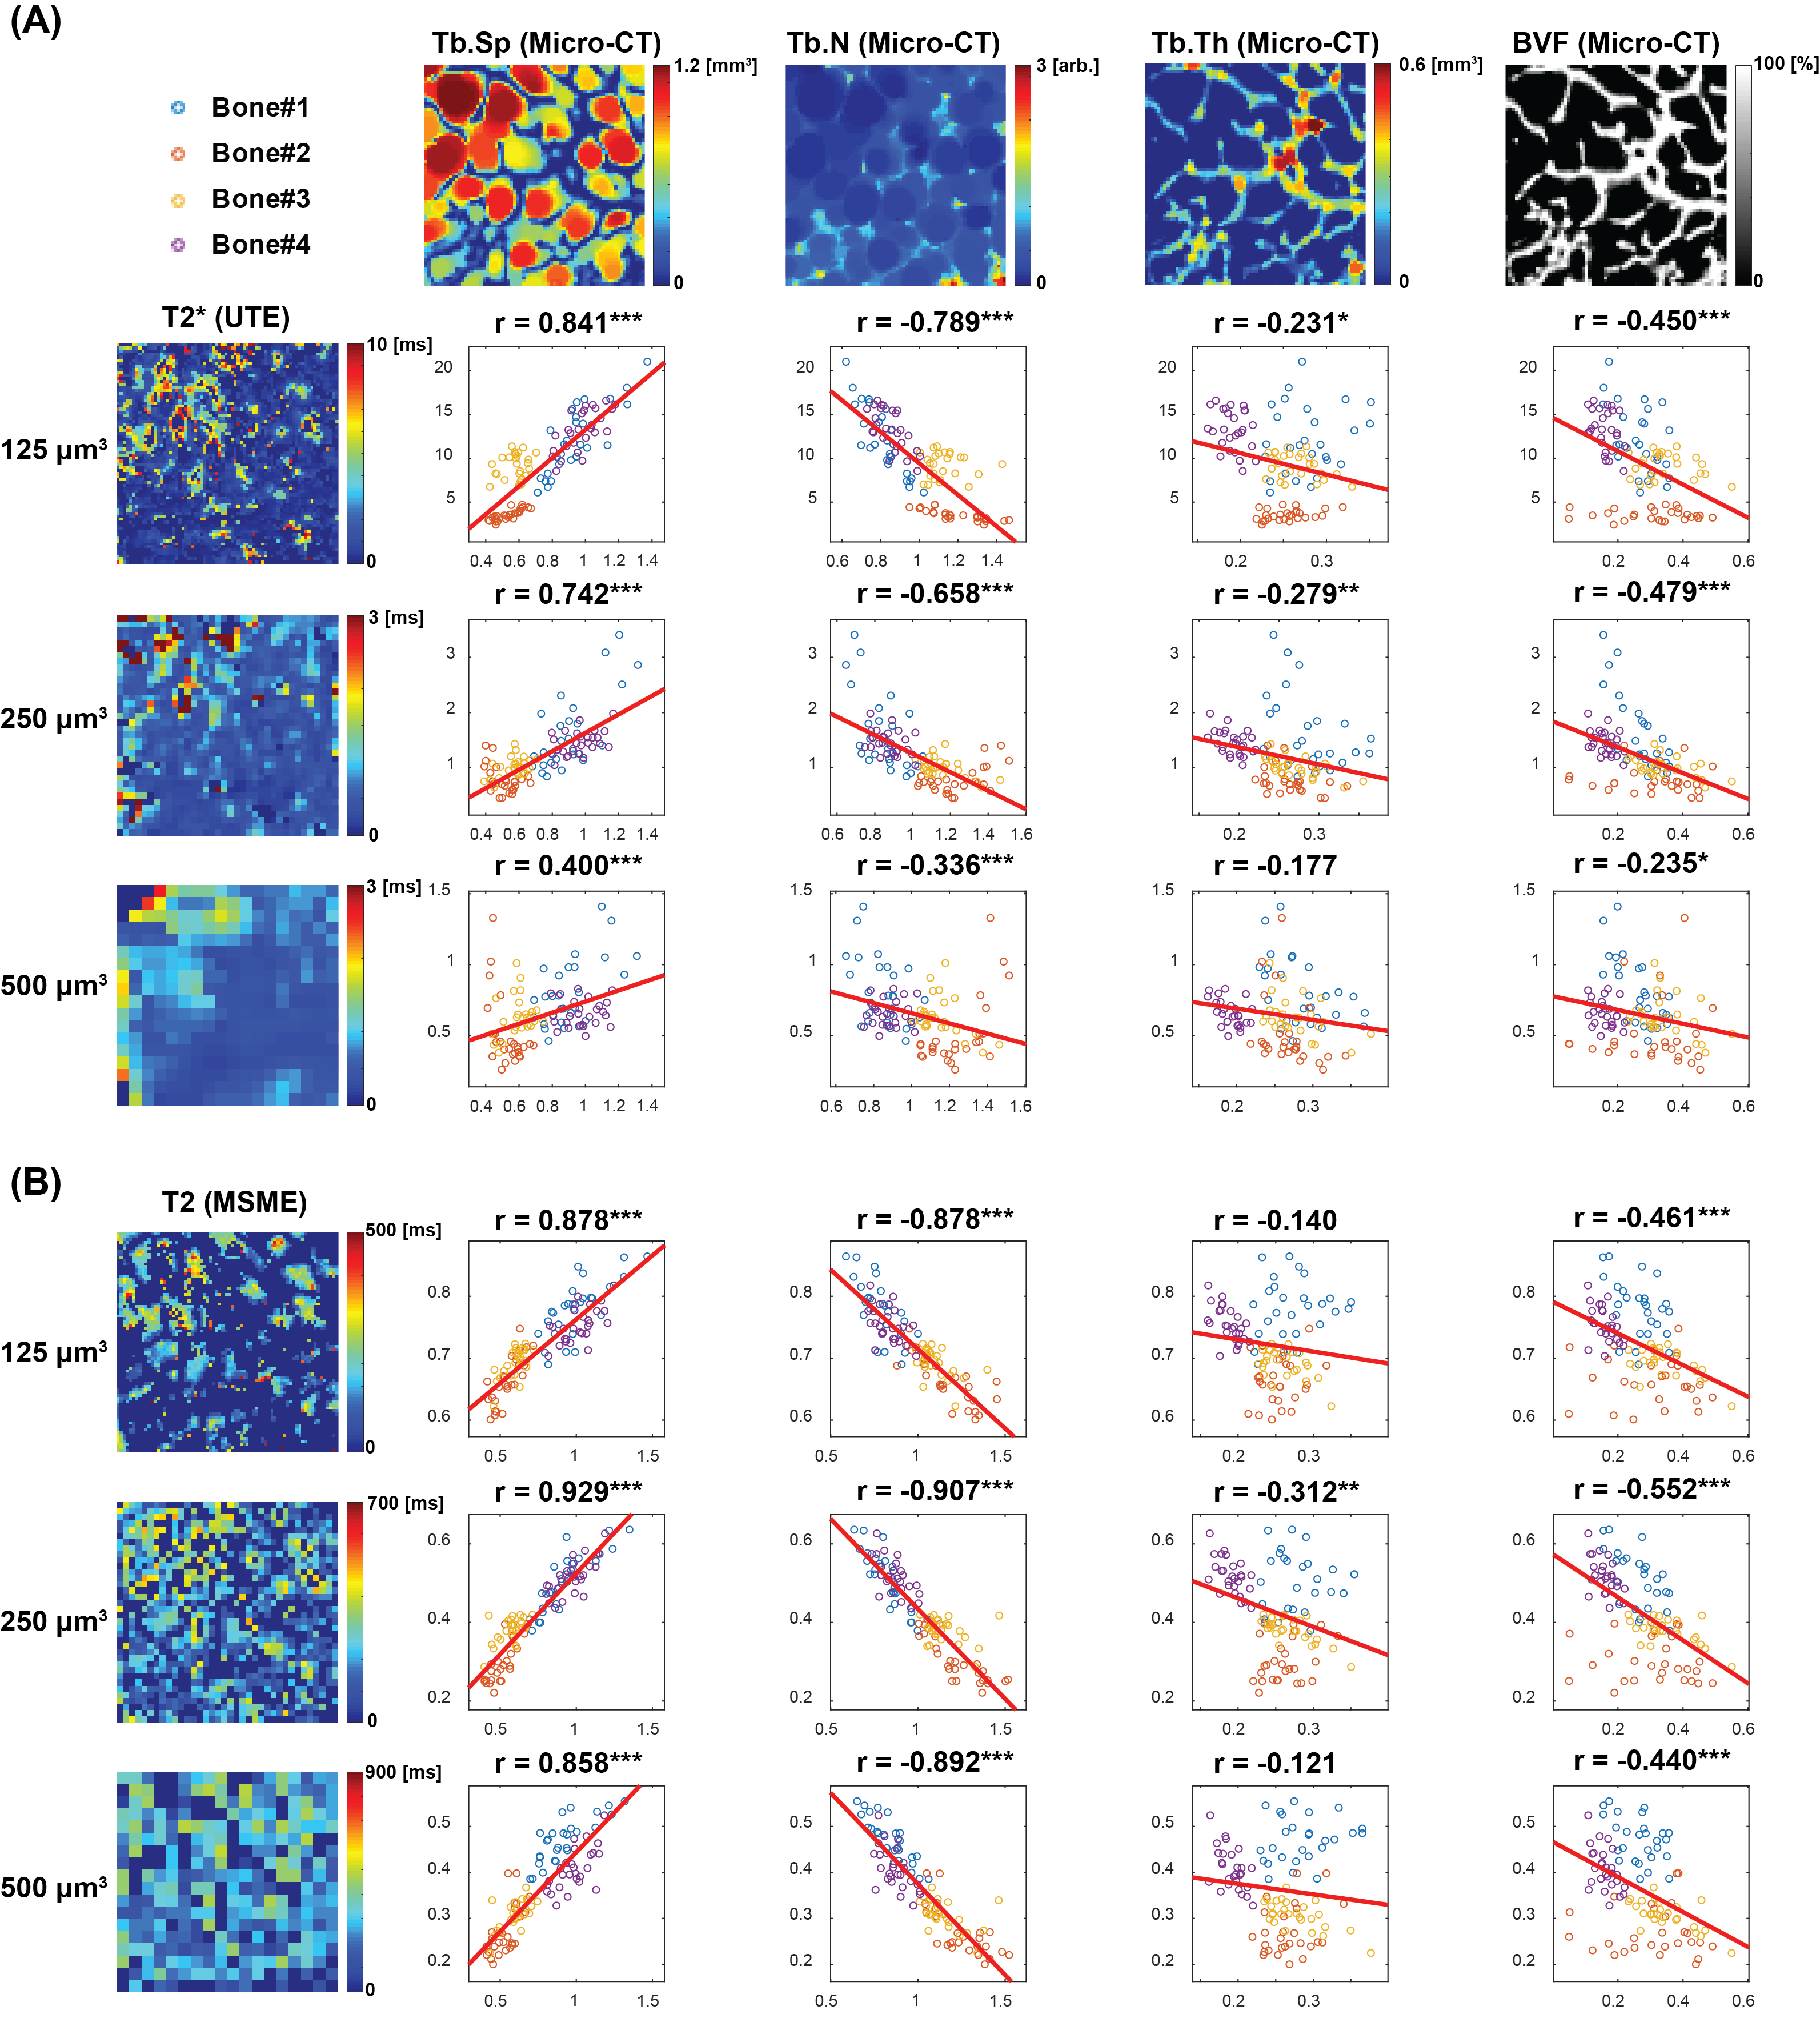
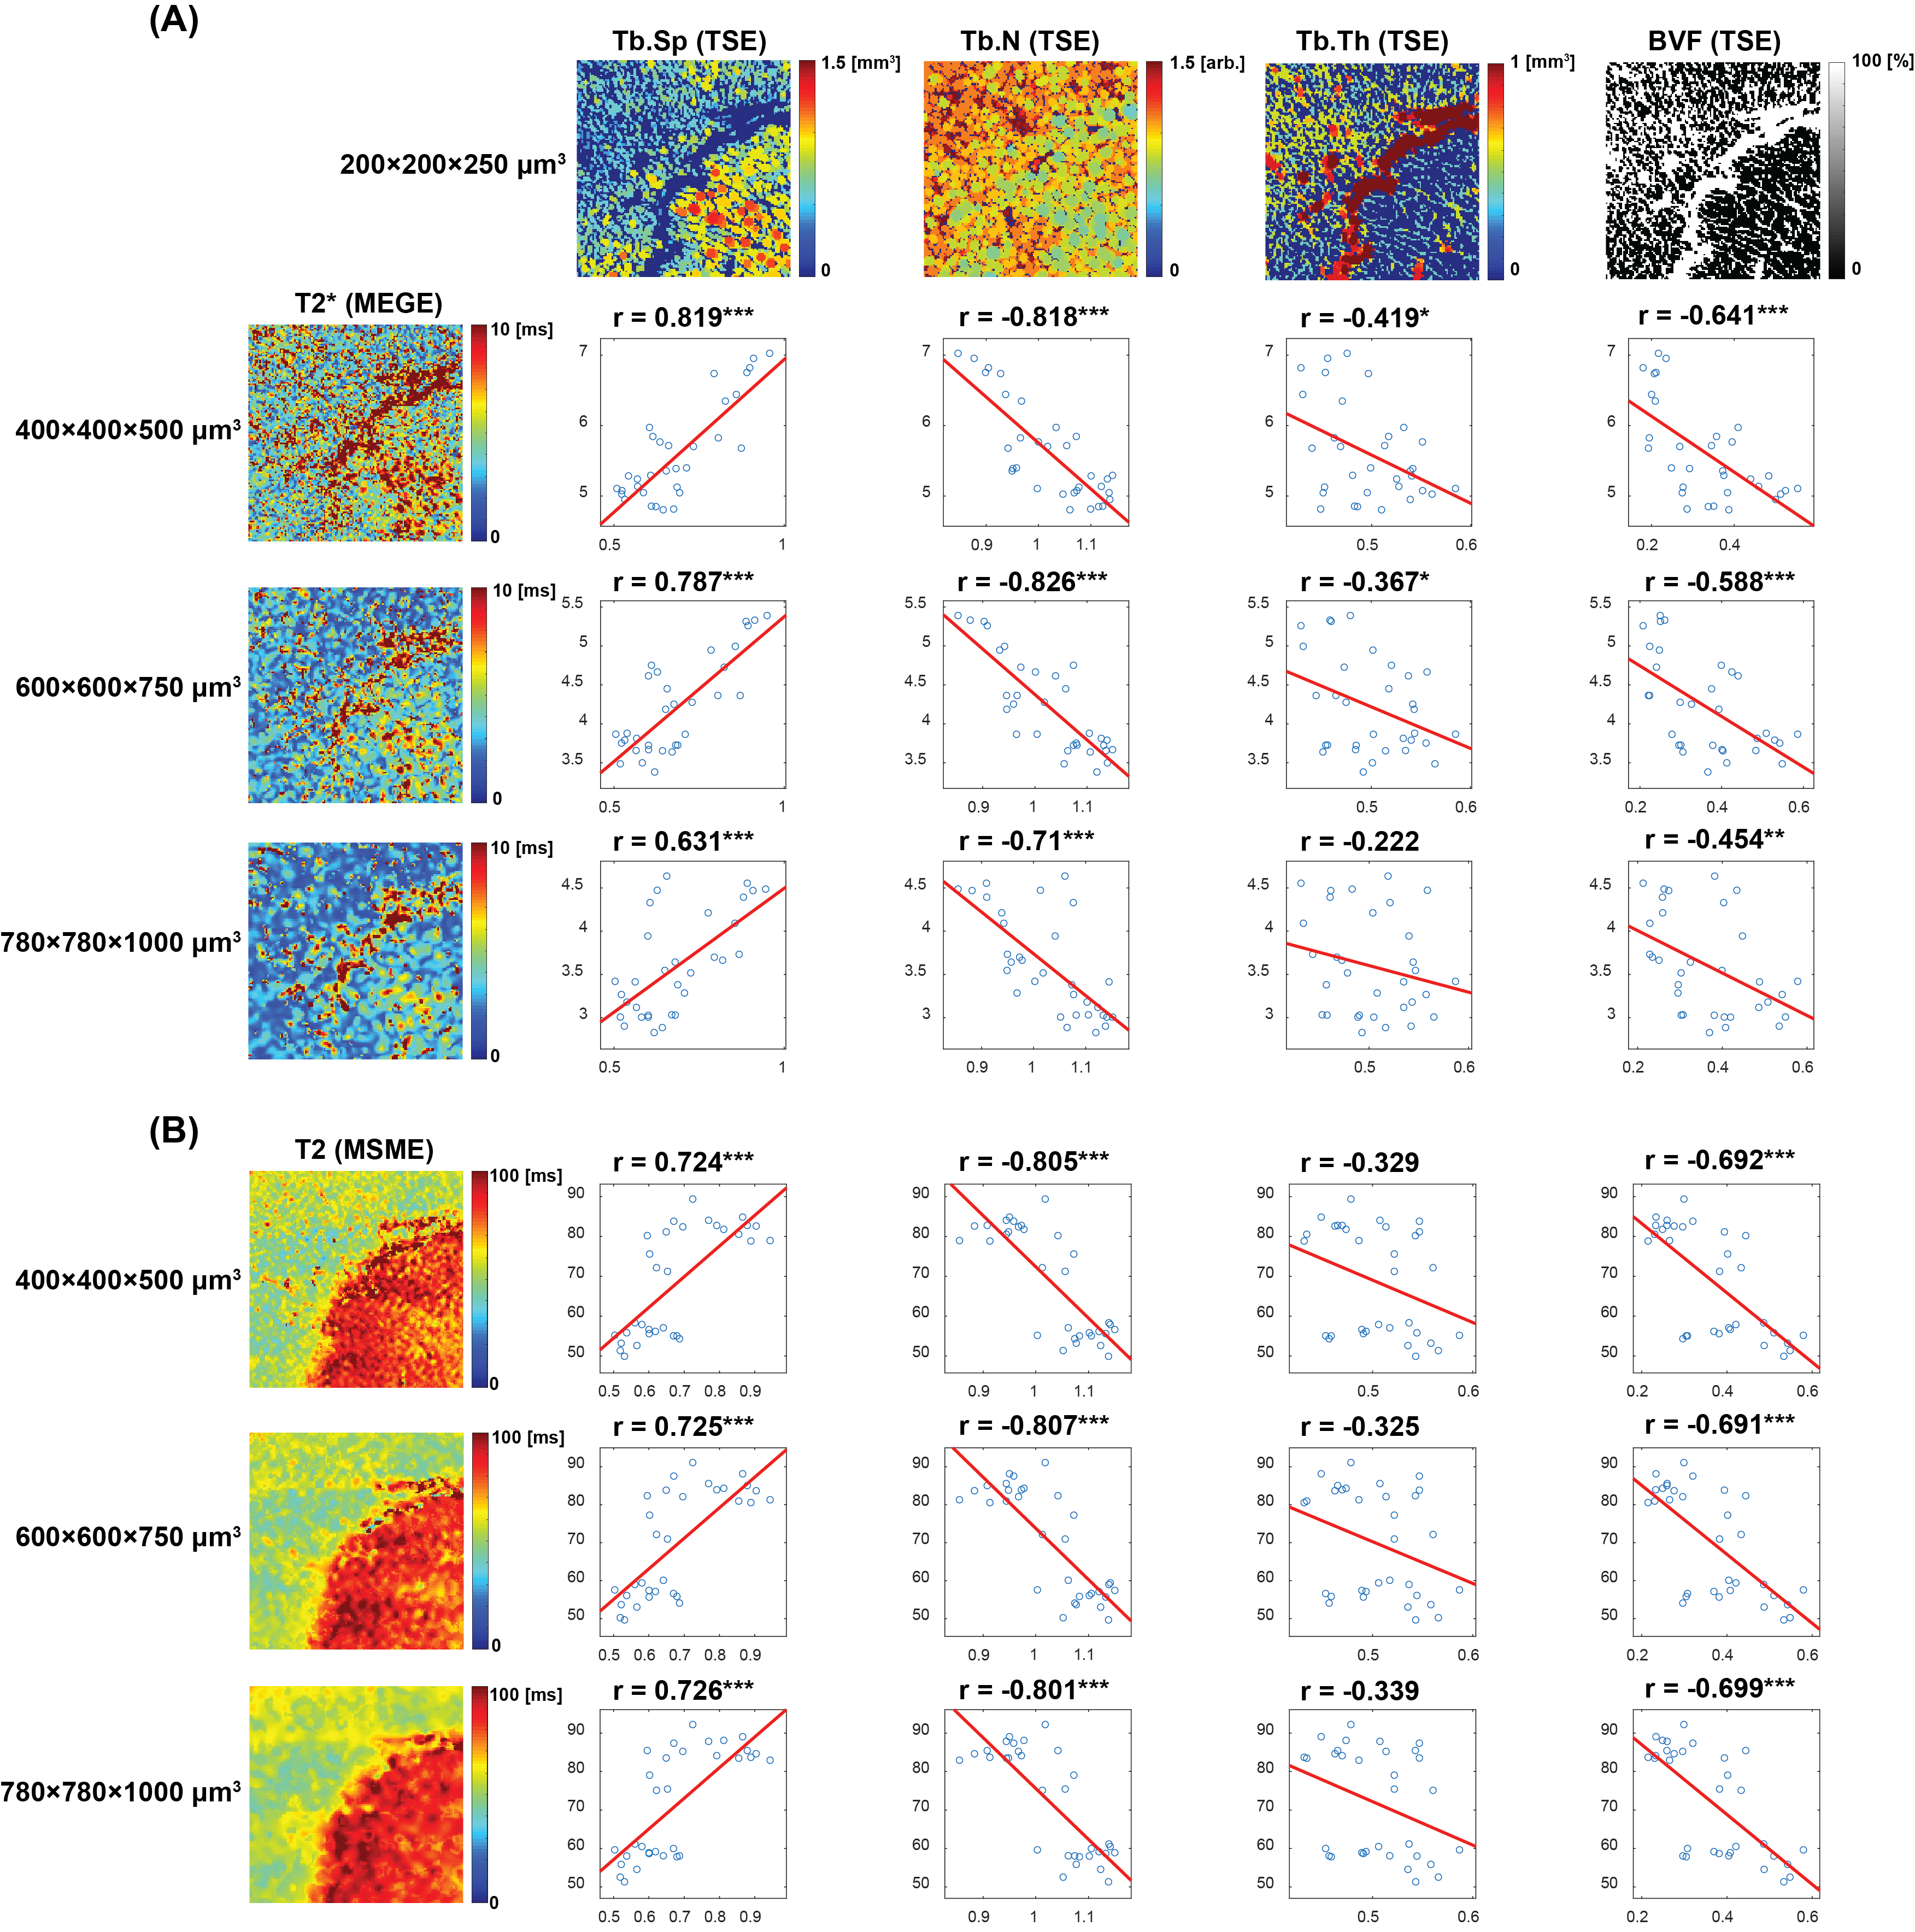
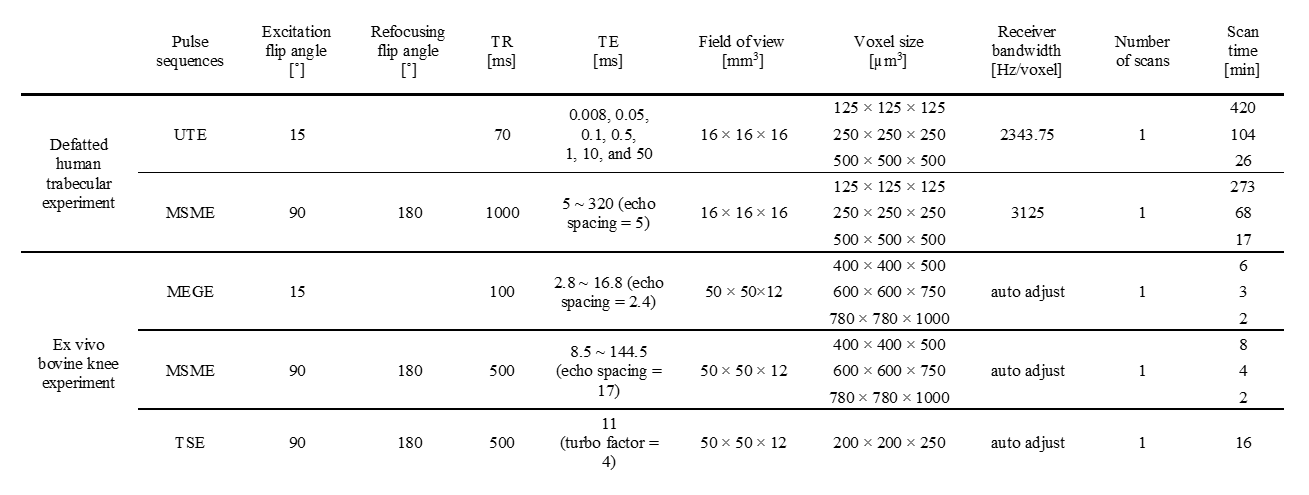
Table 1. The magnetic resonance acquisition parameters for preclinical (defatted human trabecular sample) and clinical (ex vivo bovine knee) experiments via 7T magnetic resonance imaging.
TR, pulse repetition time; TE, echo-time; UTE, ultra-short echo-time; MSME, multi-slice multi-echo; MEGE, 3-dimensional multi-echo gradient echo.