5158
Prognostic value of dynamic MRI in assessing femoral head vascularity of male smokers.1Radiation imaging center of Renmin Hospital of Wuhan University, wuhan, China, 2GE Healthcare China, Beijing, China., wuhan, China
Synopsis
Smokers were at a higher risk of osteonecrosis
of the femoral head (ONFH).
In this study we aim to evaluate prognostic value of dynamic
magnetic resonance imaging in assessing the femoral head vascularity of male
smokers.
80 young adult men
of whom 40 were smokers and 40 were nonsmokers underwent routine MR and DCE MR examination. The images and data were analyzed. In this study, we found that there was no difference of T1WI and T2WI between smokers and
non-smokers.
Ktrans and Kep of femoral head in the smoking group were
higher compared to the control group.
DCE MR can be a potential tool to detect the early change of femoral
head vascularity of male smokers.
Introduction
Recent studies showed that current smokers were at a higher risk of osteonecrosis of the femoral head (ONFH) 1. Smoking can lead to metabolic changes such as glucose intolerance and lipidosis 2. But when we found ONFH on routine MRI images, it may be too late to take clinical intervention. DCE MR can be a potential tool to detect the early change of femoral head vascularity of male smokers. In this study we aim to evaluate prognostic value of dynamic magnetic resonance imaging in assessing the femoral head vascularity of male smokers.Methods
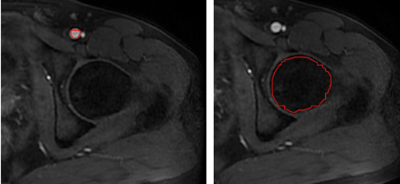
This was a prospective study including 80 young adult men, of whom 40 were smokers (35±4 years and body mass index of 28.1±4.7kg/m3) and 40 were nonsmokers (35 ± 3 years and body mass index of 28.4±4.3 kg/m3). Adult male smokers who had smoked 2cigarettes/d for at least 1 year were recruited while the nonsmokers who had never smoked previously were recruited as the controls. Inclusion criteria were : age 18-55 years; BMI(Body Mass Index)was between 18.5 and 24.99. The exclusion criteria were: any severe psychopathology; abusive use of alcohol or illegal drugs; general contraindications to MRI exam; history of hematological malignancy, chemotherapy or radiation therapy, institutionalized, or unable to give consent. MRI was performed with a 3-T MRI scanner (Discovery MR750W; GE Healthcare, Waukesha, WI) equipped with a 32-channel phased-array torso coil. All patients underwent MRI covering the vertebral body of L4 to the lesser trochanter of the femur, including T2 weighted axial imaging, T1 weighted axial imaging and DCE-MR imaging. DCE-MR images were obtained using a LAVA series after injection of 0.2 mmol/kg body weight of GdDTPA-BMA (Omniscan, GE Healthcare) 0.1 mmol/kg by the ante-brachial vein over 2–4 s. A 10-mL saline flush was performed after GdDTPA-BMA injection. The MR imaging parameters were as follows: TE = 2.3 ms, TR = 4.9 ms, FA = 15°, FOV = 16 × 12.8 mm2, slice thickness = 2 mm; matrix = 256 × 160, scan time = 5 minutes and 22 seconds. Routine MR images were assessed for pathological findings, including femoral head necrosis and transcervical fracture. The DCE parameters were computed using the Omni-Kinetics, software package. The Extended Tofts model was used to estimate the quantitative parameters, including the transfer constant (Ktrans), the rate constant (Kep), the volume of extravascular extracellular space (Ve), and the fractional plasma volume (Vp). In the perfusion phase, the artery was analyzed first. Subsequently, the arterial input function (AIF) was determined in a circular ROI at the center of the arteria femoralis at the plane of caput femoris, as shown in Fig. 1a (left). We used the ROI to measure DCE-MR parameters, as shown in Fig. 1b (right). Statistical analysis The continuous data are expressed as mean ± standard deviation (SD). A seried of two-tailed paired t-tests were used to compare DCE parameters between smokers and non-smokers. All statistical analyses were conducted on SPSS 17.0 (SPSS, Chicago, IL, USA) with a threshold of p<0.05.Results
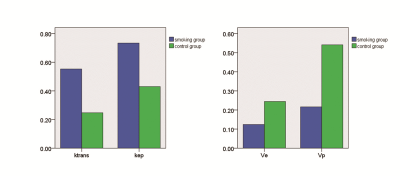
There was no difference of T1WI and T2WI between smokers and non-smokers. Ktrans and Kep of femoral head in the smoking group were higher compared to the control group. Ve and Vp in the smoking group were lower compared to the control group shown as table 1 and fig 2.Discussion
Previous studies demonstrated that a high nicotine uptake can lead to metabolic changes such as glucose intolerance and lipidosis3, 4. This may explain the change of Ktrans and Kep which may indicate the vascular destruction 5. Both of glucose intolerance and lipidosis can cause vascular destruction by chronic inflammation, immune disturbances, hematopoietic abnormalities and impaired damage regeneration . The decreased Ve may be caused by bone marrow fat deposition. Unlike those of other fat depots, bone marrow adipocytes are not grouped into lobules, but are scattered within the hematopoietic tissue; furthermore, bone marrow adipocytes can compress microvascular tissue, leading to bone marrow cell ischemia, which may be one of the reasons underlying the decrease in Vp. Another possible explanation for the decrease of Vp may be the damage to the microvascular system in smokers. In this study, there was no difference of T1WI and T2WI between smokers and non-smokers, however we found significant differences of DCE parameters between smokers and healthy controls. DCE MR can be a potential tool to detect the early change of femoral head vascularity of male smokers.Acknowledgements
No acknowledgement found.References
1. Wen, Z., et al., Influence of cigarette smoking on osteonecrosis of the femoral head (ONFH): a systematic review and meta-analysis. Hip Int, 2017. 27(5): p. 425-435.
2. Takahashi, S., et al., Pronounced risk of nontraumatic osteonecrosis of the femoral head among cigarette smokers who have never used oral corticosteroids: a multicenter case-control study in Japan. J Orthop Sci, 2012. 17(6): p. 730-6.
3. Luaces-Regueira, M., et al., Smoking as a risk factor for complications in chronic pancreatitis. Pancreas, 2014. 43(2): p. 275-80.
4. Sliwinska-Mosson, M. and H. Milnerowicz, The impact of smoking on the development of diabetes and its complications. Diab Vasc Dis Res, 2017. 14(4): p. 265-276.
5. Kawada, T., Smoking cessation and the incidence of impaired fasting glucose and type 2 diabetes mellitus. J Diabetes Complications, 2016. 30(3): p. 561.
Figures


