5157
Time interleaved multi-gradient-echo imaging with UTE and non-UTE sampling for simultaneous PDFF, T2* and magnetic susceptibility mapping of cortical bone1Department of Diagnostic and Interventional Radiology, TUM Klinikum rechts der Isar, Munich, Germany, 2Philips Research Laboratory, Hamburg, Germany
Synopsis
Recently, quantitative magnetic susceptibility mapping (QSM) is gaining attention in the context of probing bone microstructure with potential clinical application in the assessment of bone health. Particularly, in bone applications the presence of multiple chemical species including short and long T2* components embedded in the bone environment poses several challenges including rapid signal decay, fieldmap estimation and chemical species separation. Using non-UTE QSM leads to signal voids in cortical bone regions complicating QSM. Therefore, the present study investigates the application of a stack-of-stars time-interleaved multi-gradient echo sequence including UTE and regular echo sampling for bone QSM.
Purpose
Multi-echo gradient-echo imaging (MGRE) enables simultaneous mapping of T2* and proton density fat fraction (PDFF) and has been used in the characterization of both trabecular and cortical bone in the assessment of bone health and osteoporosis[1,2]. MGRE including UTE sampling additionally enables T2* mapping in cortical bone, which has been linked to cortical porosity [1]. Recently, MGRE including UTE sampling has been used to simultaneously map PDFF and T2* of both trabecular and cortical bone [3]. Furthermore, quantitative magnetic susceptibility mapping (QSM) has been proposed as an indirect measurement of bone density [4,5] accounting for the water--fat composition of bone marrow PDFF and for both cortical and trabecular bone QSM. The purpose of the present work is to investigate the application of a stack-of-stars time-interleaved multi-gradient echo sequence including UTE and regular echo time sampling (UTE-TIMGRE) for simultaneous PDFF, T2* and QSM in bone accounting for both water--fat composition and the presence of cortical bone.Methods
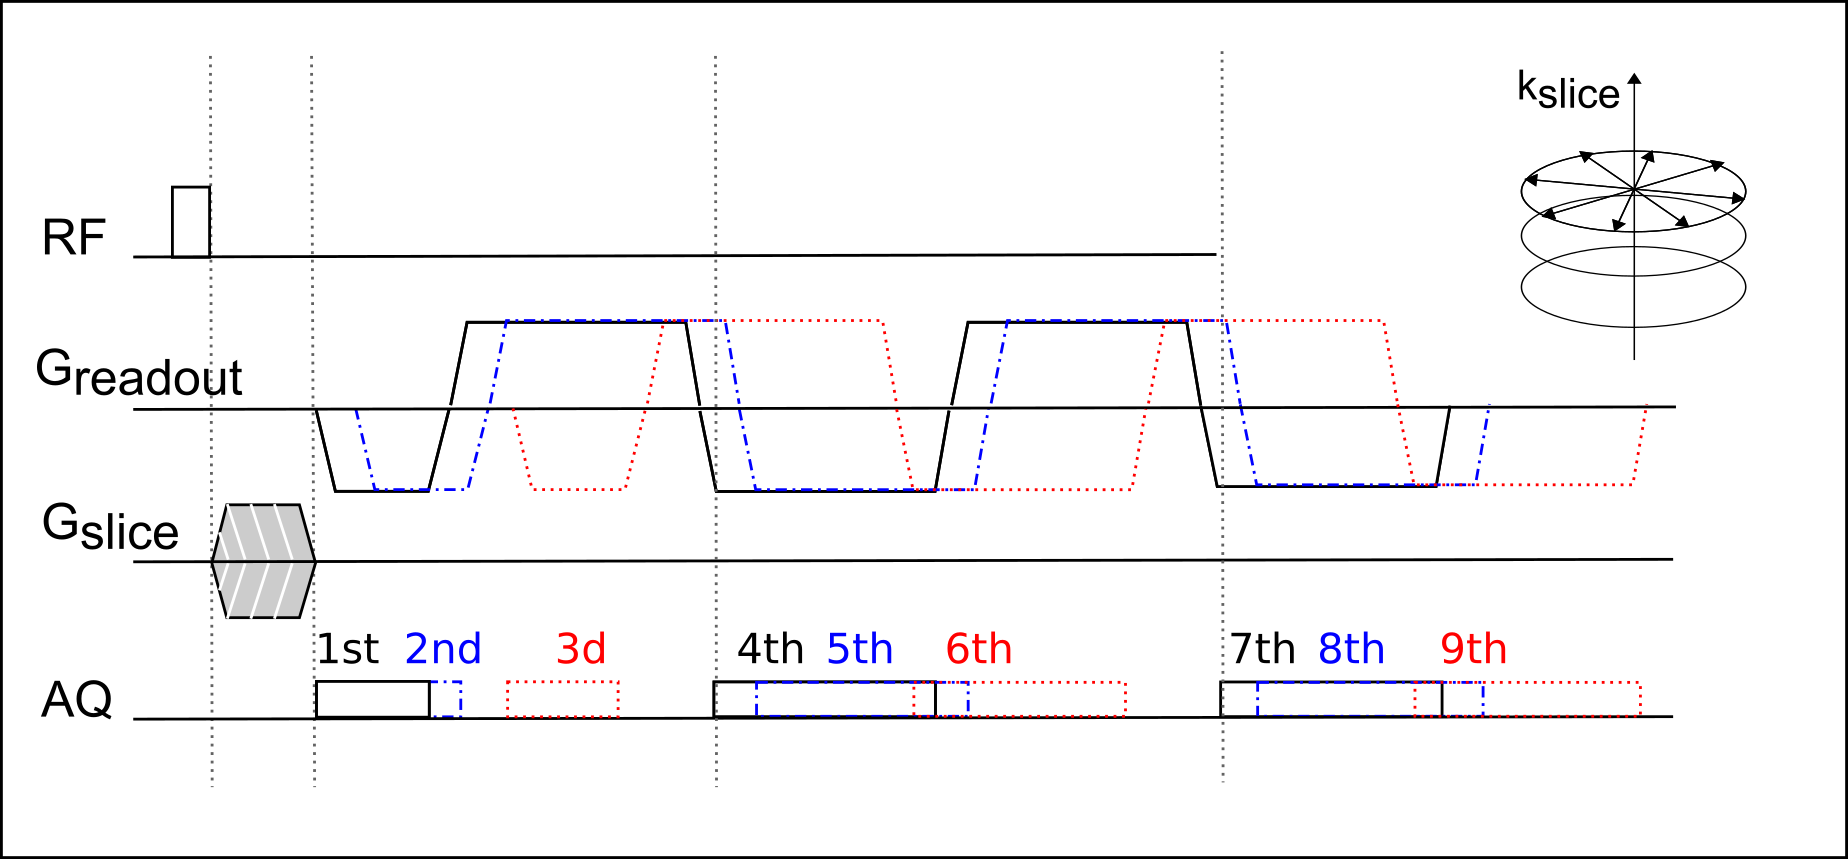
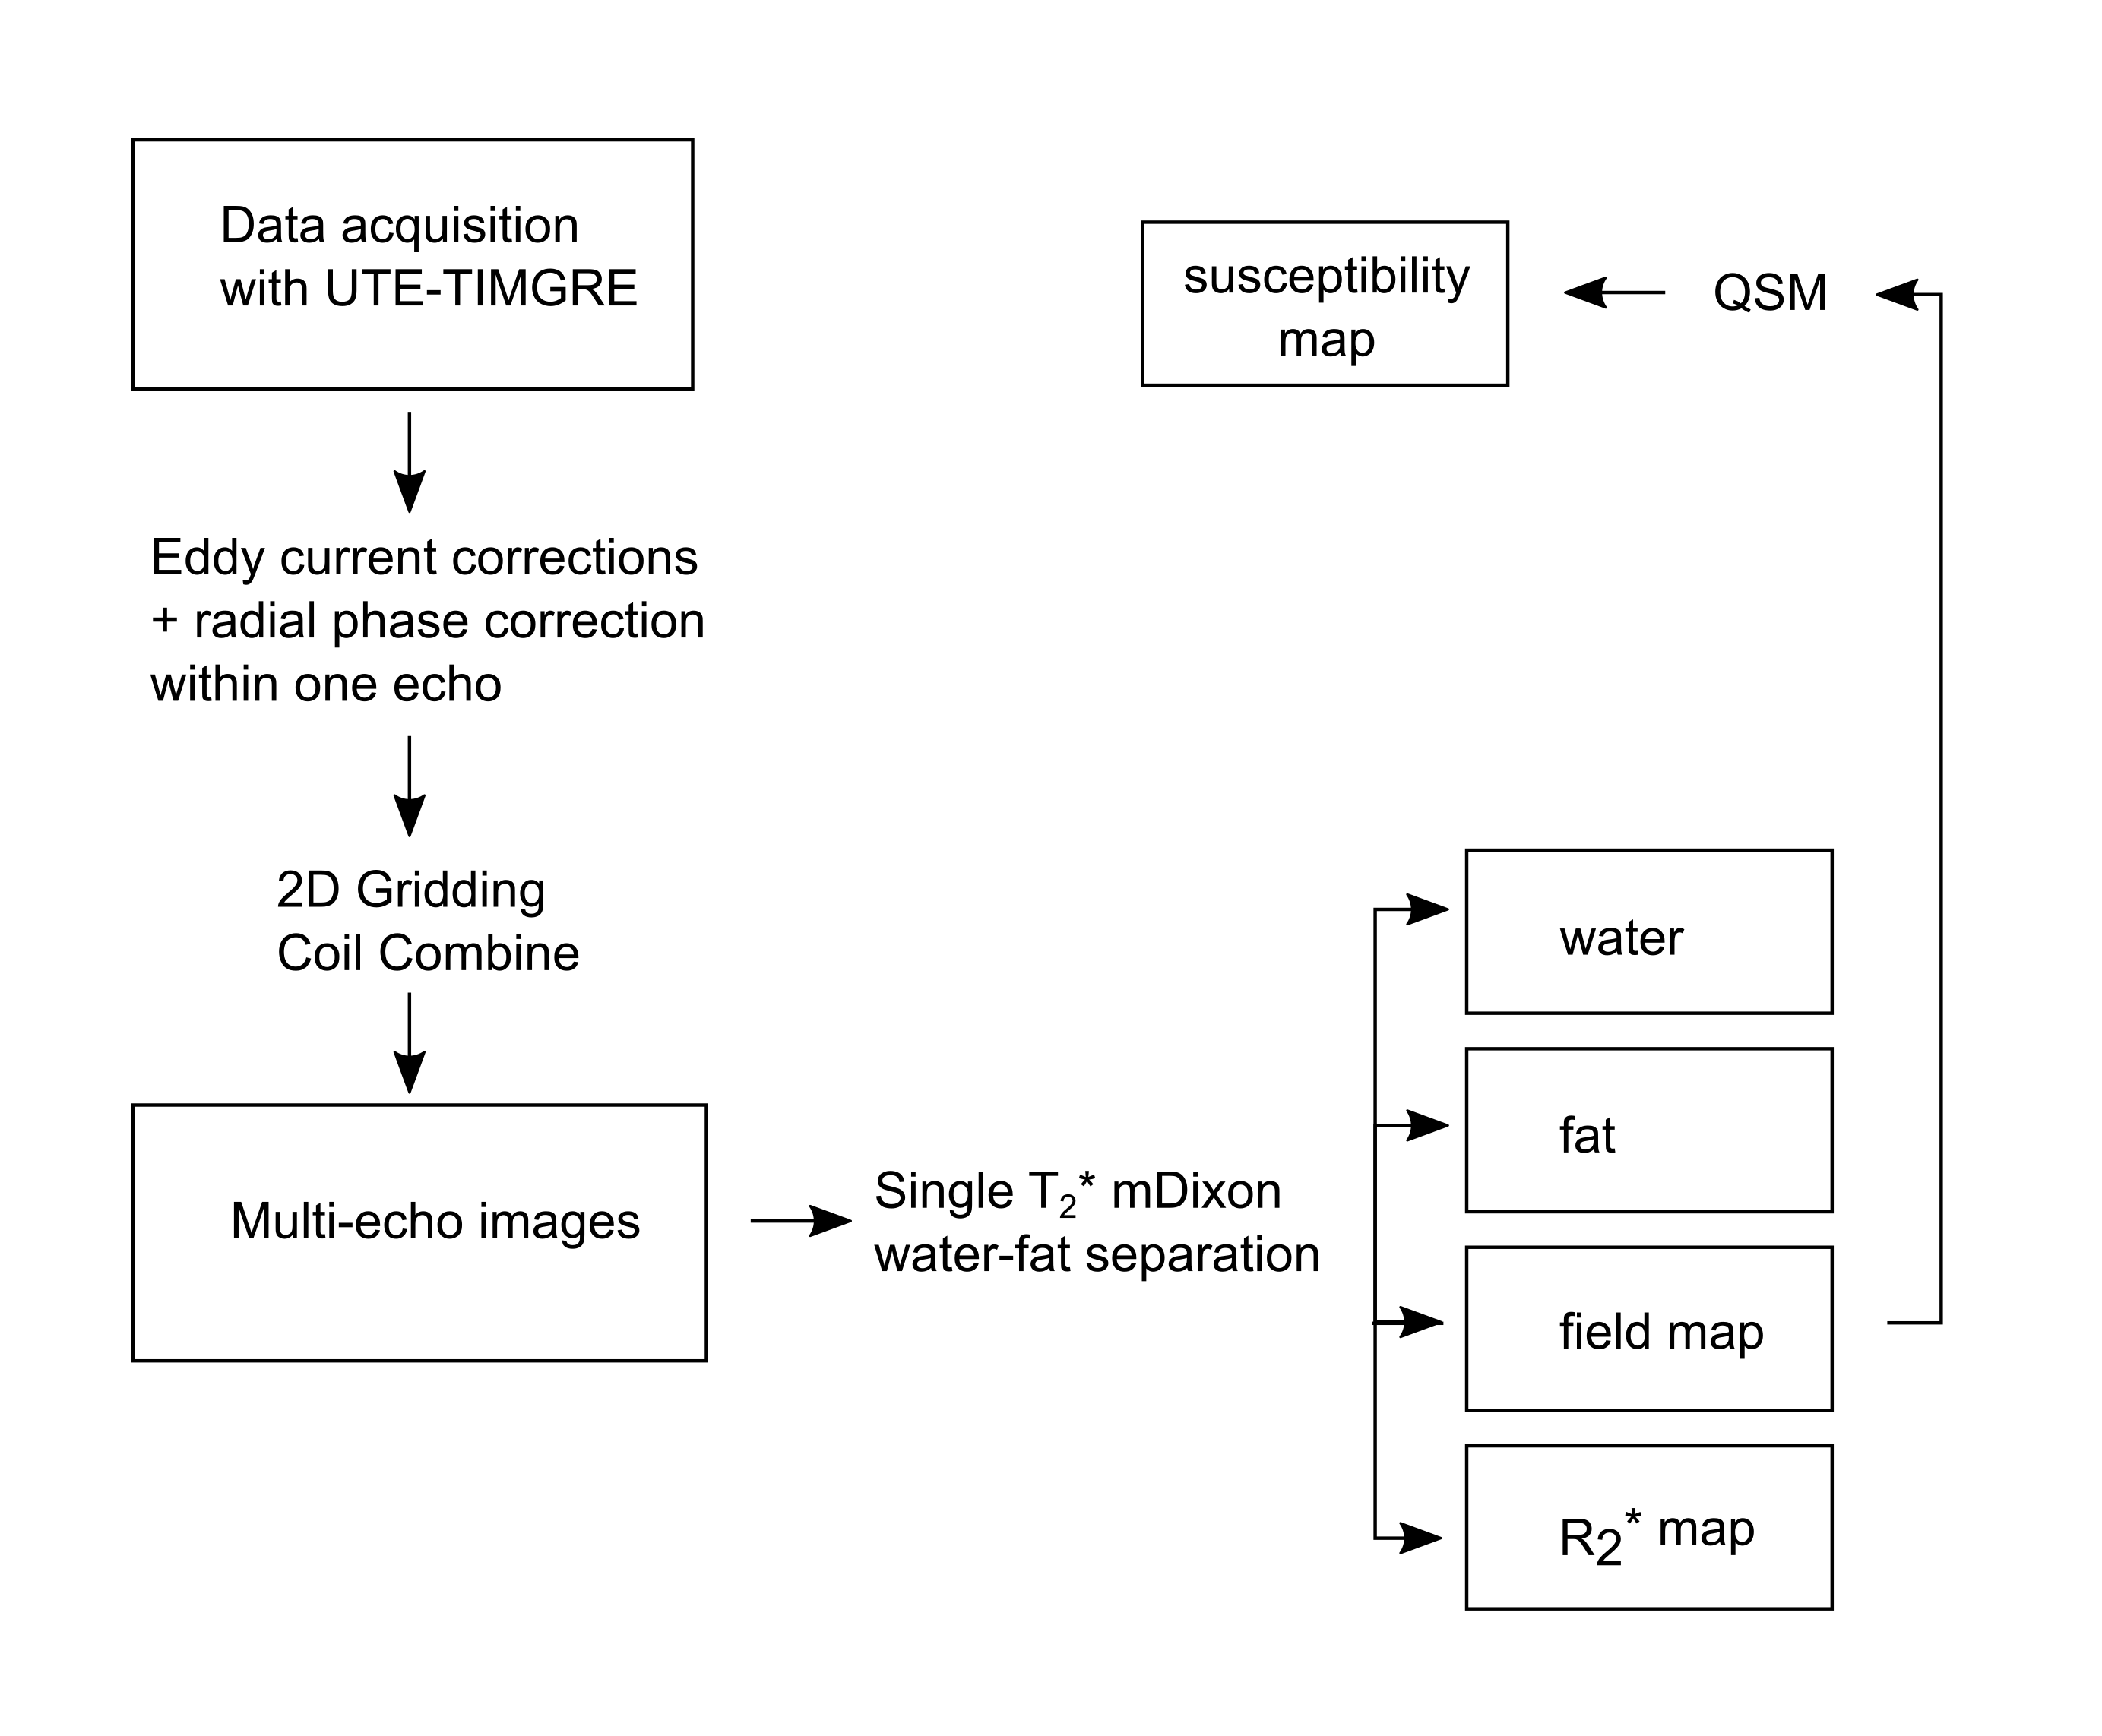
Three-dimensional stack-of-stars UTE data was acquired with an UTE-TIMGRE sequence with three interleaves. After a non-selective block pulse, the free induction decay (FID) was sampled followed by a series of radial gradient echoes with mono-polar readout (Figure 1). With a first TE = 0.14ms the detection of species with ultra-short TEs [6] is achievable, while the time-interleaved multi-echoes allow a short echo spacing for water-fat separation and high image resolution. In-vivo data of the calf-muscle, the upper-knee region and the calcaneus was acquired in healthy subjects at 3T (Ingenia, Phillips Healthcare) with a 8-channel extremity coil and an 8-channel ankle coil, respectively. To enable T2* mapping, 9 gradient echoes in three interleaves were acquired with an effective echo spacing of ΔTE~1ms including three FIDs. The MR image parameters involved were: TE = 0.14/0.19/1.14/2.14/ 2.19/3.14/4.14/4.19/5.14ms, TR = 13ms, flip angle=8°, voxel size 2×2×2 mm3 and total acquisition time ~15min. After acquisition the data has to be corrected for errors in the k-space trajectory and phase due to uncompensated gradient delays and eddy currents (Figure 2). Water-fat separation was performed using a complex-based water-fat separation with a multi-peak fat spectrum and a single R2* component. QSM was performed in two steps involving the Laplacian boundary value method (LBV) for background field removal [7] followed by L2 total variation regularized dipole inversion [8].Results
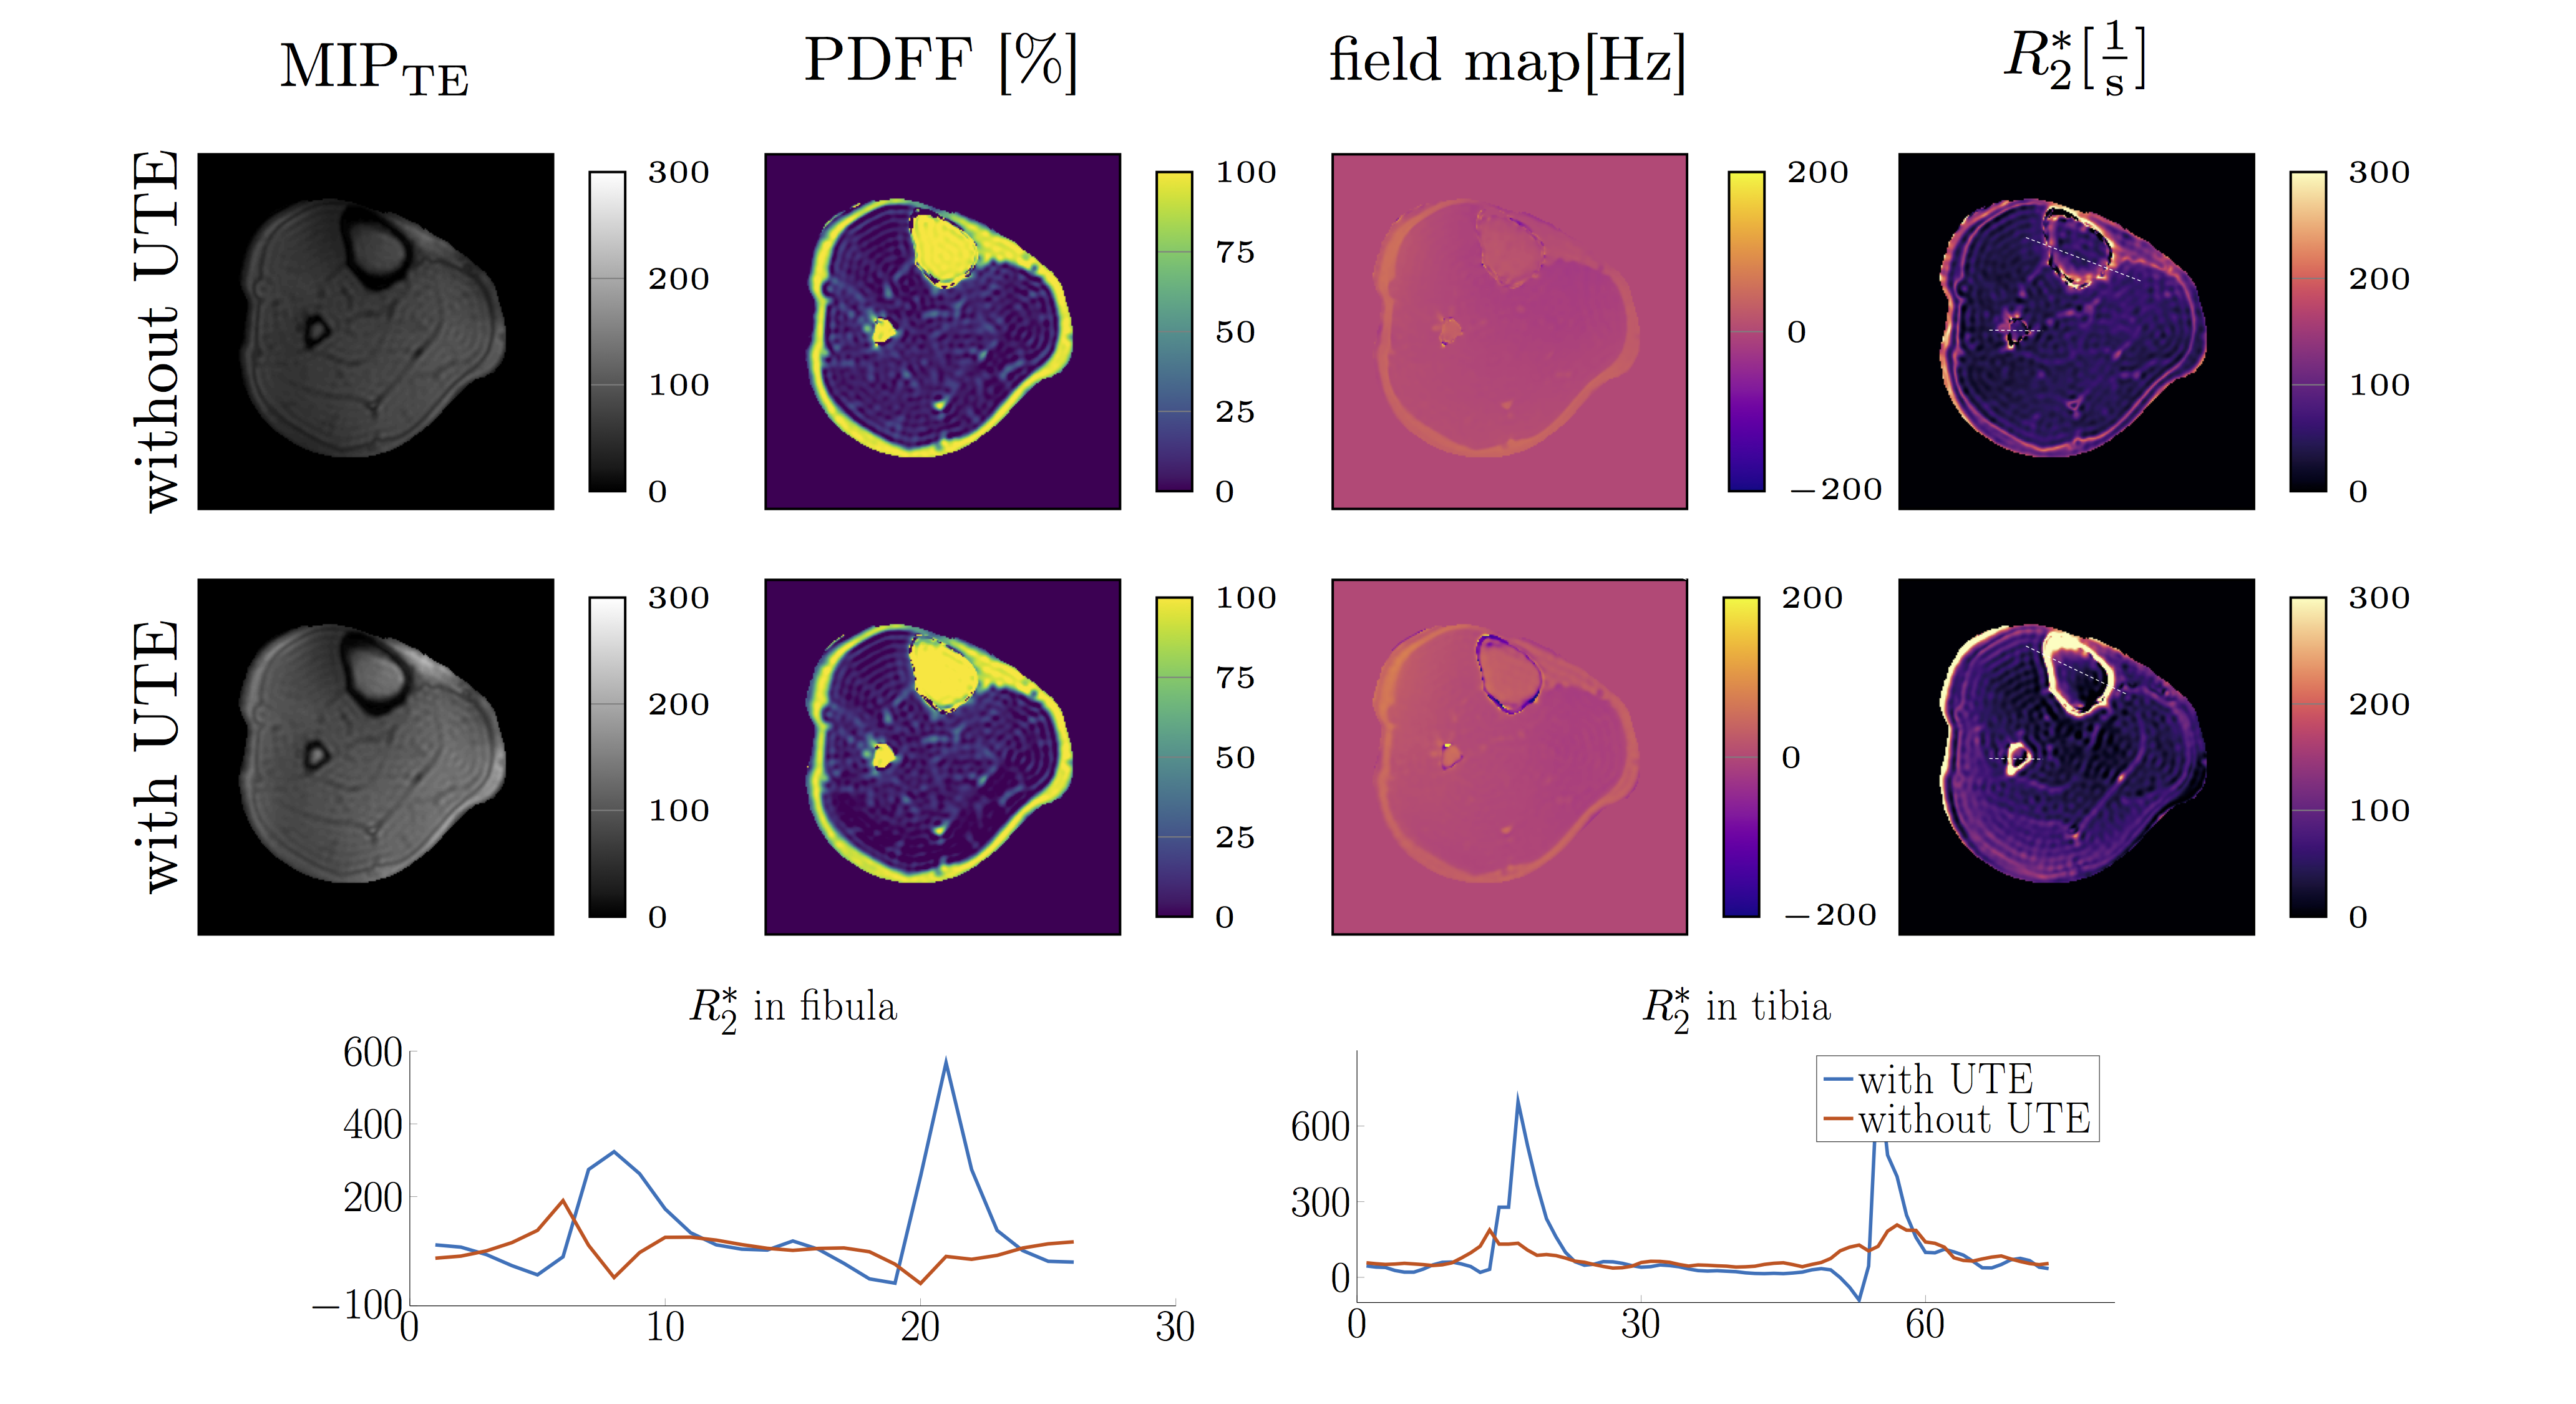
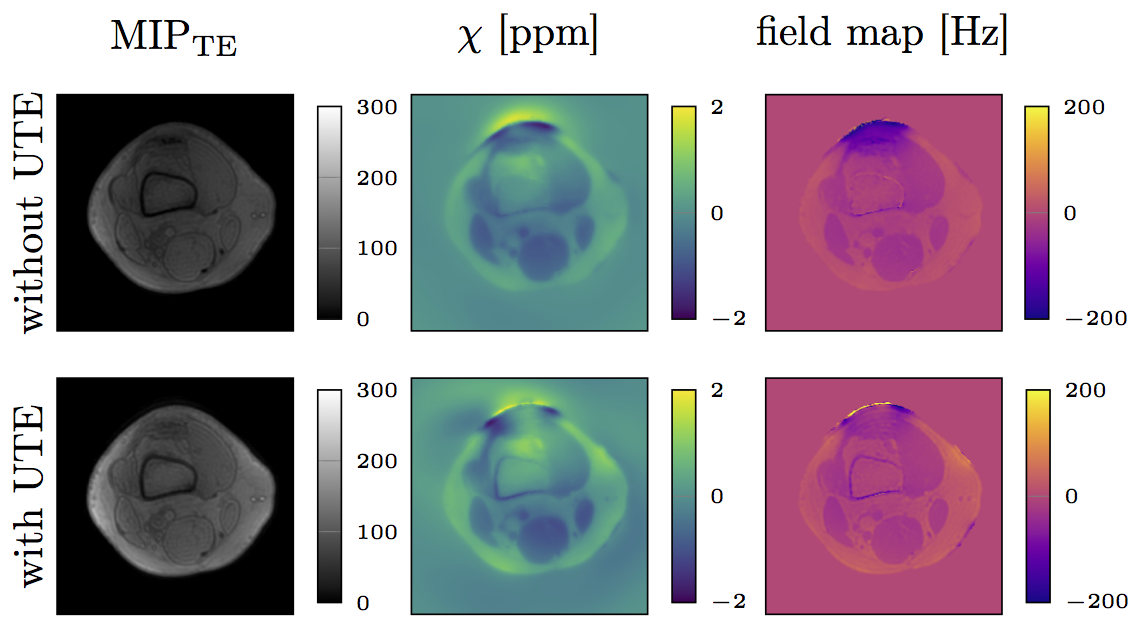
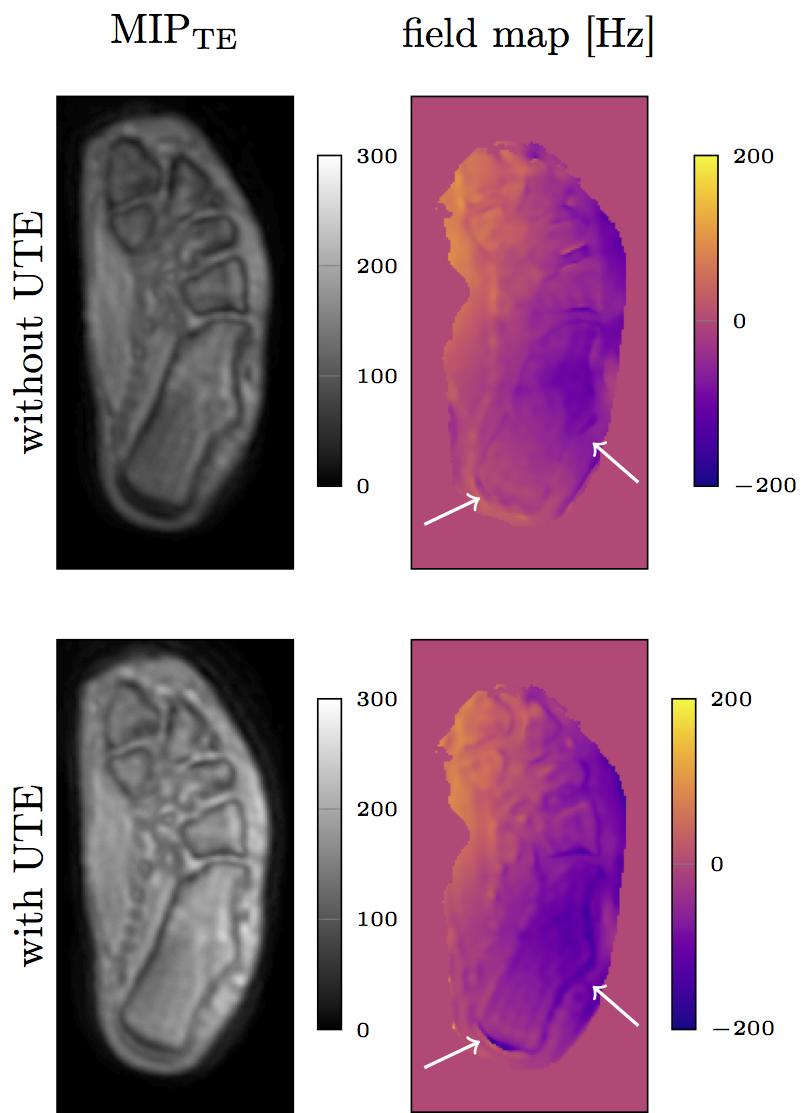
Figure 3 shows the PDFF, fieldmap and R2* map in one representative slice of a healthy volunteer’s calf. Compared to data excluding UTEs, the R2* maps obtained from all echoes display higher R2* values in regions with cortical bone. To highlight the difference in R2* a profile through the fibula and tibia is shown. Except for areas of bone tissue, comparable PDFF maps were obtained for regions containing water and fat. Field map estimation using signal from UTEs is able to detect diamagnetic property of cortical bone. Including UTEs in the estimation of susceptibility maps results in fieldmap values in previously void cortical bone regions. Using this fieldmap values in QSM results in the expected more diamagnetic susceptibility values for cortical bone referenced to muscle. The same effect can be observed in a preliminary investigation of the calcaneus (Figure 5).Conclusion and Discussion
The
combination of UTEs
and a
MGRE sequence can be useful for probing of short T2* components and yields complementary fieldmap values to
quantitative susceptibility mapping of cortical bone. Therefore improved fieldmap estimation based on additional UTE information enables the measurement of previously QSM invisible cortical
bone when aligned with B0. However,
high
PDFF values in cortical bone regions are caused by systematic overestimation using a
multi-component single R2* signal model in regions with low SNR.
Our preliminary investigation in the calcaneus leads to the hypothesis that UTE
multi-echo imaging can enable accurate quantification of bone magnetic susceptibility and could be used to indirectly measure bone density in trabecularized bone marrow. Whereas, to obtain unwrapped susceptibility maps the phase wraps due to the non-equidistant echospacing need further investigation. One limitation of the developed
pulse sequence for a practical application are the long acquisition times. Strategies for accelerating data acquisition will
be investigated including
parallel imaging techniques.
Acknowledgements
The present work was supported by the European Research Council (grant agreement No 677661 – ProFatMRI) and Philips Healthcare.References
[1] Du, J. and Bydder, G.M., 2013. Qualitative and quantitative ultrashort‐TE MRI of cortical bone. NMR in Biomedicine, 26(5), pp.489-506.
[2] Karampinos, D.C., Ruschke, S., Dieckmeyer, M., Diefenbach, M., Franz, D., Gersing, A.S., Krug, R. and Baum, T., 2017. Quantitative MRI and spectroscopy of bone marrow. Journal of Magnetic Resonance Imaging.
[3] Rahmer, J., Bornert, P., Eggers, H., Koken, P. and Groen, J.P., 2010. Merging UTE imaging, water-fat separation, and T2* mapping in a single 3D MSK scan. ISMRM Proceedings, Stockholm, Sweden, pp.1-7.
[4] Diefenbach, M., Simultaneous R2* and Quantitative Susceptibility Mapping of Trabecularized Yellow Bone Marrow: Initial Results in the Calcaneus, abstract 850, Proc. ISMRM 2017
[5] Dimov, A.V., Liu, Z., Spincemaille, P., Prince, M.R., Du, J. and Wang, Y., 2017. Bone quantitative susceptibility mapping using a chemical species–specific R2* signal model with ultrashort and conventional echo data. Magnetic Resonance in Medicine.
[6] I. L. H. Reichert, M. D. Robson, P. D.
Gatehouse, T. He, K. E. Chappell, J. Holmes, S. Girgis, and G. M.
Bydder, “Magnetic resonance imaging of cortical bone with ultrashort TE
pulse sequences,”
Magn Reson Imaging, vol. 23, no. 5, pp. 611–618, Jun. 2005.
[7] Zhou, D., Liu T., Spincemaille P., Wang Y., 2014. Background Field Removal By Solving the Laplacian Boundary Value Problem. NMR in Biomedicine
[8] Bilgic, B., Chatnuntawech, I., Fan, A.P., Setsompop, K., Cauley, S.F.,
Wald, L.L. and Adalsteinsson, E., 2014. Fast image reconstruction with
L2‐regularization. Journal of Magnetic Resonance Imaging, 40(1), pp.181-191.
Figures