5156
Image derived arterial input function using popliteal artery for [18F]-sodium fluoride (NaF) PET/MRI1Dep. of Clinical Physiology, Nuclear Medicine and PET, Rigshospitalet, Copenhagen University Hospital, Copenhagen, Denmark, 2Department of Radiology, Stanford University, Stanford, CA, United States
Synopsis
This study evaluates the feasibility of performing dynamic [18F]-sodium fluoride (NaF) kinetic studies of the knee using PET/MRI with a focus on determining a robust method to produce an image derived input function (IDIF) using MRI images. Input functions are created using an angiography sequence to isolate the popliteal arteries and create intravascular ROIs centred in the artery to measure blood activity. 12 subjects were given two injections 75 min apart and the derived IDIFs were compared for reproducibility and accuracy. The resulting IDIFs had high reproducibility and gave values matching blood samples and literature values. Given its accuracy and robustness, this technique is well suited for clinical PET/MRI examinations.
INTRODUCTION
New integrated PET-MRI systems combine the advantages of MRI with molecular information from [18F]-sodium fluoride (NaF) PET, which has shown promise in early detection of metabolic abnormalities of bone metabolism in osteoarthritis(1,2) and associations to pain(1–4). Kinetic modeling of dynamic [18F]-NaF PET uptake can provide a fully quantitative measure of tracer kinetics and offers novel biomarkers of bone blood flow and bone mineralization rates.However, these kinetic models are dependent on obtaining an accurate arterial input function, which is often challenging due to partial voluming of the low-resolution PET images. Simultaneously acquired MRI presents an opportunity to gain high-resolution angiographic information to address this challenge. This study evaluates the feasibility of determining a robust method to produce an optimized and reproducible image derived input function (IDIF) from the PET and MRI images themselves.Methods
The study was in compliance with the local Institutional Review Board and all subjects provided written consent prior to the study. 12 healthy subjects (7 females; age: 22-44 years) were hand-injected via an intravenous catheter with 92.5 MBq of [18F]-NaF and scanned on a 3T whole-body time-of-flight PET-MRI hybrid system (GE Healthcare, Milwaukee, WI). Both knees were scanned simultaneously using one PET bed (longitudinal (z) field of view = 26 cm) for 50 min. Magnetic resonance angiography (MRA) data were acquired simultaneously using a 3D GRE with 18 slices of 1.2 mm thickness, TR / TE = 21/2.1 ms and a flip angle of 15°. Dynamic PET frame times used for IDIF were 40 x 1 s, 13 x 10 s and 23 x 2 min. A 3 mL venous blood sample was taken 50 min after injection when arterial and venous blood concentrations have equilibrated and measured in a well counter (5). The procedure was repeated with a second injection performed 75 min after the first injection. One subject repeated the double injection paradigm on three separate days to evaluate intra-subject reproducibility.
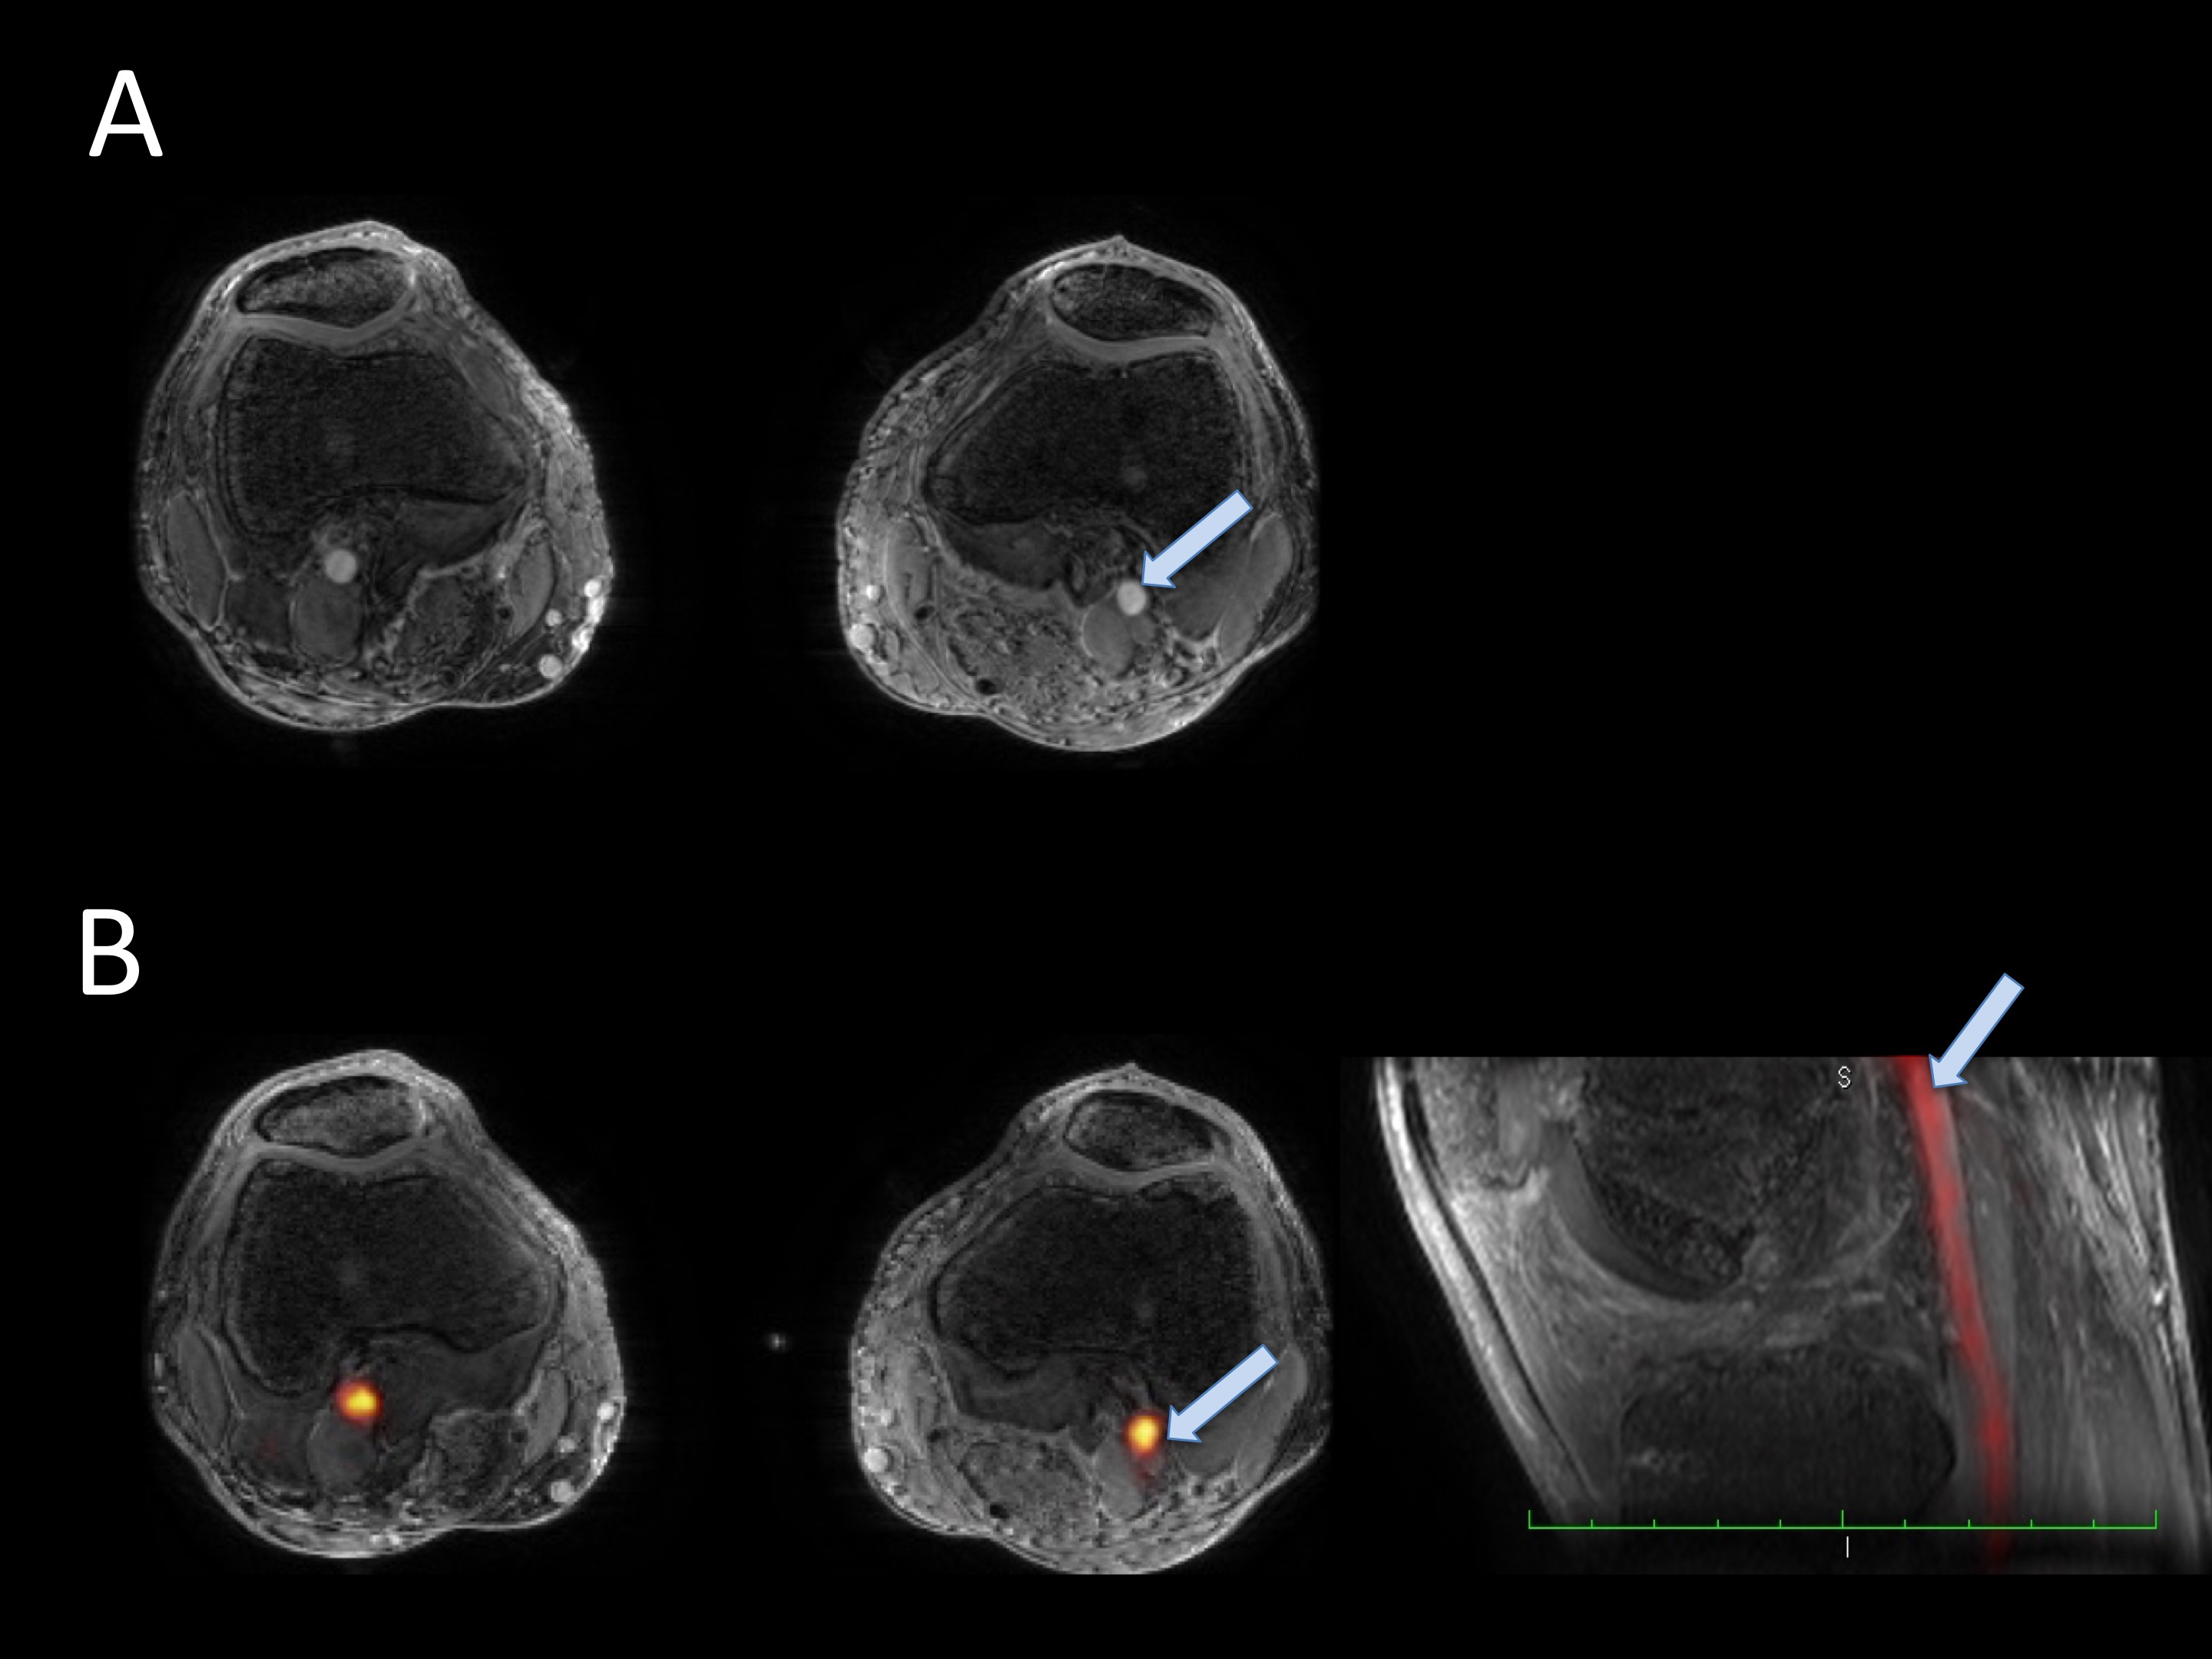
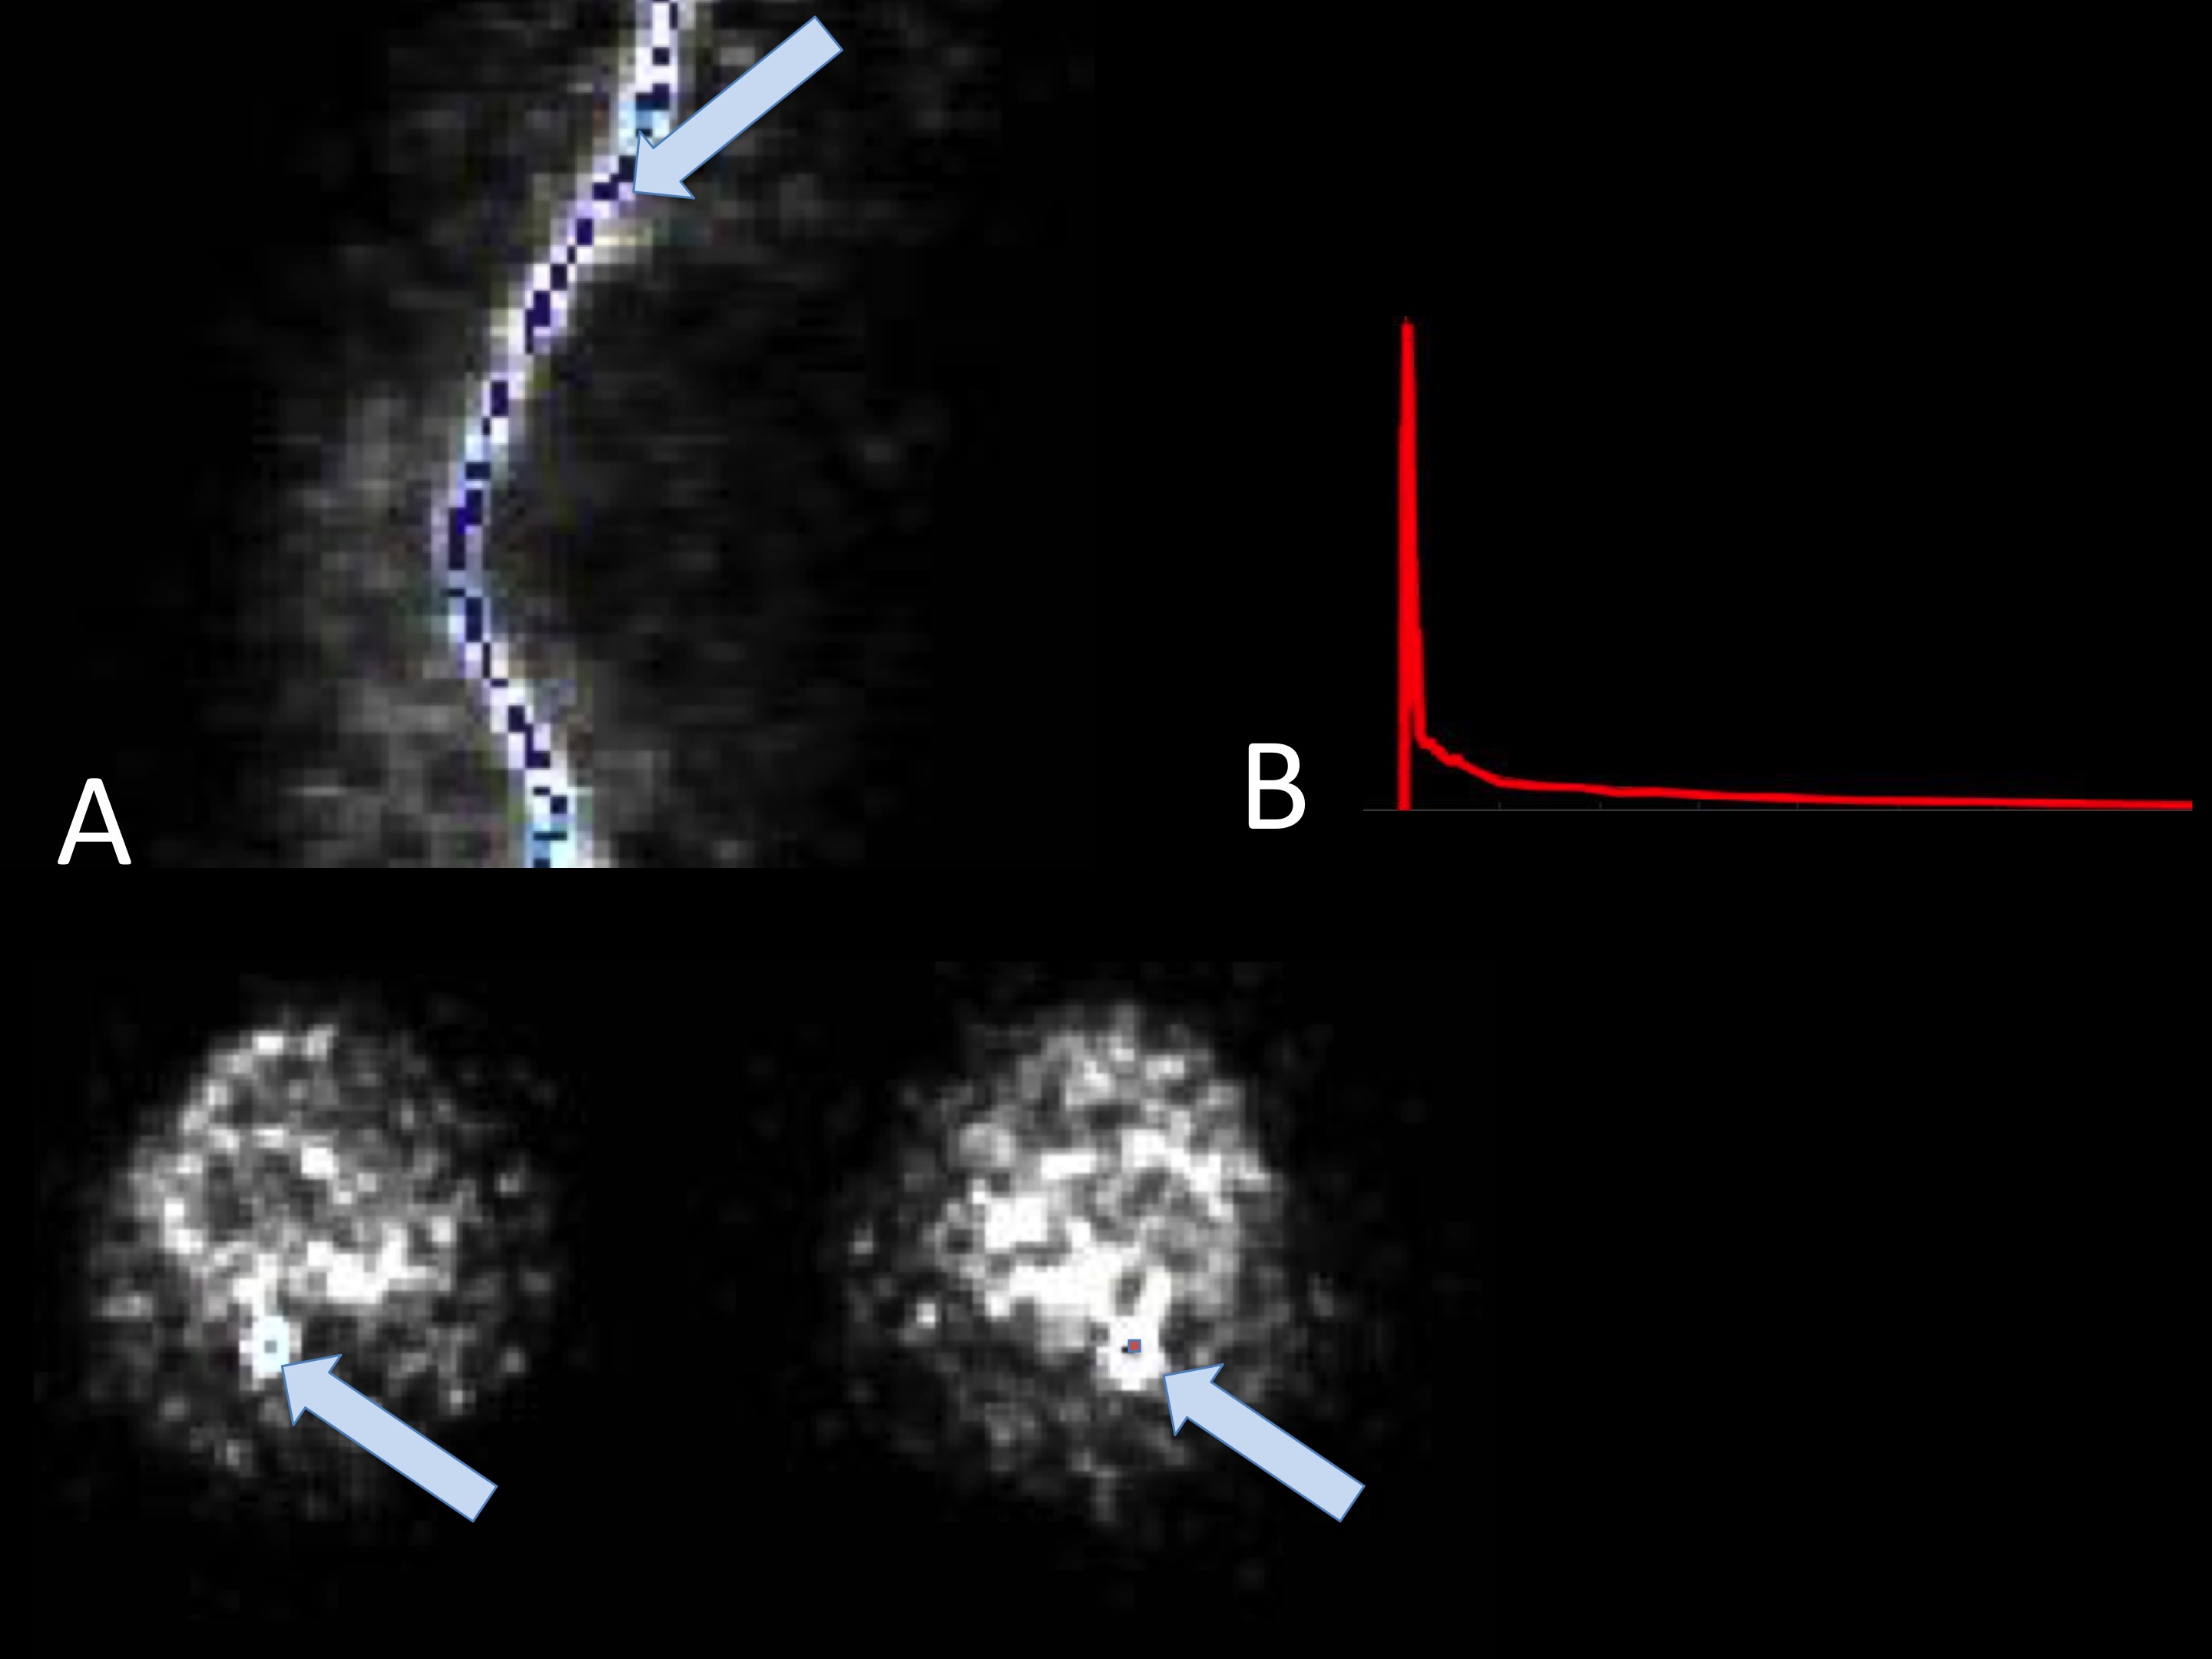
The image derived input function (IDIF) was determined from [18F]-NaF activity (kBq/ml) within the popliteal arteries. The artery was segmented automatically from MRA images and applied to a short time-frame PET angiogram (PETA) during the arterial phase (0-16s after injection) when the tracer is predominantly in the arteries, as shown in Figure 1(6). In order to minimize spill-over artifacts(7), the voxels centered in the middle of the artery were determined for each dynamic and used for the IDIF ROI (figure 2). Centered voxels were defined by including the voxels in each axial slice within the highest 10% of arterial NaF activity. IDIF functions from all injections were aligned such that the first time point with measured activity was set as time t=0. Reproducibility of IDIF was measured as coefficient of variation (CV) calculated between measures on the first and second injection of all subjects. Day to day variation in one subject paired first injections and paired second injections across days for comparison.
Results
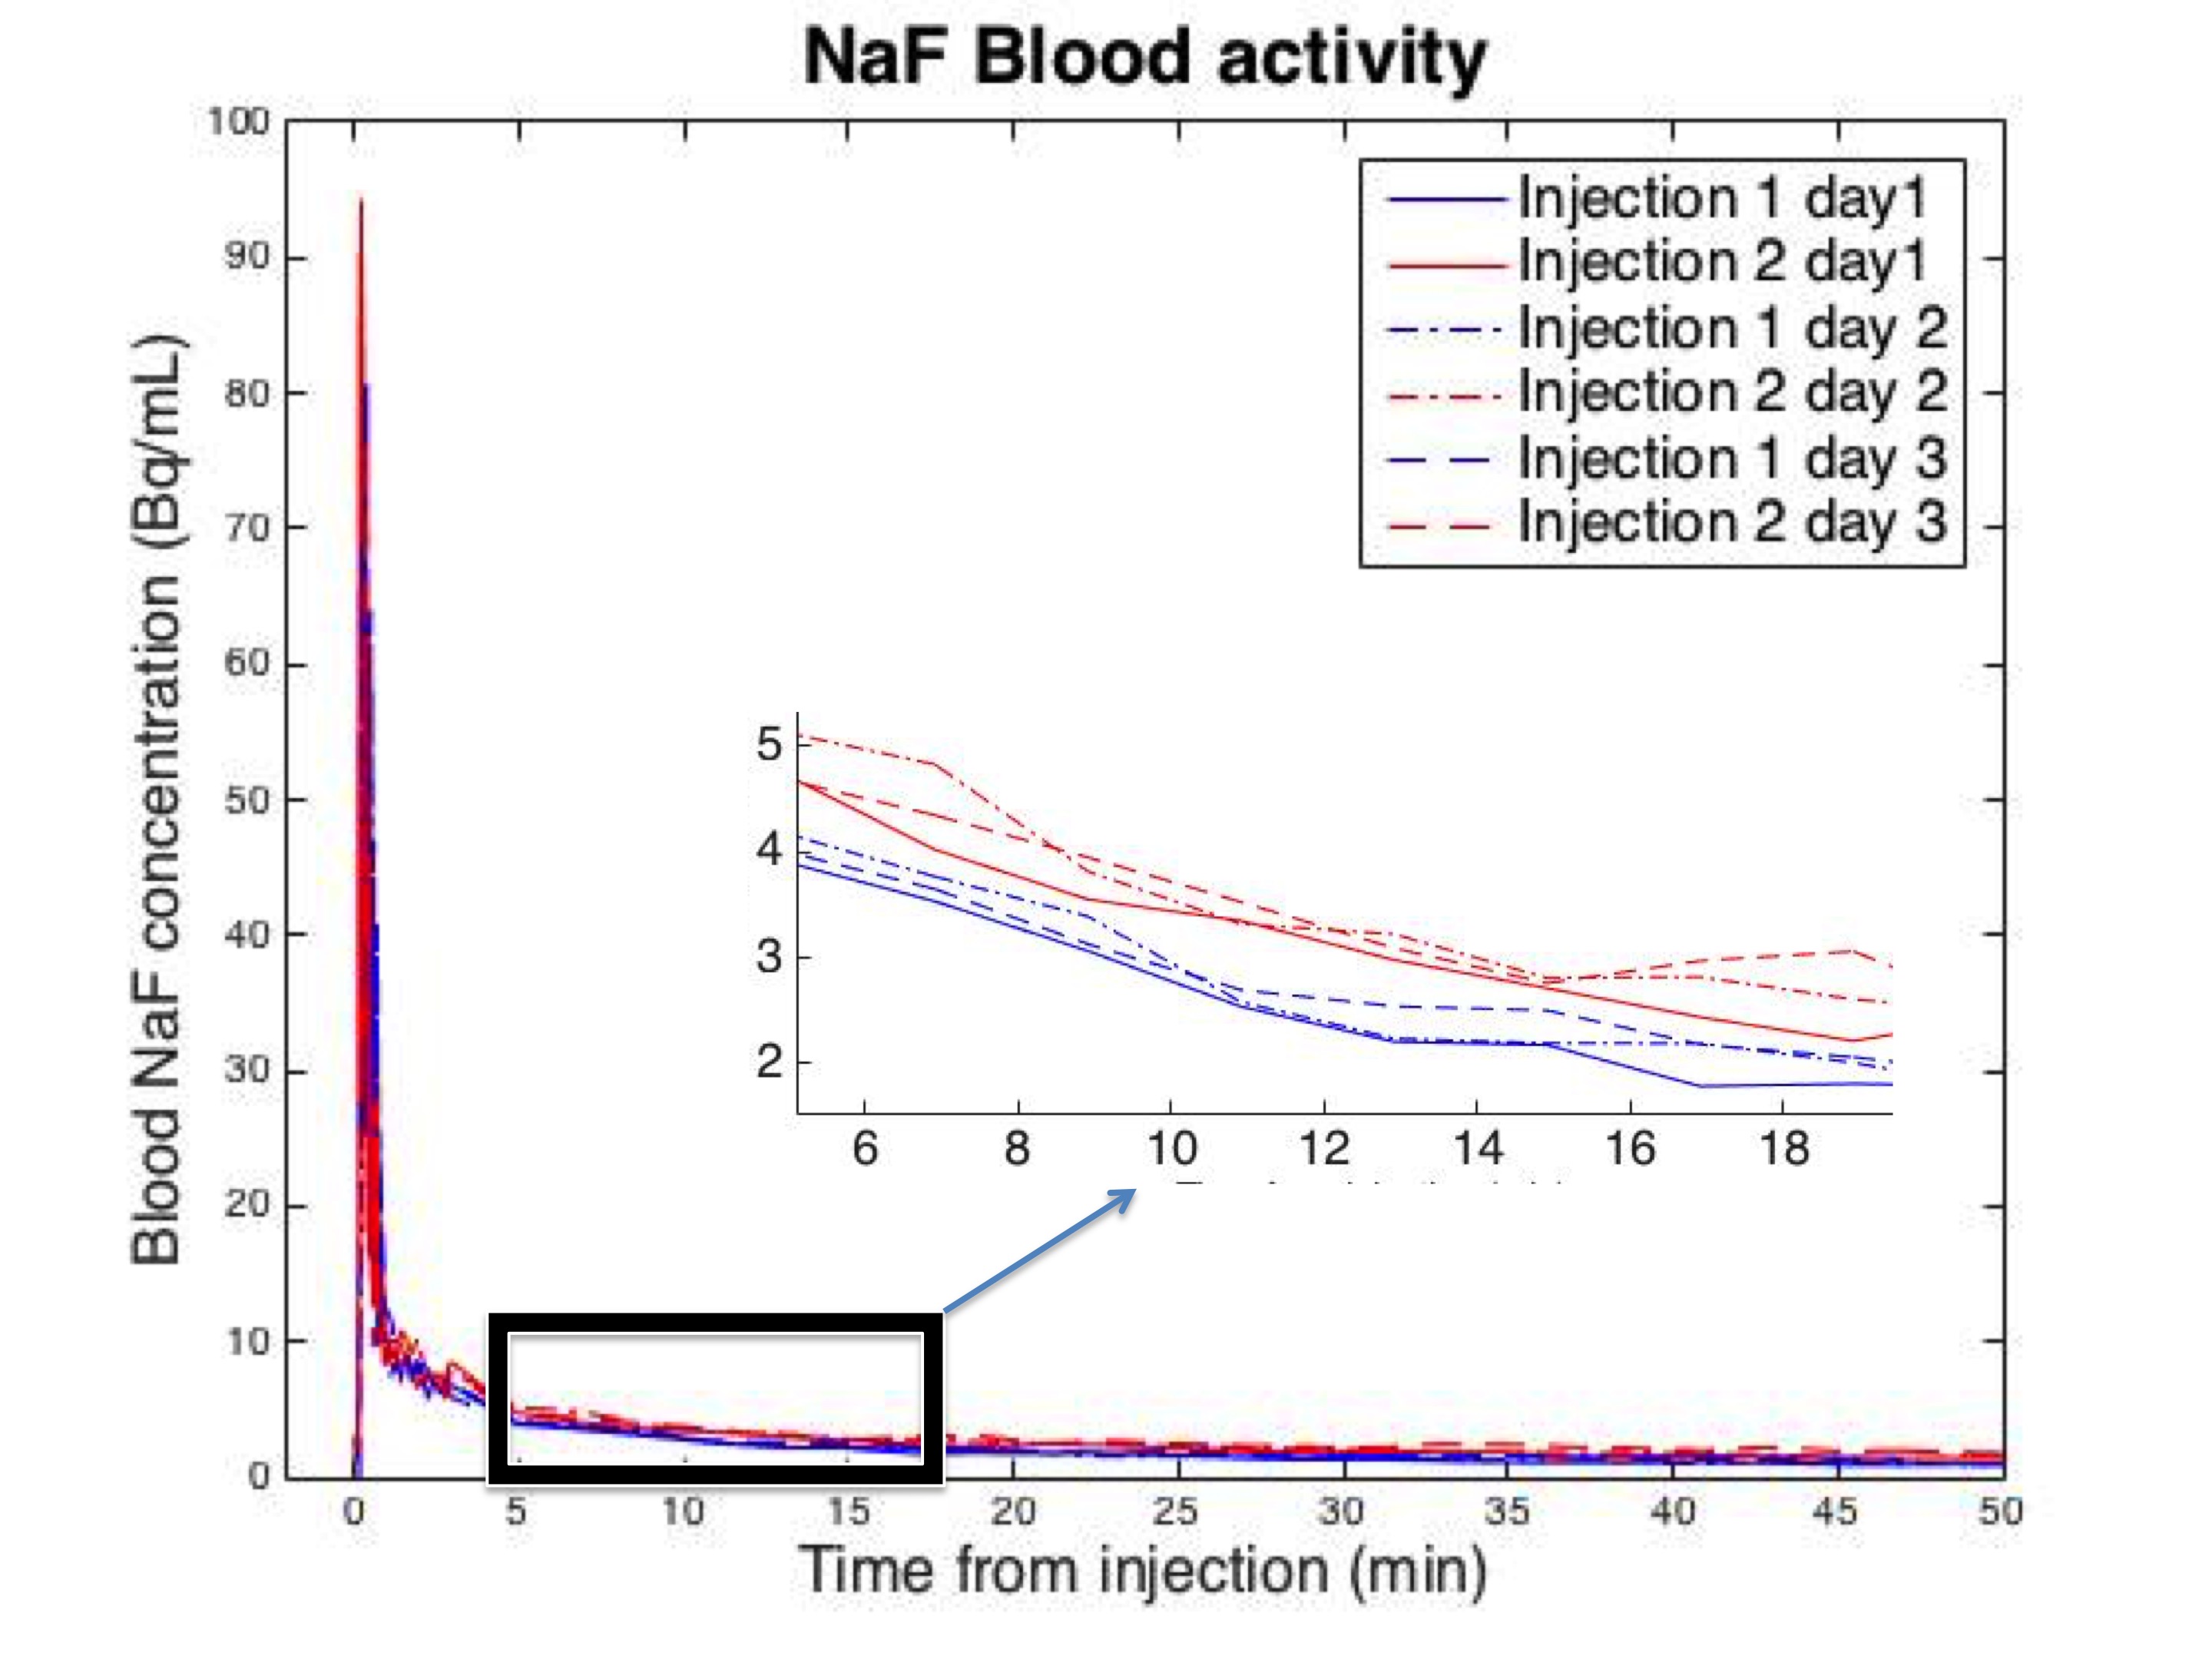
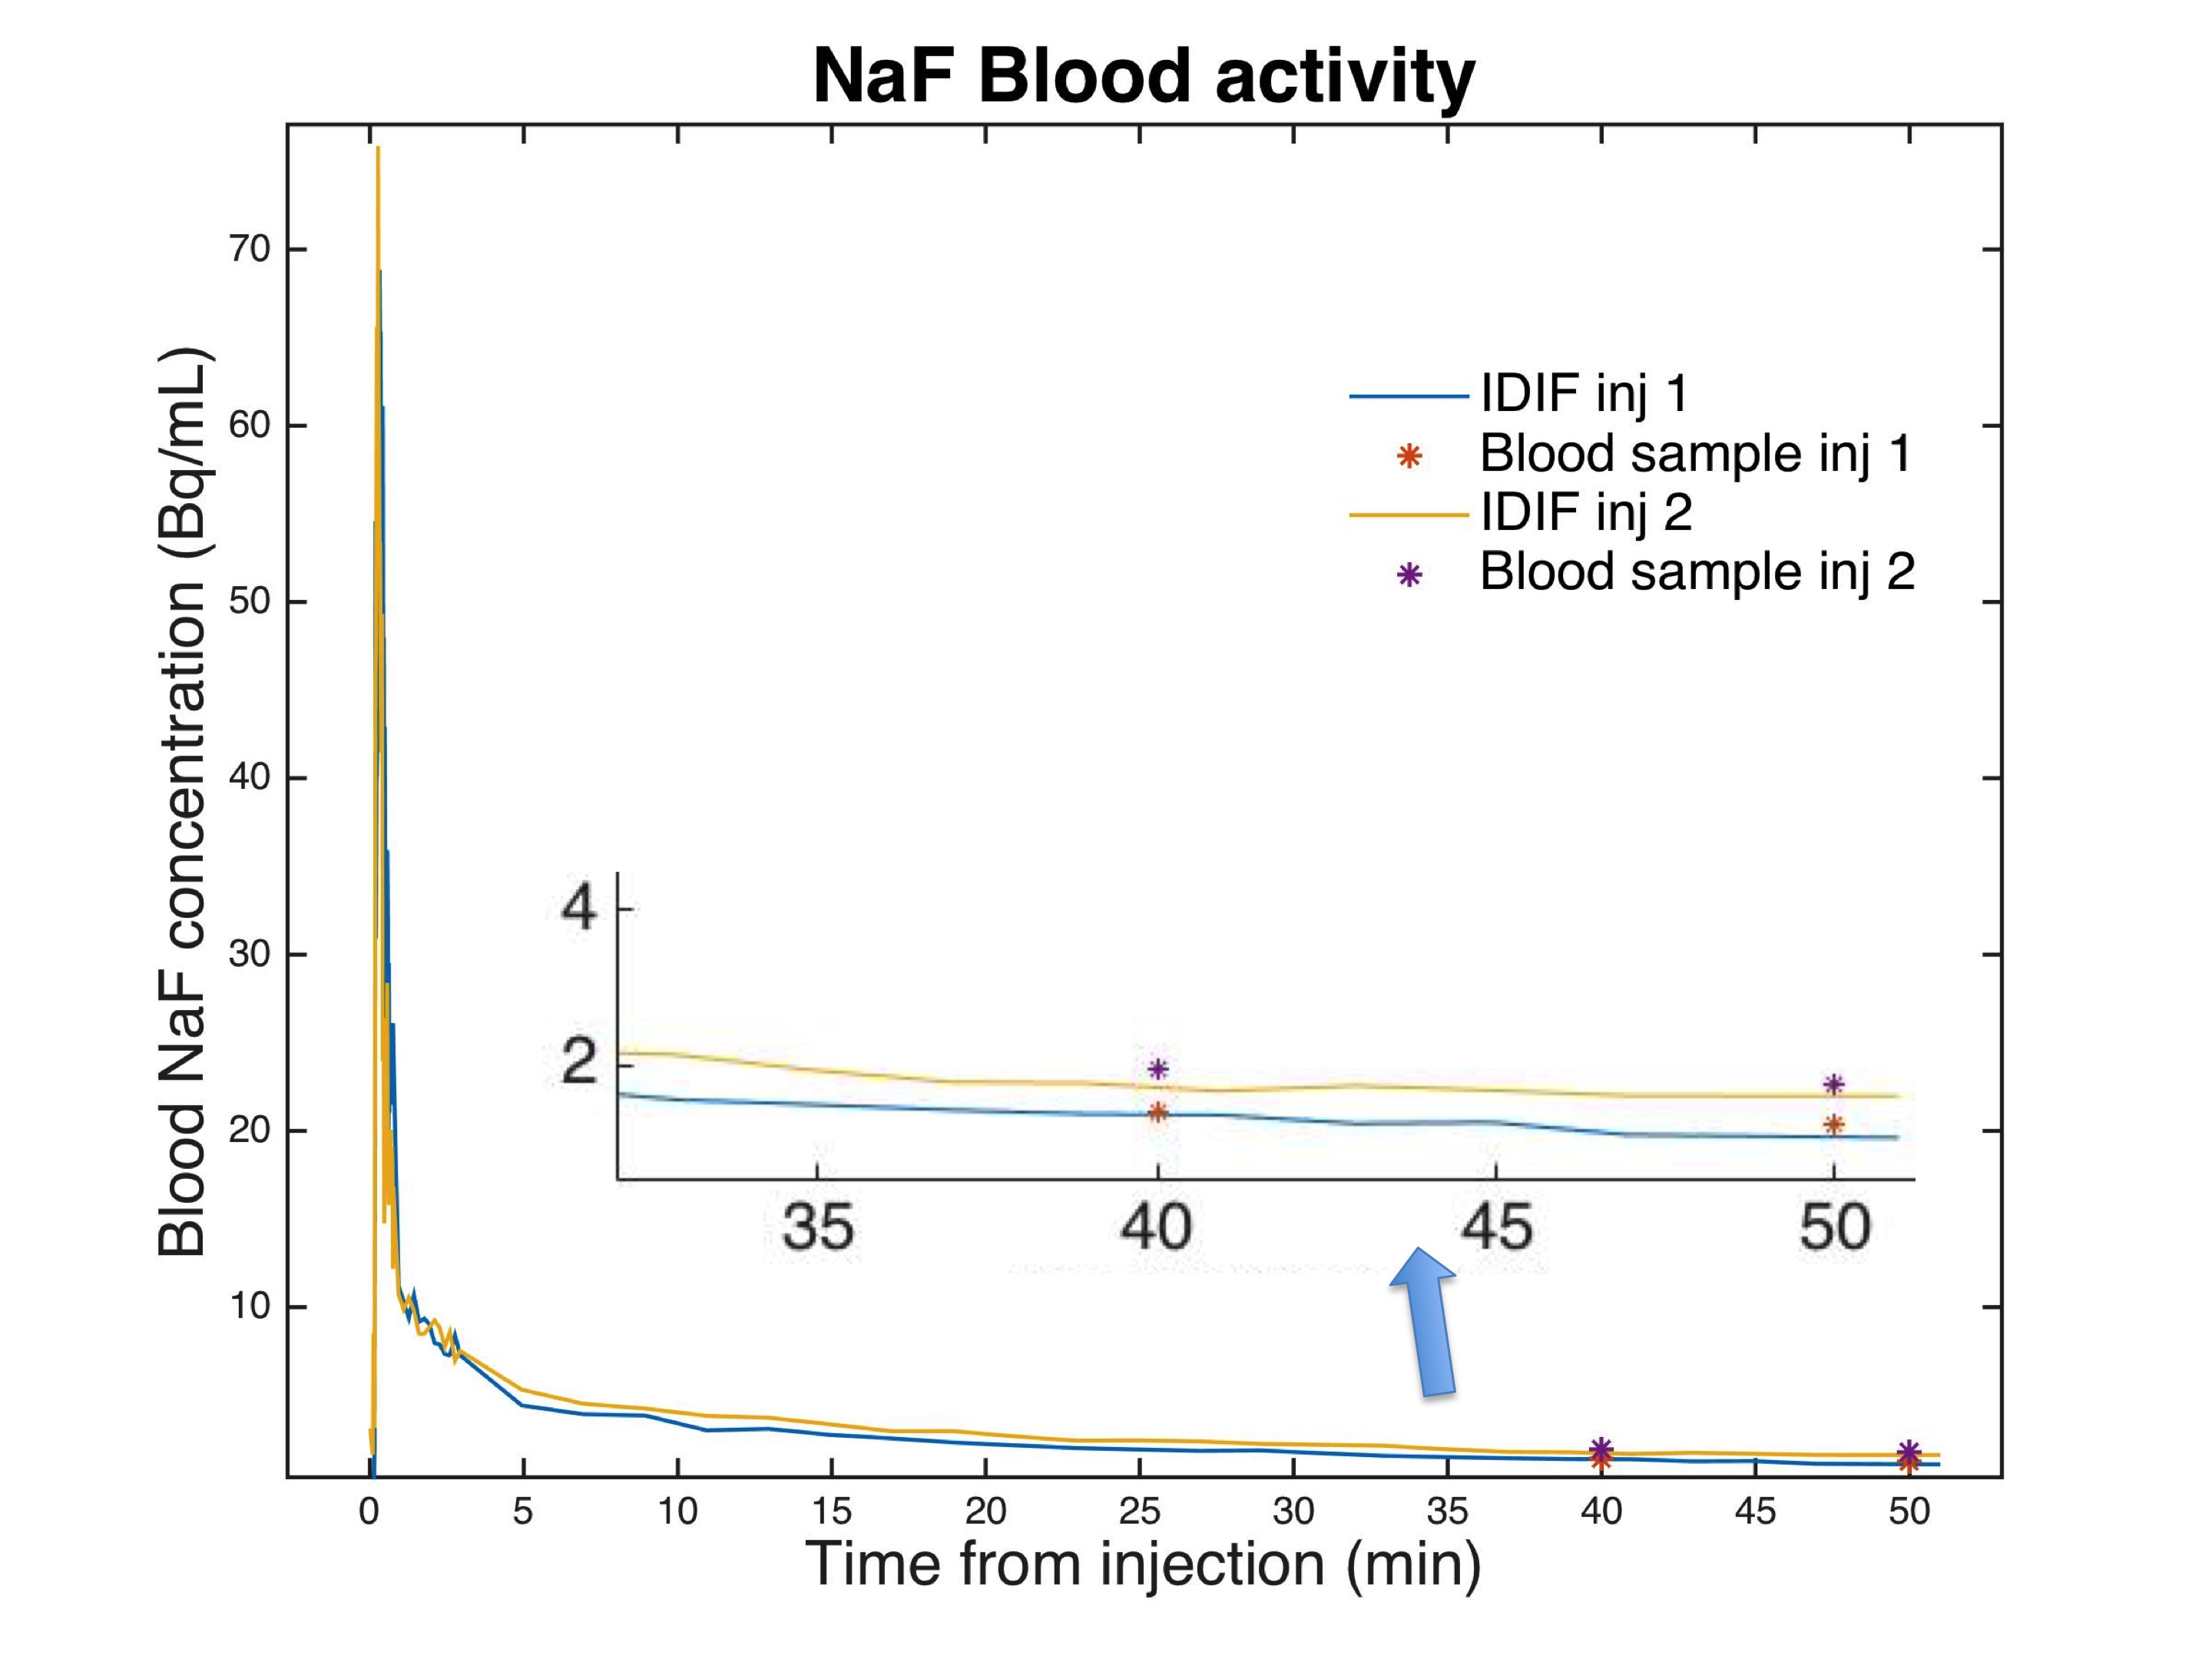
Day to day variation of IDIF for a single subject was low (Figure 3). CV values were, 4.5% at 2 minutes after injection, 3% at 10 min, 8.3% at 25 min. Differences between venous blood samples and IDIF values measured at 50 min were on average within 0.2 KBq/mL, which corresponds to a CV of 12% (Figure 4). Comparing the computed IDIF between repeated acquisitions across 12 subjects, a CV of 8.4% was observed at 2 min after injection, 10.6% at 10 min, 9.9% at 25 min. The input function of the second injection was on average 0.25 KBq/mL higher than the first injection throughout the 50-minute time period across all subjects.Discussion
Input function values corresponded well with literature reported input function values from arterial sampling (5) and visual inspection of generated ROIs confirmed successful automated segmentation of the popliteal artery. CV values comparing day to day variation were lower than those from repeated injections. This is attributed to values from the second injection being slightly higher than the first. We believe this increase to simply be due to unbound rest activity in tissue from the first injection returning to the vascular system and not due to the IDIF method.Conclusion
We have shown the feasibility of using MR angiography, in combination with a short time-frame PET angiogram, to create an image derived input function from the popliteal artery with high reproducibility and good accuracy. IDIF values were derived in an automated and easily applicable to a clinical setting.Acknowledgements
This work was funded by GE Healthcare and National Institute of Health (NIH) grants K99EB022634, R01EB002524, and K24AR062068.References
1. Kogan F, Fan AP, McWalter EJ, Oei EHG, Quon A, Gold GE. PET/MRI of metabolic activity in osteoarthritis: A feasibility study. J Magn Reson Imaging. 2016 Oct 31;45(6):1736–45. 2. Savic D, Pedoia V, Seo Y, Yang J, Bucknor M, Franc BL, et al. Imaging Bone-Cartilage Interactions in Osteoarthritis Using [(18)F]-NaF PET-MRI. Mol Imaging. 2016 Jan 1;15:1–12. 3. Kobayashi N, Inaba Y, Tateishi U, Ike H, Kubota S, Inoue T, et al. Comparison of 18F-fluoride positron emission tomography and magnetic resonance imaging in evaluating early-stage osteoarthritis of the hip. Nucl Med Commun. 2015 Jan;36(1):84–9. 4. Draper CE, Quon A, Fredericson M, Besier TF, Delp SL, Beaupre GS, et al. Comparison of MRI and 18F-NaF PET/CT in patients with patellofemoral pain. J Magn Reson Imaging. 2012 Oct;36(4):928–32. 5. Blake GM, Siddique M, Puri T, Frost ML, Moore AE, Cook GJR, et al. A semipopulation input function for quantifying static and dynamic 18F-fluoride PET scans. Nucl Med Commun. 2012 Aug;33(8):881–8. 6. Khalighi MM, Deller TW, Fan AP, Gulaka PK, Shen B, Singh P, et al. Image-derived input function estimation on a TOF-enabled PET/MR for cerebral blood flow mapping. J Cereb Blood Flow Metab. 2017 Jan 1;271678X17691784. 7. Lüdemann L, Sreenivasa G, Michel R, Rosner C, Plotkin M, Felix R, et al. Corrections of arterial input function for dynamic H215O PET to assess perfusion of pelvic tumours: arterial blood sampling versus image extraction. Phys Med Biol. 2006 Jun 7;51(11):2883–900.Figures