5155
Ultra-short echo time (UTE) imaging with Three-component fitting analysis of human cortical bone1Department of Radiology, University of California, San Diego, San Diego, CA, United States, 2Institute of Electrical Engineering, Chinese Academy of Science, Beijing, China, 3GE Healthcare, San Diego, CA, United States, 4Department of Medicine, Division of Hematology/Oncology, University of California, San Diego, San Diego, CA, United States, 5Radiology Service, VA San Diego Healthcare System, San Diego, CA, United States
Synopsis
Increased cortical porosity is a major cause of the decreased strength of osteoporotic bone, which can be evaluated by MRI based bone water components analysis. The chemical shift caused by fat in the bone may lead to incorrect estimation of water components with a bi-component exponential model. Thus, we propose a tri-component fitting method for accurate bound and pore water quantification incorporating a multi-peak spectral modeling of fat. Nine human cortical bone samples were studied. Our results suggest improved curve fitting and additional information when a tri-component analyses is used.
Introduction
Decrease in bone mineralization and degradation of bone architecture, including trabecular loss, cortical thinning, and enlargement of cortical pores, occur with advancing age and in certain disease states such as osteoporosis. In particular, increased cortical porosity is a major cause of the decreased strength of osteoporotic bone1,2. It has been shown that porosity can be evaluated by magnetic resonance imaging (MRI)-based quantification of bone water3. Bi-component exponential T2* fitting has been one of the methods purported to separate bound and pore water in order to quantify matrix density and porosity4. However, human cortical bone may possess considerable amounts of fat that contribute to the total MRI signal in addition to the water components. The chemical shift caused by fat in the bone may lead to incorrect estimation of water components when a bi-component exponential model is used. Thus, we propose a tri-component fitting method for accurate bound and pore water quantification incorporating a multi-peak spectral modeling of fat.Methods
Cadaveric human cortical bone samples (n = 9) (6 females, 3 males, 38-95 years old) were obtained from tissue banks, as approved by our Institutional Review Board. These samples were sectioned and stored in phosphate buffered saline (PBS) solution for 24 hours prior to imaging.
MRI of the specimens was performed on a 3T Signa HDxt scanner (GE Healthcare Technologies, Milwaukee, Wisconsin, USA) using a previously reported three-dimensional UTE Cones (3D UTE Cones) sequence. A transmit/receive quadrature coil (BC-10, Medspira, Minneapolis, Minnesota, USA) with a diameter of 22 cm was used for signal excitation and reception. Scan parameters included: sampling bandwidth (BW) = 83.3 kHz, flip angle = 10°, TR = 30 ms, matrix size = 128×128, in-plane pixel size = 1×1*3 mm3. UTE images were acquired with a series of 18 TE delays (TE = 0.032, 0.2, 0.4, 0.6, 0.8,1.2, 1.6, 2.4, 3, 3.6, 4.4, 5.2, 6, 6.8, 7.6, 15,20, 25 ms).
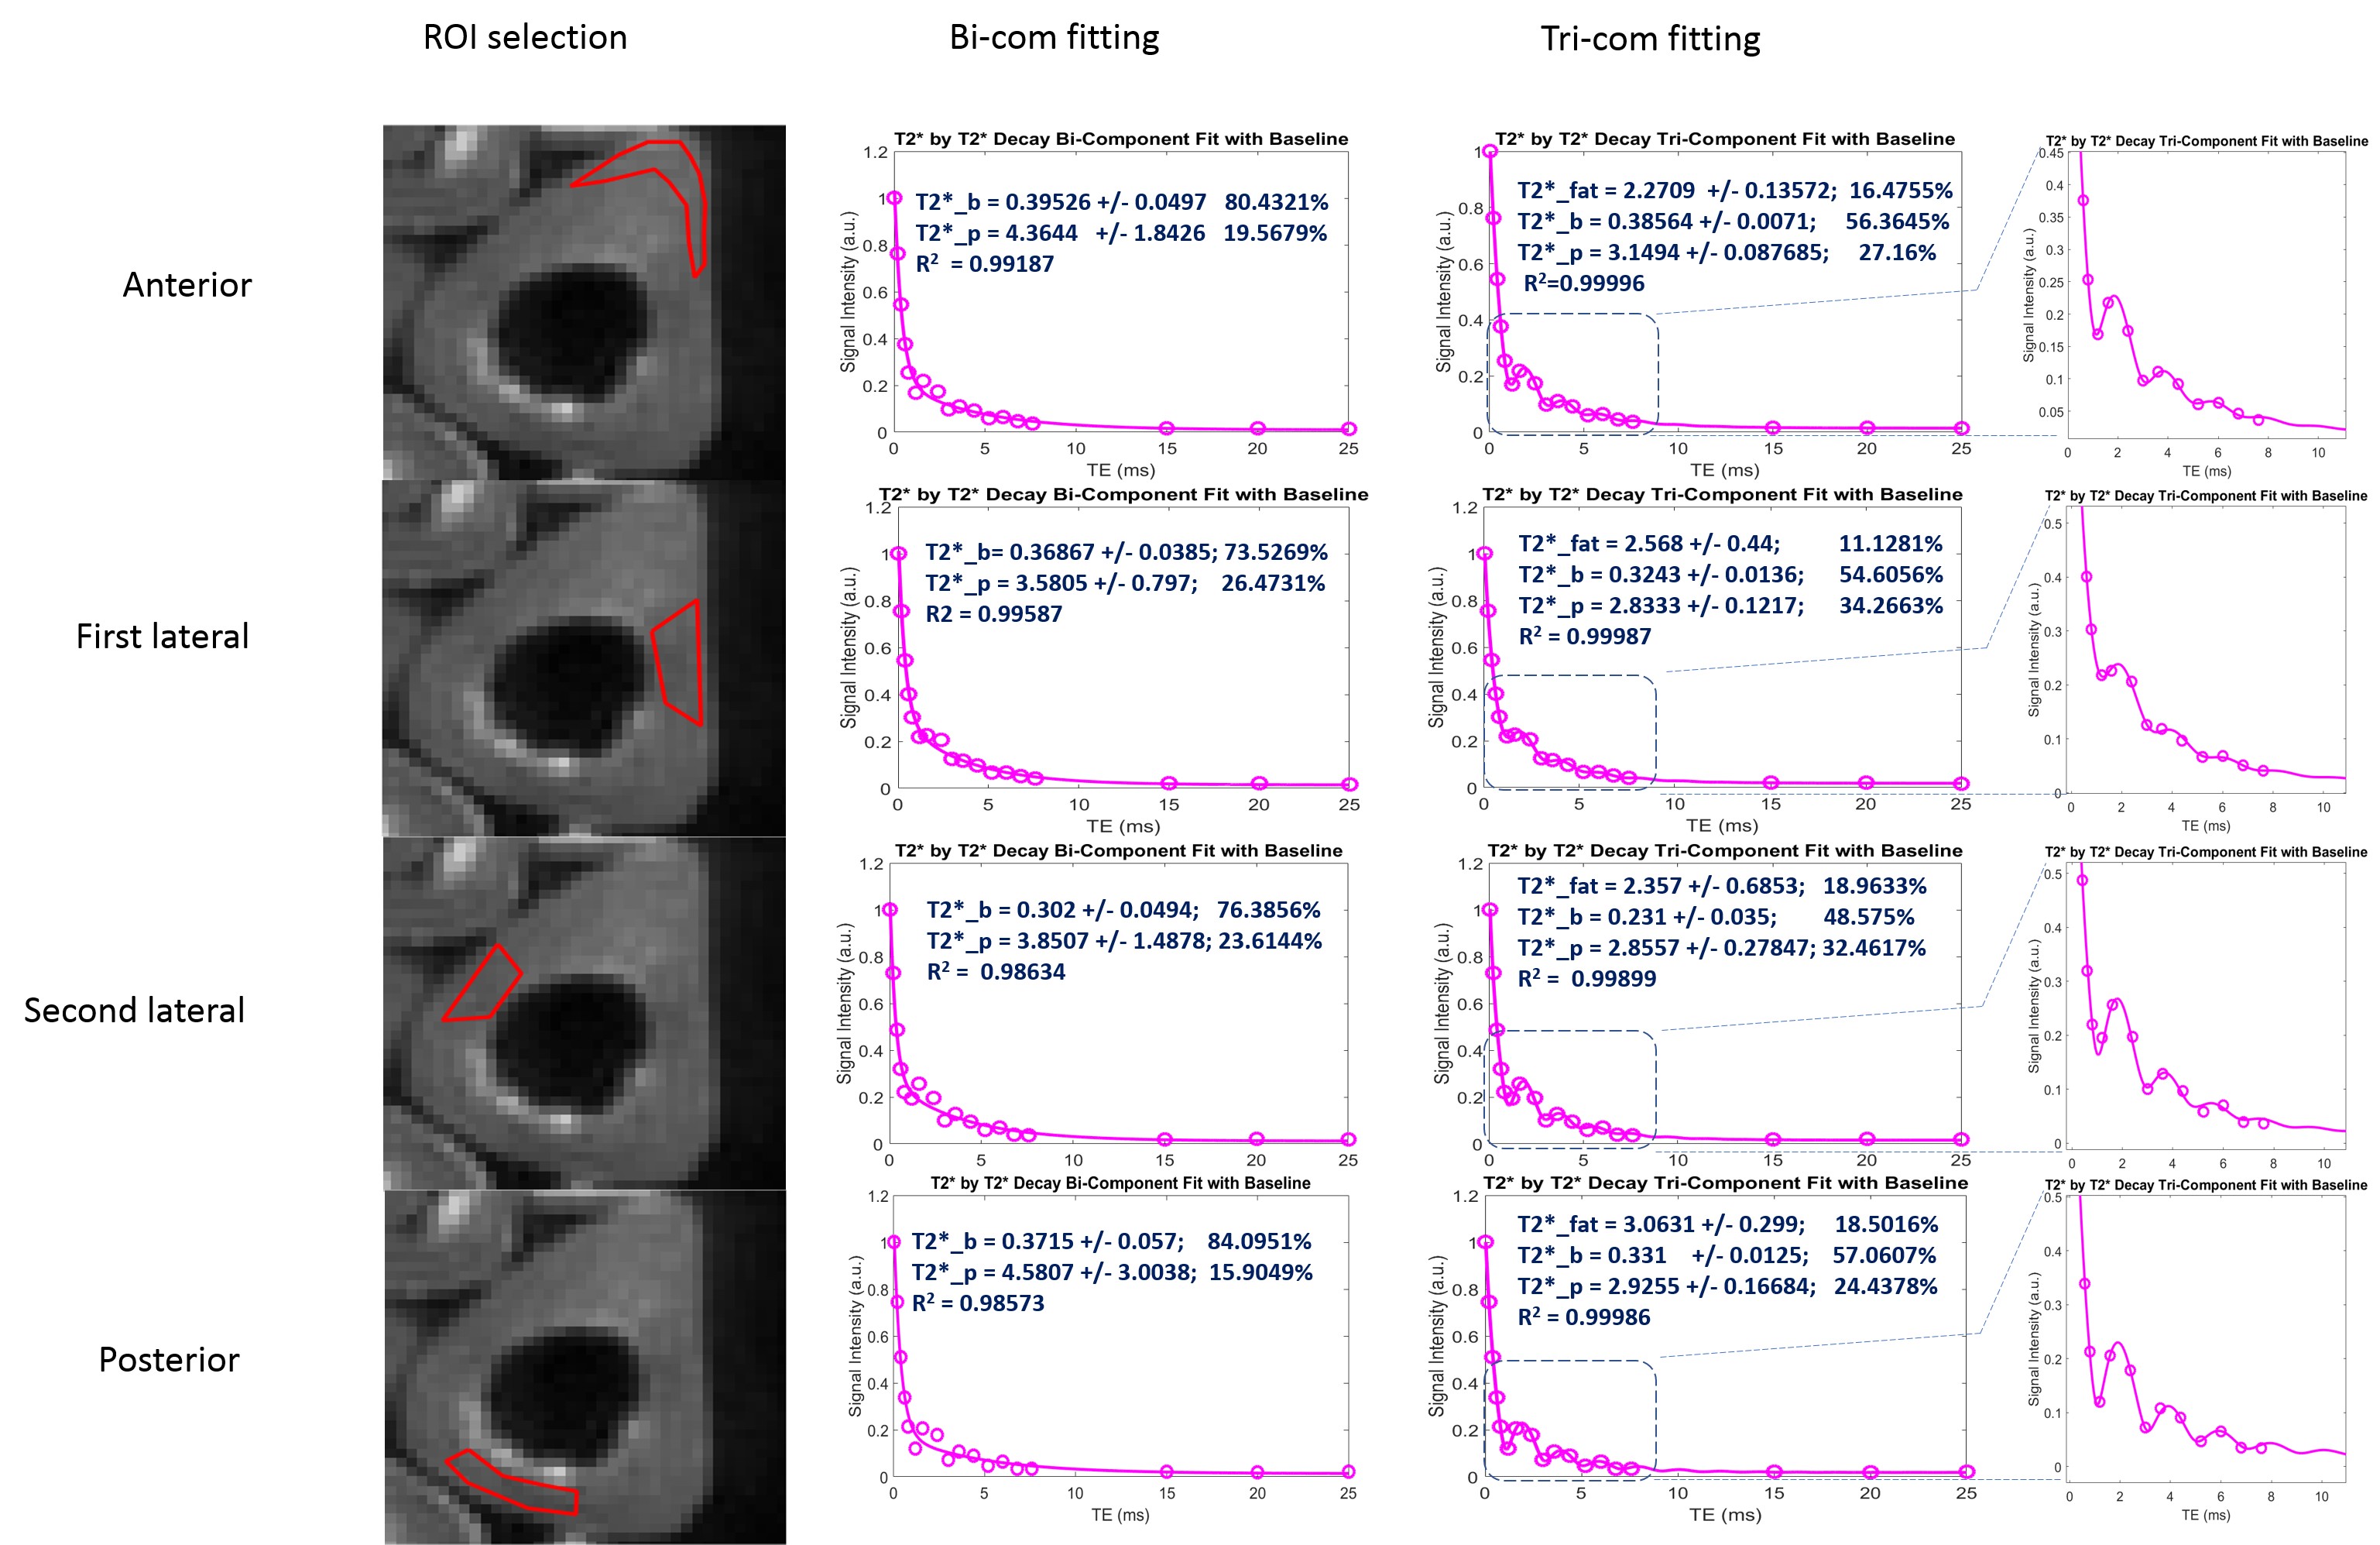
Regions of interest (ROIs) were drawn in four regions (anterior, posterior, medial and lateral) of each cortical bone sample for data analysis as shown in the left column of Figure 1. A semi-automated MATLAB (The Mathworks Inc., Natick, MA, USA) program was developed for bi- and tri-component T2* analysis using a least square fitting method according to the following two Equations, respectively, for each ROI:
\[S(TE)=\rho_{bw}\exp(-TE/T_{2bw}^*)+\rho_{pw}\exp(-TE/T_{2pw}^*)+base [1]\]
\[S(TE)=\rho_{bw}\exp(-TE/T_{2bw}^*)+\rho_{pw}\exp(-TE/T_{2pw}^*)+\rho_{f}\exp(-TE/T_{2f}^*)\sum_n\alpha_n\exp(-i2\pi f_nTE) +base [2]\]
Here, $$$\alpha_n$$$ is the relative amplitude of the nth spectral peak of fat, $$$f_n$$$ is the corresponding multi-spectral peak frequency shift5; $$$\rho_{bw}$$$ , $$$\rho_{pw}$$$ and $$$\rho_f$$$ are bound water, pore water and fat amplitude at time t = 0. ROI fitting results of each bone were averaged for further statistical analysis. BWF and PWF of both bi-com and tri-com fitting were calculated using Equation 3.
\[BWF=\rho_{bw}/(\rho_{bw}+\rho_{pw}); PWF=\rho_{pw}/(\rho_{bw}+\rho_{pw}) [3]\]
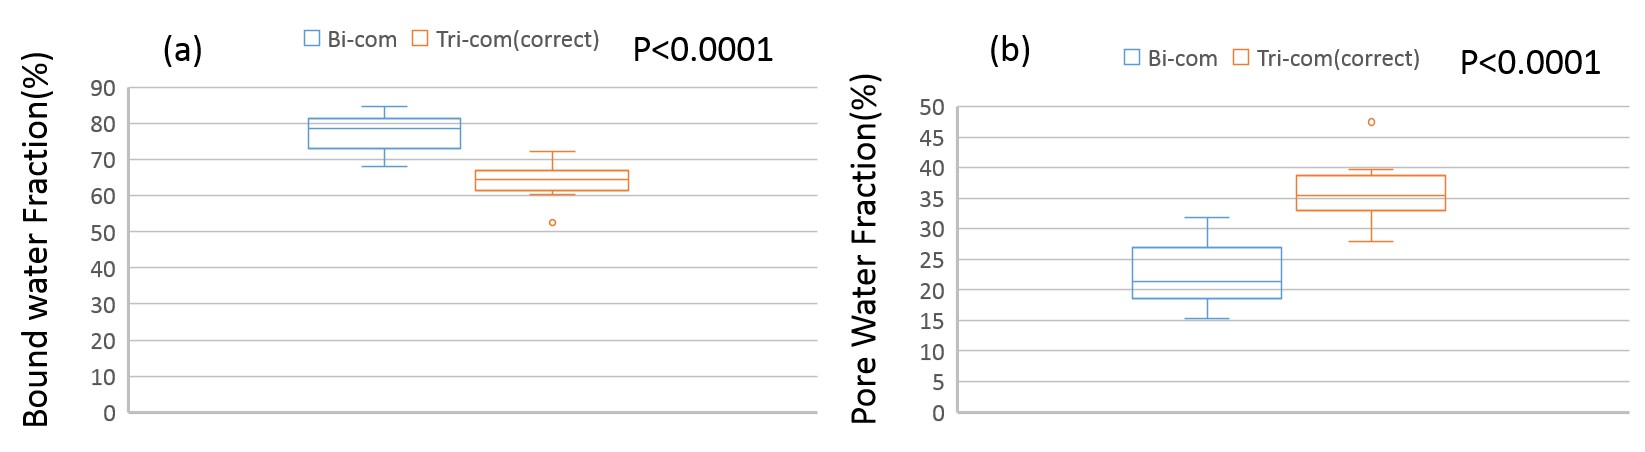
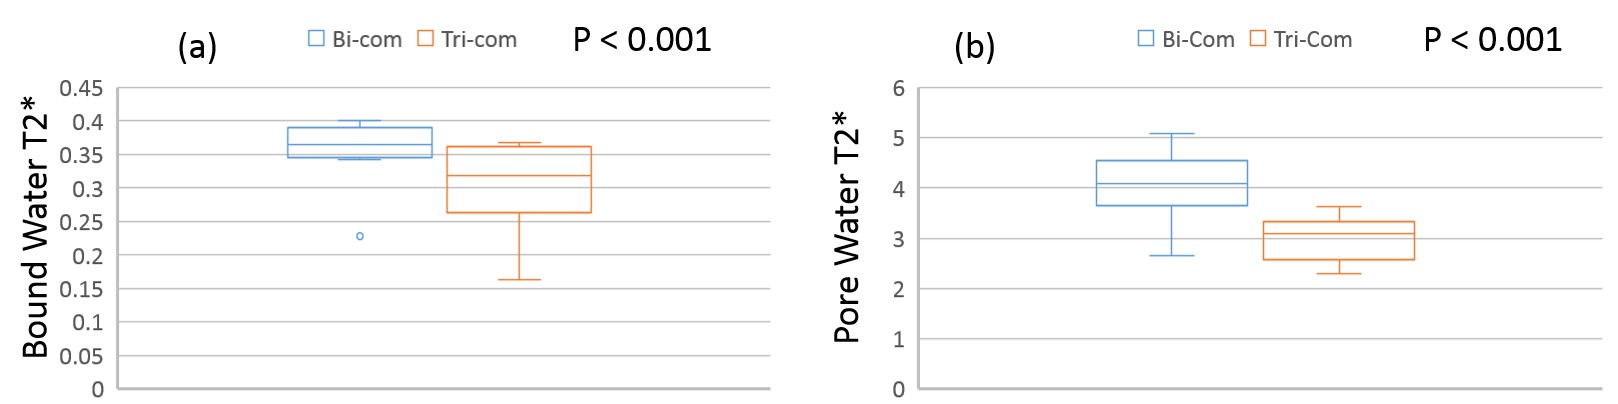
Paired t-tests were used to study the mean differences between bi- and tri-component fitting results of bound water fraction (BWF), pore water fraction (PWF), bound water T2* and pore water T2* using Excel (Microsoft Inc. Redmond, Washington, USA).
Results
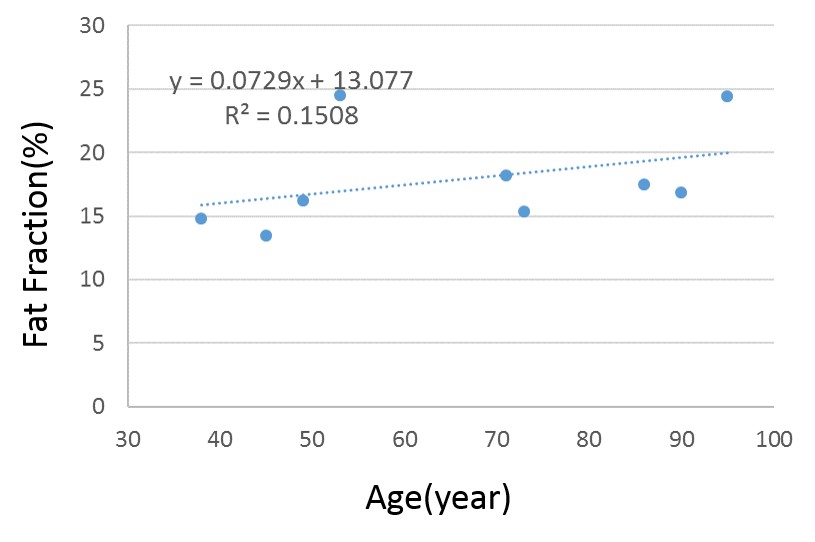
Figure 1 shows a sample ROI selection and bi- and tri-component fitting curves. Both bi-component fitting and tri-component fitting were analyzed using the same ROI. The tri-component curve demonstrated better fitting characteristics. As shown in Figure 2, with linear regression analysis of the 9 bone specimens, fat fraction demonstrated an increasing trend of 7.29% per year. In Figure 3, significant differences can be observed between both bound and pore water fractions between the bi- and tri-component analyses. Averaged BWF of tri-component fitting is 63.78±29.5%, which is less than that of the bi-component fitting of 77.52± 27.6 %, while averaged PWFs are 36.22± 29.5% and 22.48 ± 27.6%, respectively. Figure 4 shows that bound water T2* from the tri-component fitting is 0.304± 0.004423 ms, which is less than the bi-component fitting of 0.354±0.00264 ms. Pore water T2* from tri-component fitting is 2.997± 0.191ms, which is also less than the pore water T2* from bi-component fitting of 4.049± 0.504 ms.
Discussion and Conclusion
Based on a multi-peak fat chemical shift model, our results suggest improved curve fitting and additional information (e.g. fat fraction, which appears to increase with age) when a tri-component analyses is used in comparison to a bi-component analysis. Furthermore, significant differences between bi-component and tri-component analysis results are seen for all parameters, including bound and pore water fractions and T2*. However, the results still need to be further validated, including using larger sample numbers and techniques such as micro-computed tomography (CT) and histologic analyses.Acknowledgements
The authors acknowledge grant support from NIH (1R01 AR062581 and 1R01 AR068987), VA Clinical Science Research and Development Service (Merit Award I01CX001388, ), National Natural Science Foundation of China (NSFC 51607169) and GE Healthcare.
References
1. Zebaze R, Ghasem-Zadeh A, Bohte A, Iuliano-Burns S, Mackie E, Seeman E. Age-related bone loss: The effect of neglecting intracortical porosity. Bone. 2009; 44:S117–S118.10.1016/j.bone.2009.01.261
2. Seeman E, Delmas PD. Bone quality–the material and structural basis of bone strength and fragility. N Engl J Med. 2006; 354:2250–2261.10.1056
3. Borah B, Dufresne T, Nurre J, Phipps R, Chmielewski P, Wagner L, Lundy M, Bouxsein M, Zebaze R,Seeman E. Risedronate reduces intracortical porosity in women with osteoporosis. J Bone Miner Res. 2009; 25:41–47.10.1359
4. Du J, Diaz E, Carl M, Bae W, Chung CB, Bydder GM. Ultrashort echo time imaging with bicomponent analysis. Magn Reson Med 2012;67:645–649.
5. Hernando D, Liang ZP, Kellman P. Chemical shift-based water/fat separation: a comparison of signal models. Magn Reson Med 2010;64: 811–822.
Figures