5153
Inversion-Recovery sat-UTE sequence for short-T2 structures positive contrast generation and quantification1Université de Strasbourg, CNRS, ICube, FMTS, Strasbourg, France, 2NMR laboratory, Institute of Myology, Paris, France, 3NMR laboratory, CEA/DRF/IBFJ/MIRCen, Paris, France, 4Institut Mines Télécom Atlantique, INSERM, LaTIM, Brest, France
Synopsis
Short-T2 structures such as myelin and cortical bone often requires the use of inversion-recovery modules in UTE sequences to provide a selective contrast in the components of interest. The sat-UTE sequence allows for an effective slice selection, and avoid issues found in commonly used 2D IR-UTE sequences concerning the use of reshaped half-radiofrequency pulses to achieve a minimal echo time. In this work, we propose to make use of an Inversion-Recovery-prepared sat-UTE sequence to provide a short-T2 positive contrast and quantification in the white matter and in the cortical bone of a fixed mouse head.
Introduction
The saturation-based UTE (sat-UTE) sequence1 was initially proposed to provide a simple method for slice selection and minimal echo time achievements. It also allows to avoid issues encountered in other 2D-UTE sequences where reaching a minimal echo time requires the use of reshaped radiofrequency half-pulses2,3,4. Currently, the latter represents the mostly used 2D technique to explore solid like tissues such as cortical bone, tendon or myelin, and is often used in pair with inversion-recovery modules to either null the long-T2 signal5,6,7, or to select the short-T2 ones8. The purpose of this work is to present an adapted Inversion Recovery sat-UTE sequence (IR-sat-UTE) allowing for quantification and positive contrast generation of cortical bone and white matter short-T2 components.
Methods
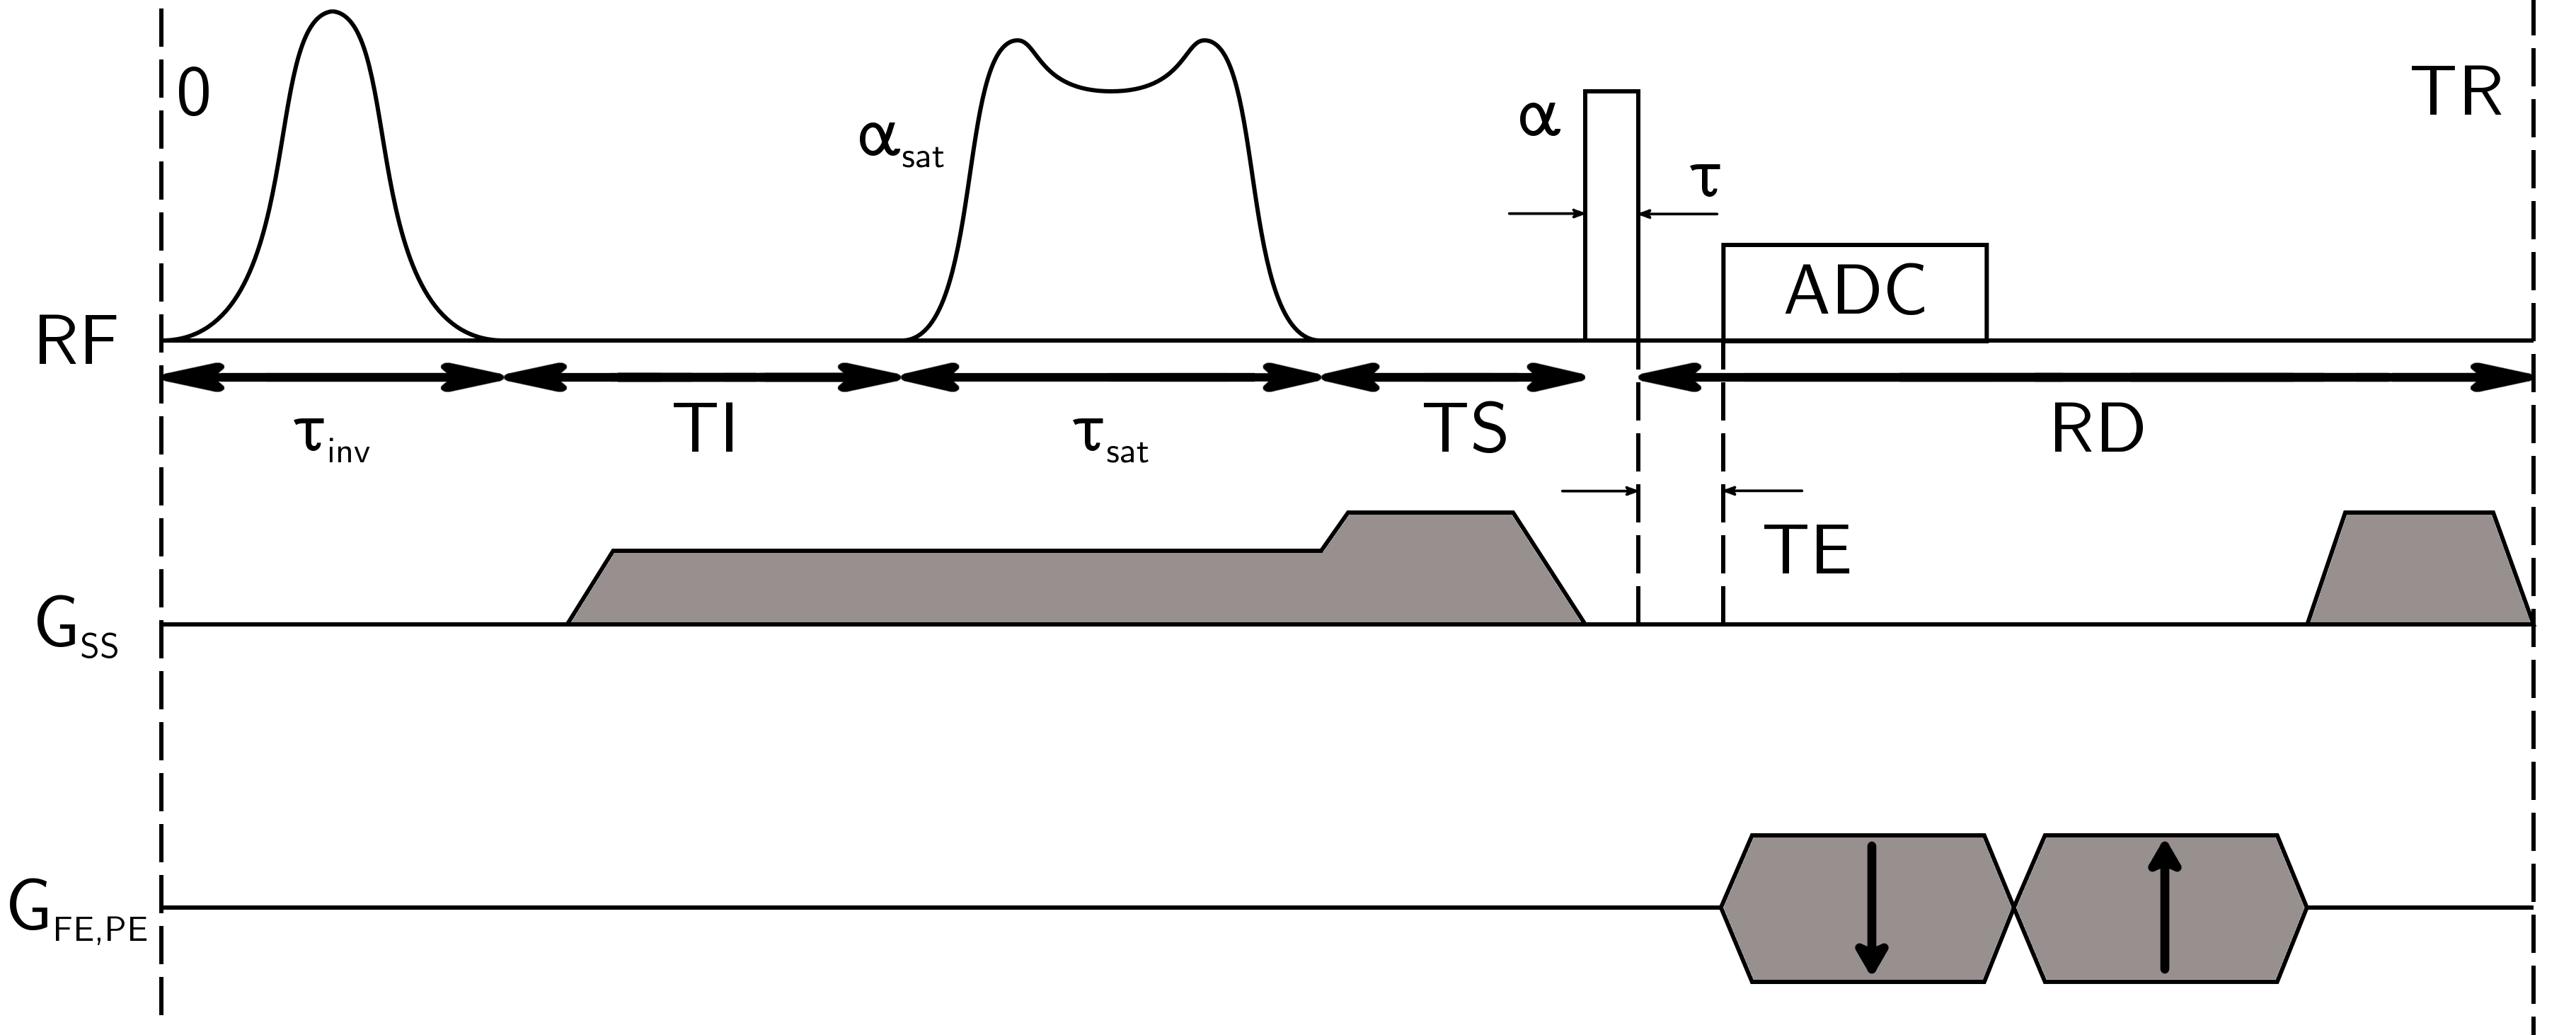
To provide a positive contrast in the short-T2 structure and to prevent from long-T2 signal contamination, an inversion-recovery module was set prior to the sat-UTE pattern (Figure 1). Assuming an ideal spoiling condition, the resulting long-T2 magnetization before the excitation pulse can be described using the Bloch equations by:
$$M^{\alpha_{sat}\neq0}_{z}=M_0\frac{1-E_S\times(1-\cos(\alpha_{sat})\times(1-E_I\times(1-\delta\times(1-E_r))))}{1-E_I
E_S E_r\delta\cos(\alpha)\cos(\alpha_{sat})},$$
$$M^{\alpha_{sat}=0}_{z}=M_0\frac{1-E_IE_{sat}E_S\times(1-\delta\times(1-E_r))}{1-E_IE_{sat}E_SE_r\delta\cos(\alpha)},$$
with $$$\delta$$$ the inversion efficiency ($$$\delta\in [-1;1]$$$), $$$\alpha_{sat}$$$ and $$$\alpha$$$ respectively the saturation and excitation flip angle,$$$\{E_I;E_{sat};E_S;E_r\}=\{e^{-TI/T_1};e^{-\tau_{sat}/T_1};e^{-TS/T_1};e^{-RD/T_1}\}$$$ with $$$TI$$$ the inversion delay, $$$TS$$$ resting delay between saturation and excitation pulse, $$$RD$$$ resting delay between the excitation and inversion pulses, and T1 longitudinal relaxation constant of the long-T2 component.
In order to cancel the long-T2 signal, we solve $$$M^{\alpha_{sat}\neq0}_{z}-M^{\alpha_{sat}=0}_{z}=0$$$ for $$$TI$$$, yielding:
$$TI=-T_1 \times\ln\left(\frac{-(A+B)}{(E_{sat}-\cos(\alpha_{sat}))(1-\delta)}\right),$$
with:
$$A=\cos(\alpha_{sat})+\delta E_r' E_{sat}-\delta E_r'\cos(\alpha_{sat})+\delta E_r' \cos(\alpha)\cos(\alpha_{sat}),$$
$$B=-\delta E_r' E_{sat}\cos (\alpha) + \delta E_r'E_SE_{sat} \cos(\alpha)-\delta E_r'E_SE_{sat}\cos (\alpha)\cos(\alpha_{sat})-1,$$
with $$$E_r'=E_r\times E_I=e^{-(TR-\tau_{inv}-\tau_{sat}-TS-\tau)/T_1}$$$.
Experiments were conducted on a 7T preclinical scanner (Bruker BioSpec, Ettlingen, Germany), using a 86-mm Tx volume coil and mouse head surface Rx coil. A fixed mouse head (T1/T2 = 893/52 ms estimated in a cortex region of interest using Saturation-Recovery Spin Echo and Multi-Spin Echo (MSE) 2D sequences, respectively) soaked into PFPE (Galden, Solvay) was scanned. A highly selective saturation pulse with a quadratic phase modulation was used9, with N = 1023, k = 1000, BW = 8 kHz, FTW = 0.1, fs = 1 MHz. With a nominal $$$B_{1,peak}$$$ of 20.18 μT, it achieves a 90° and a 97° tilting over short (T2 = 0.5 ms) and long (T2 = 100 ms) T2 components respectively. Relevant parameters were: TR = 500 ms, TS = 2.1 ms, $$$\alpha$$$ = 90°, a 5-kHz sech pulse for inversion with $$$\tau_{inv}$$$ = 15.52 ms, $$$\tau$$$ = 0.07 ms, optimal TI = 201 ms, matrix size = 128x128, slice thickness = 1 mm, number of trajectories = 804 with in-plane voxels size = 100x100 μm², and receiver bandwidth = 200 kHz (3 accumulations, Tacq/scan = 1h20min). For T2* quantification, the ten following echo times were used: 0.015, 0.050, 0.100, 0.150, 0.300, 0.400, 0.500, 1.000, 2.500 and 5.000 ms. Fitted experimental points were averaged signals from ROIs in the head skull and in the corpus callosum.
A home-made $$$T_2^*$$$ fitting routine using the Levenberg-Marquart algorithm was implemented in Matlab (The MathWorks Inc. Natick, MA, USA). For white matter, the model accounts for on-resonant signal from solid-like structures, chemically shifted signal from phospholipids and residual water signal, as proposed in Ref. 10:
$$S(TE)=\left|\rho_1 e^{-TE/T_{2,1}^*}+\rho_2 e^{-TE/T_{2,2}^*+2\pi i\Delta f TE} +\rho_3e^{-TE/T_{2,3}^*}\right|,$$
with $$$\sum_i \rho_i = 1$$$.
A bi-component model accounting for bound and pore water in the cortical bone was used8:
$$S(TE)=\rho_1e^{-TE/T_{2,1}^*}+\rho_2 e^{-TE/T_{2,2}^*},$$
with $$$\rho_1+\rho_2=1$$$.
Results
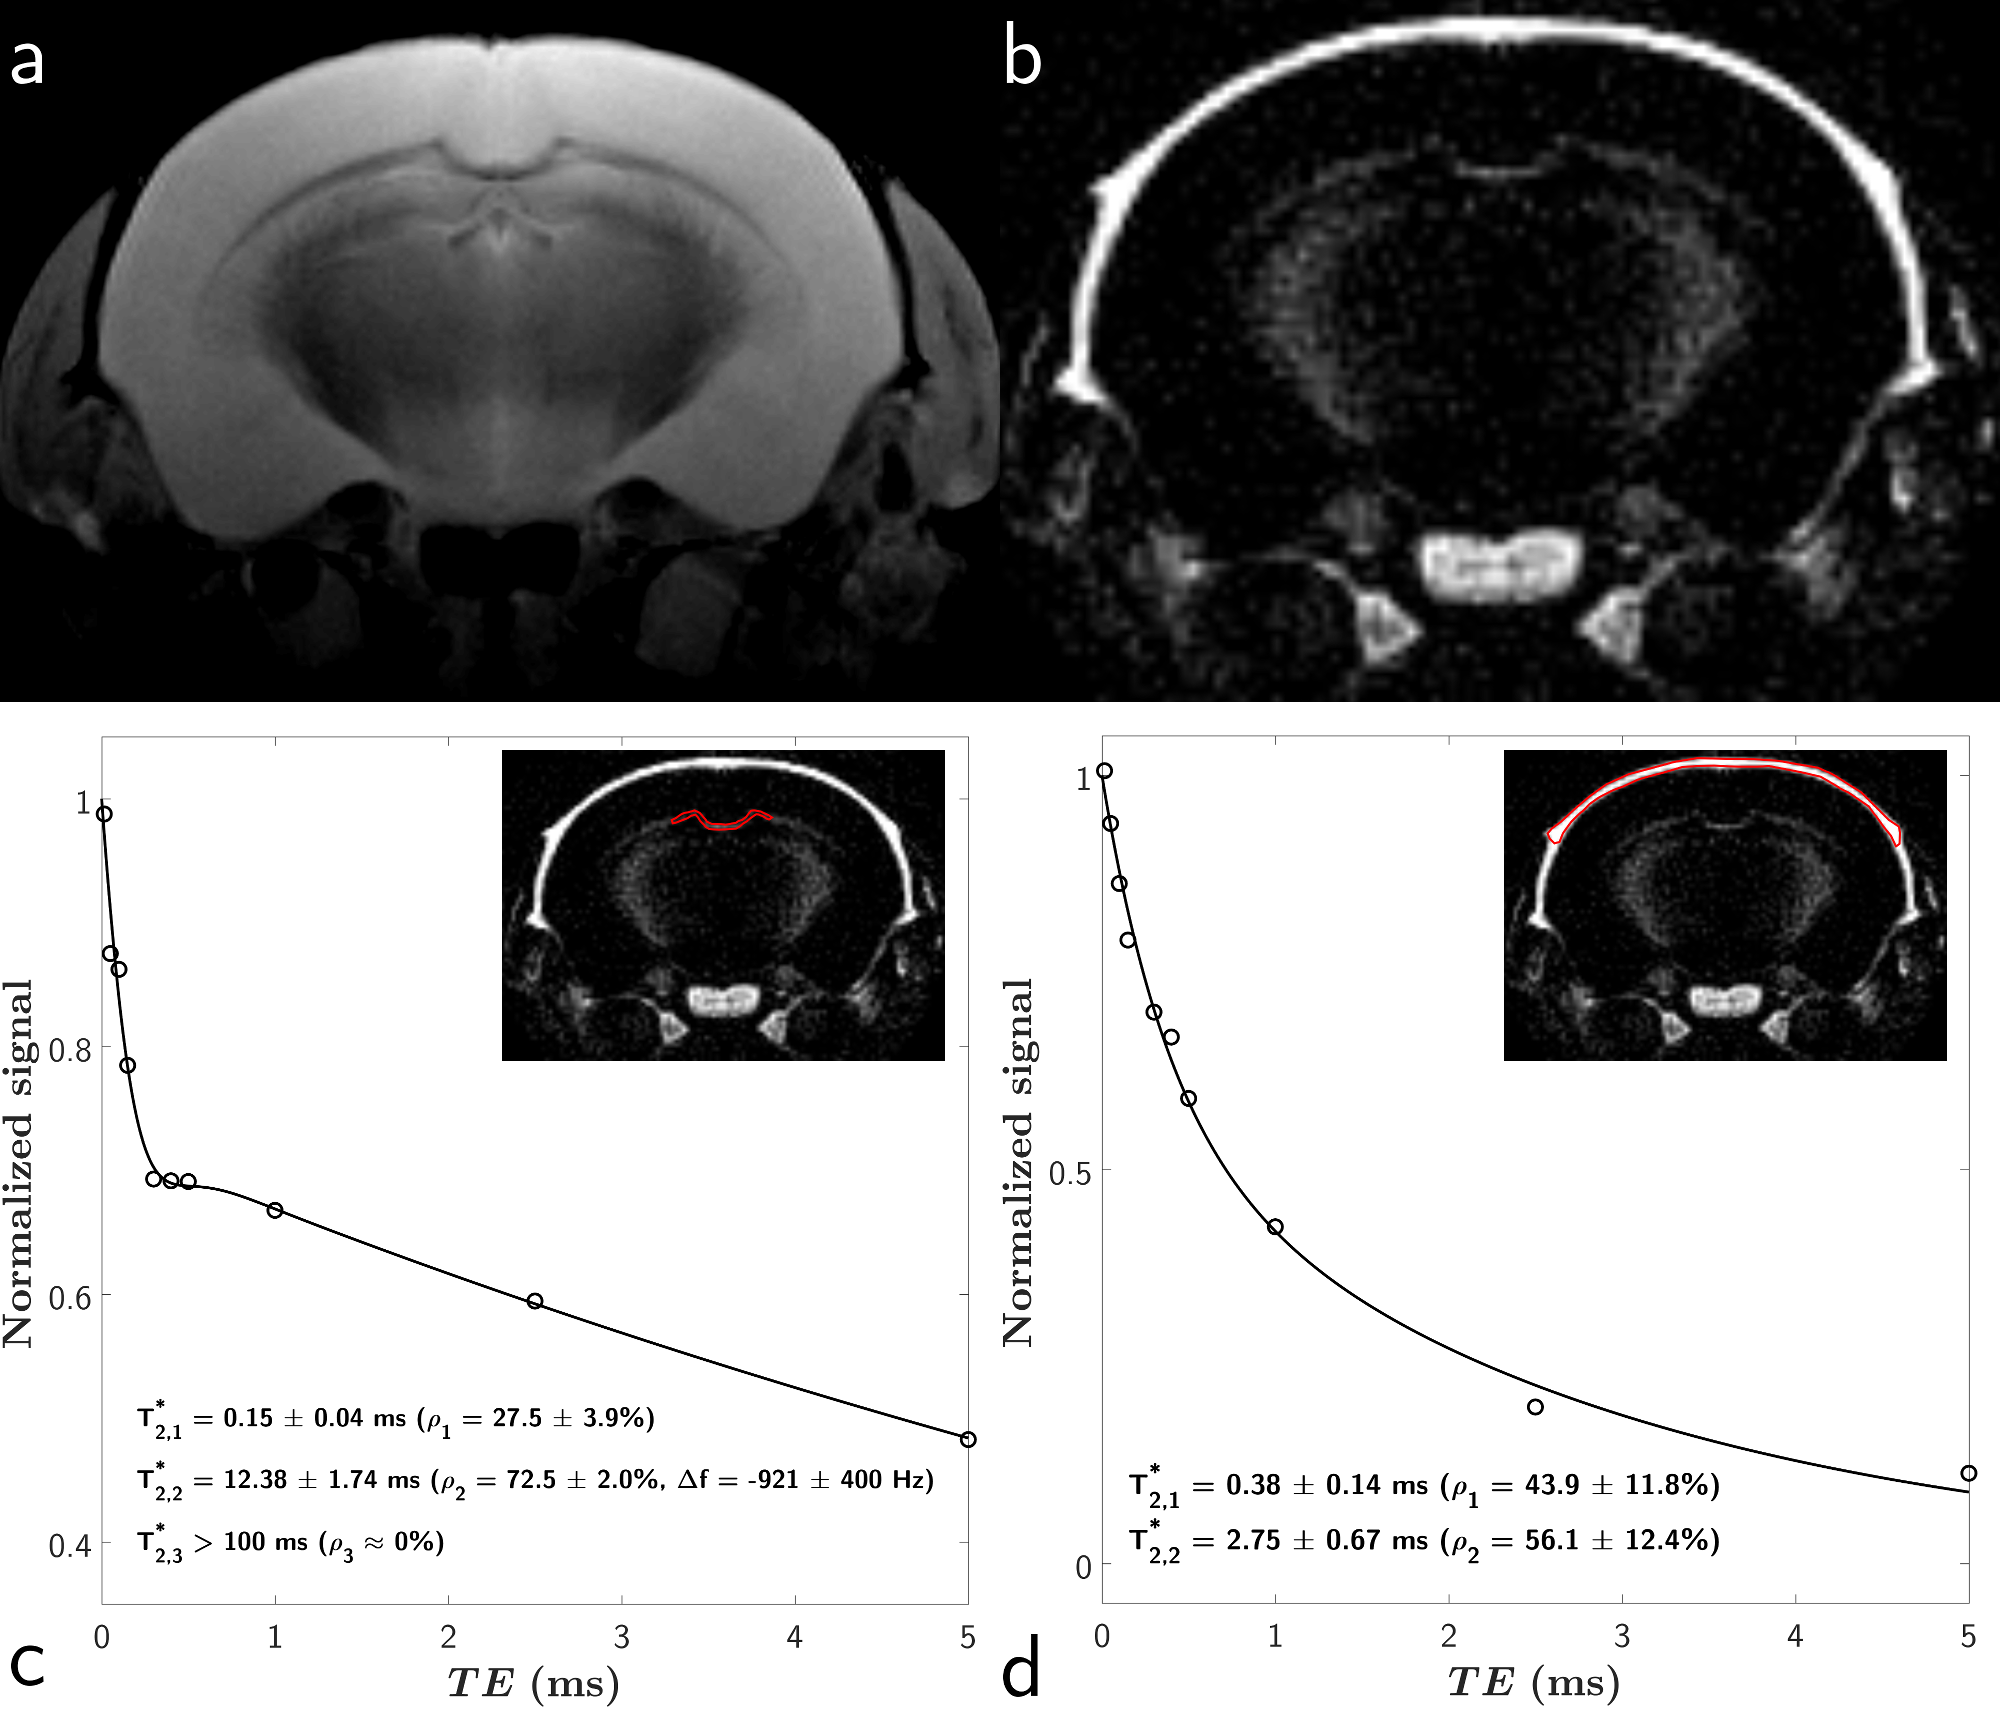
Results as well as fittings of the white matter and cortical bone signals are shown in Figure 2.
Data from cortical bone were accurately described by the bi-exponential model ($$$R^2_{adj}$$$ = 0.99), with respective T2s of 0.38±0.14 ms ($$$\rho_1$$$ = 43.9±11.8%) and 2.75±0.67 ms ($$$\rho_2$$$ = 56.1±12.4%).
A chemically shifted species can be estimated in the white matter, with a $$$\Delta f$$$ = -921±400 Hz and a T2 of 12.38±1.74 ms ($$$\rho_2$$$ = 72.5±2.0%), along with an on-resonance ultra-short-T2 component ($$$\rho_1$$$ = 27.5±3.9%) with a T2 of 0.15±0.04 ms ($$$R^2_{adj}$$$ = 0.98). Interestingly, no long-T2 component ($$$T_{2,3}^* > 100$$$ ms) could be estimated ($$$\rho_3$$$ ≈ 0%).
Discussion and conclusion
We have shown the IR-sat-UTE capacities to generate a positive contrast in mixed long and short-T2 tissues. Estimators differences from litterature10,11 might be the result of the mouse brain fixation at room temperature, or even a bias induced by the relatively large slice thickness in our experiments potentially suffering from partial volume effects. The results encourage for further analysis of solid-like tissues using the proposed sequence, and still remains less complex to implement on scanners than reshaped half-RF pulses techniques.Acknowledgements
The authors thank Dr. Cristina Antal for providing the fixed mouse head used in experiments.References
1. Harkins KD, Horch RA, Does MD. Simple and robust saturation-based slice selection for ultrashort echo time MRI. Magnetic Resonance in Medicine 2015;73:2204–2211.
2. Conolly S, Nishimura D, Macovski A, Glover G. Variable-rate selective excitation. Journal of Magnetic Resonance (1969) 1988;78:440–458.
3. Pauly J, Conolly SM. Slice-selective excitation for very short T2 species. in Proceedings of the 8th Annual Meeting of SMRM, Amsterdam, The Netherlands, 1989. p. 28.
4. Brittain J, Shankaranarayanan A. Ultra-Short TE Imaging with Single-Digit (8us) TE. Proceedings of the 11th Annual Meeting of ISMRM 2004;244:629.
5. Du J, Bydder M, Takahashi AM, Carl M, Chung CB, Bydder GM. Short T2 contrast with three-dimensional ultrashort echo time imaging. Magnetic Resonance Imaging 2011;29:470–482.
6. Rad HS, Lam SCB, Magland JF, Ong H, Li C, Song HK, Love J, Wehrli FW. Quantifying cortical bone water in vivo by three-dimensional ultra-short echo-time MRI. NMR in Biomedicine 2011;24:855–864.
7. Du J, Sheth V, He Q, Carl M, Chen J, CoreyBloom J, Bydder GM. Measurement of T1 of the Ultrashort T2* Components in White Matter of the Brain at 3T. PLoS ONE 2014;9:e103296.
8. Horch RA, Gochberg DF, Nyman JS, Does MD. Clinically compatible MRI strategies for discriminating bound and pore water in cortical bone. Magnetic Resonance in Medicine 2012;68:1774–1784.
9. Balchandani P, Pauly J, Spielman D. Designing adiabatic radio frequency pulses using the Shinnar-Le Roux algorithm. Magnetic Resonance in Medicine 2010;64:843–851.
10. Boucneau T, Tang S, Han M, Henry RG, Xu D, Larson PE. In Vivo Characterization of Brain Ultrashort-T2 Components. in Proceedings of the 24th Annual Meeting of ISMRM, Singapore, Singapore, 2016. p. 330.
11. Seifert AC, Wehrli SL, Wehrli FW. Bi-component T2* analysis of bound and pore bone water fractions fails at high field strengths. NMR in Biomedicine 2015;pp.861–872.
Figures