5151
A New Contrast Mechanism for Parametric Segmentation of MRI Using Alternating RF Pulses in bSSFP Sequence1Korea Advanced Institute of Science and Technology, Daejeon, Republic of Korea, 2Samsung Electronics, Suwon, Republic of Korea
Synopsis
Magnetic resonance imaging (MRI) technology offers the most important diagnostic information for musculoskeletal (MSK) disorders, in comparison to other imaging modalities (1). However, human MSK system contains a lot of fat, by which the important tissue signals from the cartilage and the synovial fluid are obstructed. Even with fat suppression techniques, it is still difficult to distinguish tissues having similar proton density (PD), T1, and T2 values. In this abstract, a new contrast enhancing method for the color MR image based on parametric segmentation is introduced, using the modified bSSFP pulse sequence.
Introduction
Magnetic resonance imaging (MRI) technology offers the most important diagnostic information for musculoskeletal (MSK) disorders, in comparison to other imaging modalities (1). However, human MSK system contains a lot of fat, by which the important tissue signals from the cartilage and the synovial fluid are obstructed. Even with fat suppression techniques, it is still difficult to distinguish tissues having similar proton density (PD), T1, and T2 values. In this abstract, a new contrast enhancing method for the color MR image based on parametric segmentation is introduced, using the modified bSSFP pulse sequence.Methods
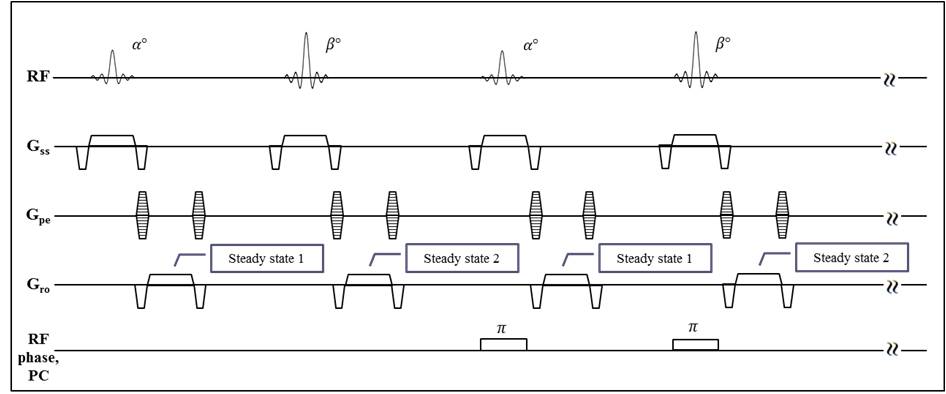
The bSSFP pulse sequence offers a good signal-to-noise ratio (SNR) with a short TR, so that imaging time can be substantially reduced. Thus, it is steadily applied to knee MR imaging (2, 3). The acquired signal from bSSFP pulse sequence is a combination of free-induction-decay (FID) signal and echo signal. In the proposed method, by using the alternating RF flip angles, the amount of the FID signal and the echo signal at each TR period are manipulated to make different weightings of T1, T2, and PD, as shown in Fig. 1. Since the proposed method is based on the bSSFP sequence, the banding artifacts are inherent problems. Thus, a phase-cycling (PC) method is used to reduce the banding artifacts. The proposed method offers two contrast images of Iα and Iβ acquired just after two alternating RF pulses, respectively. Then, Iα and Iβ have different weightings of T1, T2, and PD. In addition, water and fat components of Iα and Iβ can have different phases with respect to TR, since there is a resonance frequency shift of 3.5 ppm between water and fat components. Then, the complex weighted sum of Iα and Iβ can make various contrast images including fat-suppressed contrast, as follows,
$$\ I_{MC}(c,\theta,\alpha,\beta)=\mid c\times I_{\alpha}+(1-c)\times e^{j\theta}\times I_{\beta}\mid,\tag1\ $$
where IMC(c, θ, α, β) is the (c, θ)-weighted contrast image, and c and θ are a weighting factor of 0 ≤ c ≤ 1 and a phase shift term of 0 ≤ θ ≤ π, respectively. The optimized values of (c, θ) for maximum contrast of A and B are determined by maximizing the relative contrast (RC), as follows,
$$\ RC_{A/B}=\frac{S_{A}-S_{B}}{S_{A}},\tag2\ $$
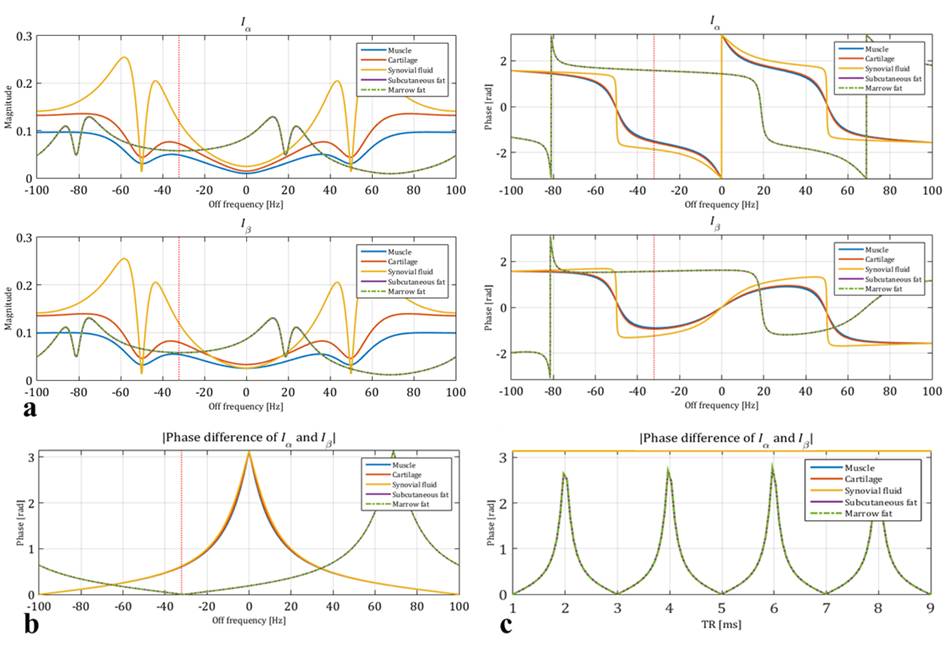
where SA and SB are the signal intensities of A and B, respectively. Simulations were performed to analyze the signal intensities of the cartilage, muscle, synovial fluid, subcutaneous fat, and bone marrow. The PD, T1, and T2 values of the composed materials were determined by the references (3-6). The simulation parameters were determined as follows: TR/TE = 5.0/2.5 ms, flip angles = 7˚ and 10˚. In-vivo experiments were also performed using a 3 T MRI scanner to validate the proposed method. Imaging parameters were given as field of view (FOV) = 165×165 mm2, matrix size = 384×384, TR/TE = 5/2.5 ms, and number of averages = 4. For comparison, fast spin-echo (FSE) proton-density images with/without fat suppression were acquired with TR/TE = 3200/37 ms.
Results
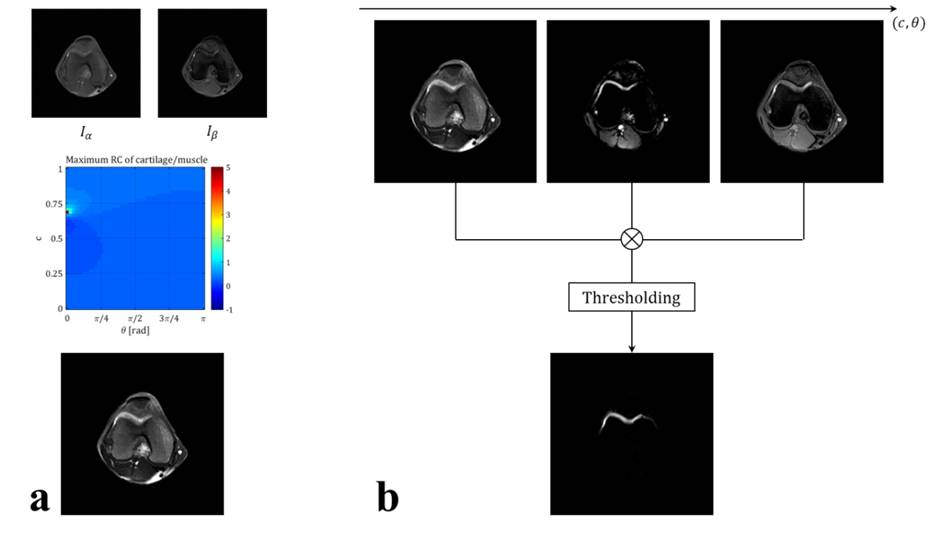
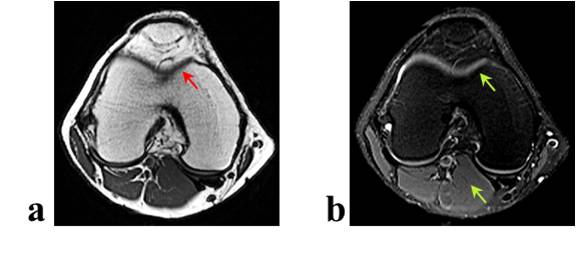
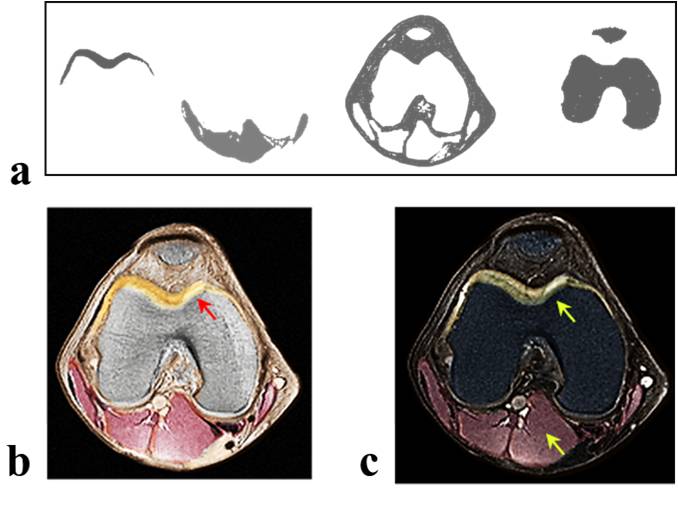
The simulated signals from the proposed bSSFP sequence is shown in Fig. 2. Figure 3(a) shows the relative contrast map between cartilage and muscle with respect to (c, θ). With the decided value of (c, θ) = (0.74, 0.01), the maximum contrast is obtained between cartilage and muscle as shown in Fig. 3(a). Figure 3(b) shows example images from maximizing the relative contrast between two different tissues, such as cartilage over muscle, cartilage over fat, and cartilage over bone marrow only. Then, cartilage-segment image can be obtained by thresholding a combined image of the three maximum RC images in Fig. 3(b). Figure 4 shows in-vivo results from the conventional FSE sequence. Cartilage is not bright in the conventional FSE image without fat suppression, as shown in Fig. 4(a). Although cartilage is bright in fat suppression case, muscle and cartilage have similar signal intensity due to similar PD, T1, and T2 values, as shown in Fig. 4(b). However, by using segmentation based on the results of Fig. 3, each tissue of the knee can be enhanced and represented by different color. Figure 5(a) shows the proposed parametric segmentation results with color information overlaid on the images acquired by the proposed bSSFP sequence. Then, cartilage region is shown obviously with fat signals, as shown in Fig. 5(b). In addition, cartilage and muscle have different color when fat signal is suppressed, as shown in Fig. 5(c).Conclusions
As demonstrated by the simulations and the in-vivo experiments, the proposed method offers the multi-contrast knee images, and feasibility of color MRI. Thus, it will be a useful tool for diagnosis, such as the cartilage segmentation, visualization of anatomic atlas, and fast screening for lesions.Acknowledgements
No acknowledgement found.References
1. Radiographics 2011;31:37-62.
2. Magn Reson Med 2003;49:700-709.
3. J Magn Reson Imaging 2007;25:270-278.
4. Proc Intl Soc Mag Reson Med 13 2005;1997.
5. Am J Roentgeno 2004;183: 343-351.
6. Magn Reson Med 2005; 54:507-512.
Figures