5150
Comparison of DESS and conventional clinical sequences for imaging the lumbosacral plexus1Stanford University, Stanford, CA, United States
Synopsis
Peripheral nerve imaging with MRI has gained increasing attention for non-invasive detection of nerve diseases. Unfortunately, the current performance of clinical sequences (T2-weighted fast spine echo with fat saturation and other supporting sequences) in spatial resolution, fat-saturation, and nerve-vessel distinction is often insufficient to make a convincing diagnosis. We conducted a radiologic review of lumbosacral plexus images from 3D double-echo in steady state (DESS) in comparison with images from conventional sequences in our current clinical protocol. Our results demonstrate the improved nerve visualization with the DESS sequence with comparable sensitivity to pathology.
Introduction
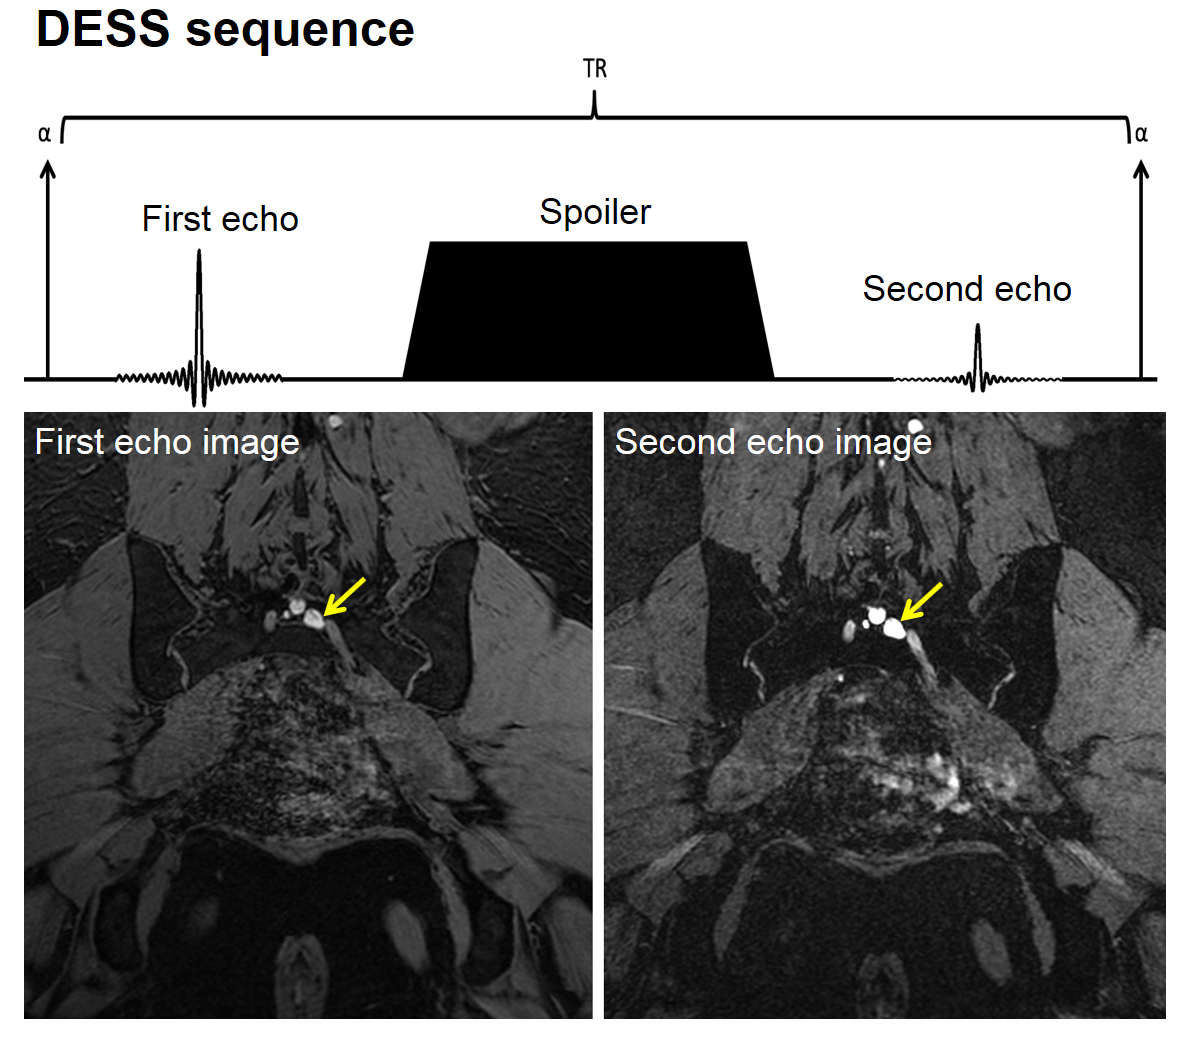
MRI of peripheral nerves, occasionally referred to as magnetic resonance neurography1, has been increasingly used for the last few decades as a non-invasive tool to identify pathologic conditions of nerves. Many novel pulse sequences have been adopted2-5, but the determination of pathology still largely depends on findings from the 2D T2-weighted fast spin echo (FSE) fat-saturated (FS) sequences. Unfortunately, the diagnosis with conventional sequences often becomes quite challenging due to their limitation in spatial resolution, fat-saturation, and distinction between nerves and vessels. The 3D double-echo in steady-state (DESS) sequence with water-selective excitation (Figure 1) has recently shown promising improvements in evaluation of musculoskeletal tissues6, whose MR properties are similar to those of peripheral nerves. Here, we conducted a radiologic comparison of DESS and a set of conventional clinical sequences in imaging lumbosacral plexus (LS-plexus). Our results demonstrate the potential of the DESS sequence for improved visualization of peripheral nerves with comparable sensitivity to pathology.Methods
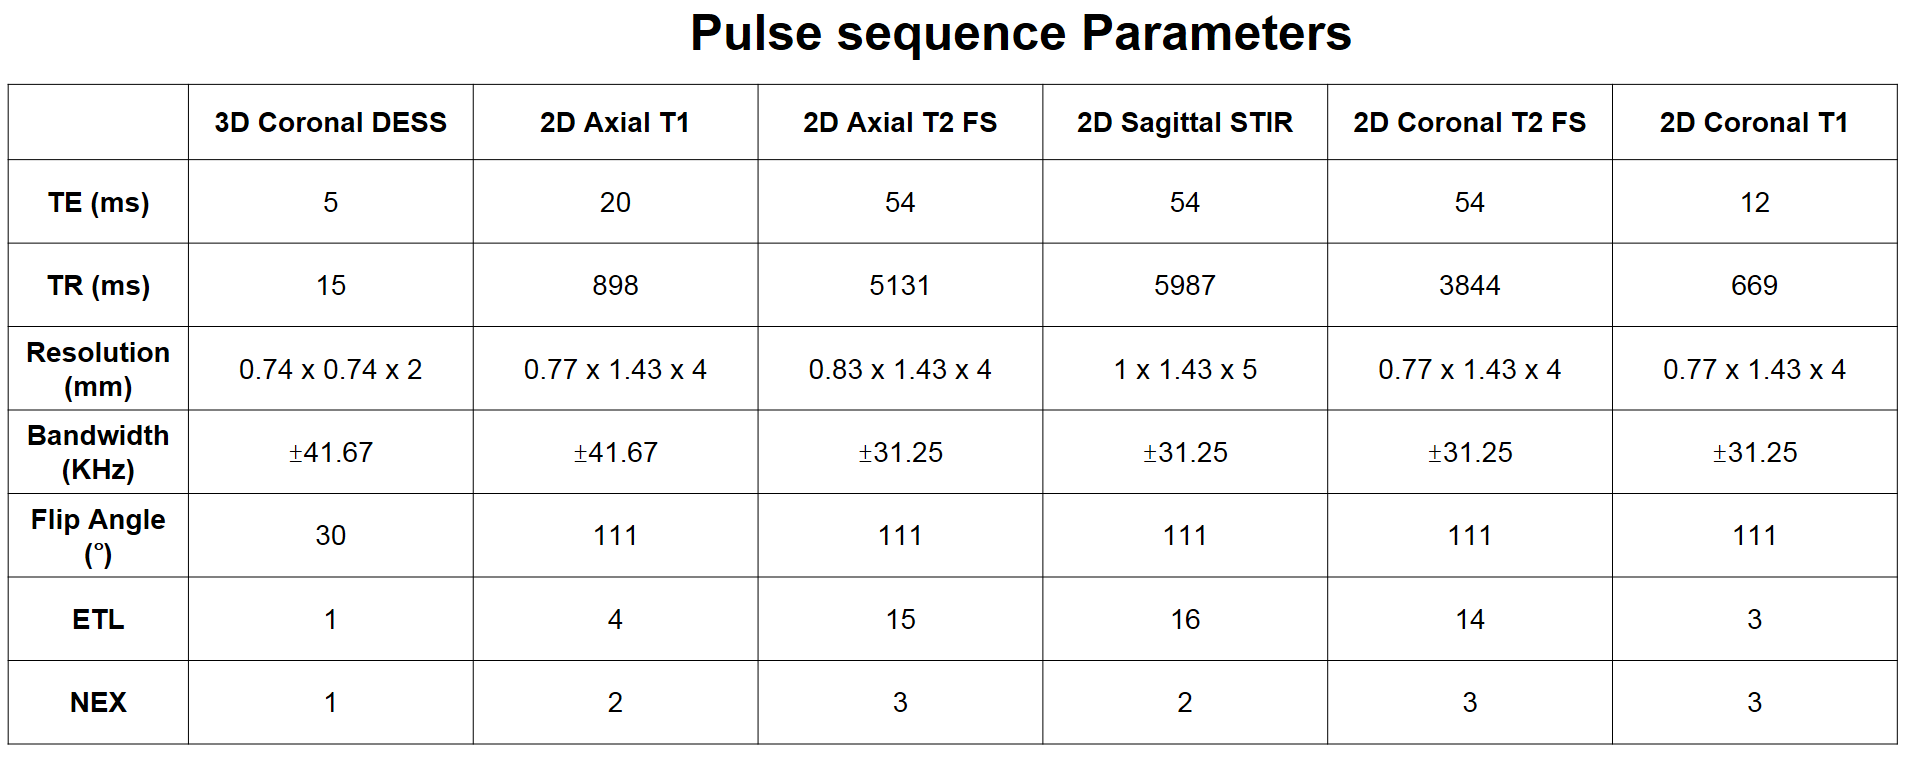
Our comparison study included 4 categories for evaluating nerve visualization, and 1 category for evaluating the pathology detection. The nerve visualization categories consist of sciatic nerve visibility, femoral nerve visibility, LS-plexus visibility, and nerve-vessel distinction. The pathology detection category is to assess the prediction about the side of the patient’s symptom (left or right) based on the image findings only. Two experienced musculoskeletal radiologists scored the images in each category by assigning 2 points for excellent, diagnostic quality, 1 point for moderate, diagnostic quality, and 0 point for poor, non-diagnostic quality. The LS-plexus imaging cases of 20 patients with a unilateral symptom on the lower-back, buttocks, or legs were included in our study. Each patient signed an informed consent form approved by the institutional review board for participation. All scans were performed on 3T GE MRI scanners. In recording the scores of conventional sequence images, each sequence image was scored, and the best score was chosen. This was to compare the performance of DESS with the best performance of the conventional sequences. Mann-Whitney U-test was employed to test the statistical significance in differences between scores. The set of compared sequences and their parameters are summarized in Table 1.Results
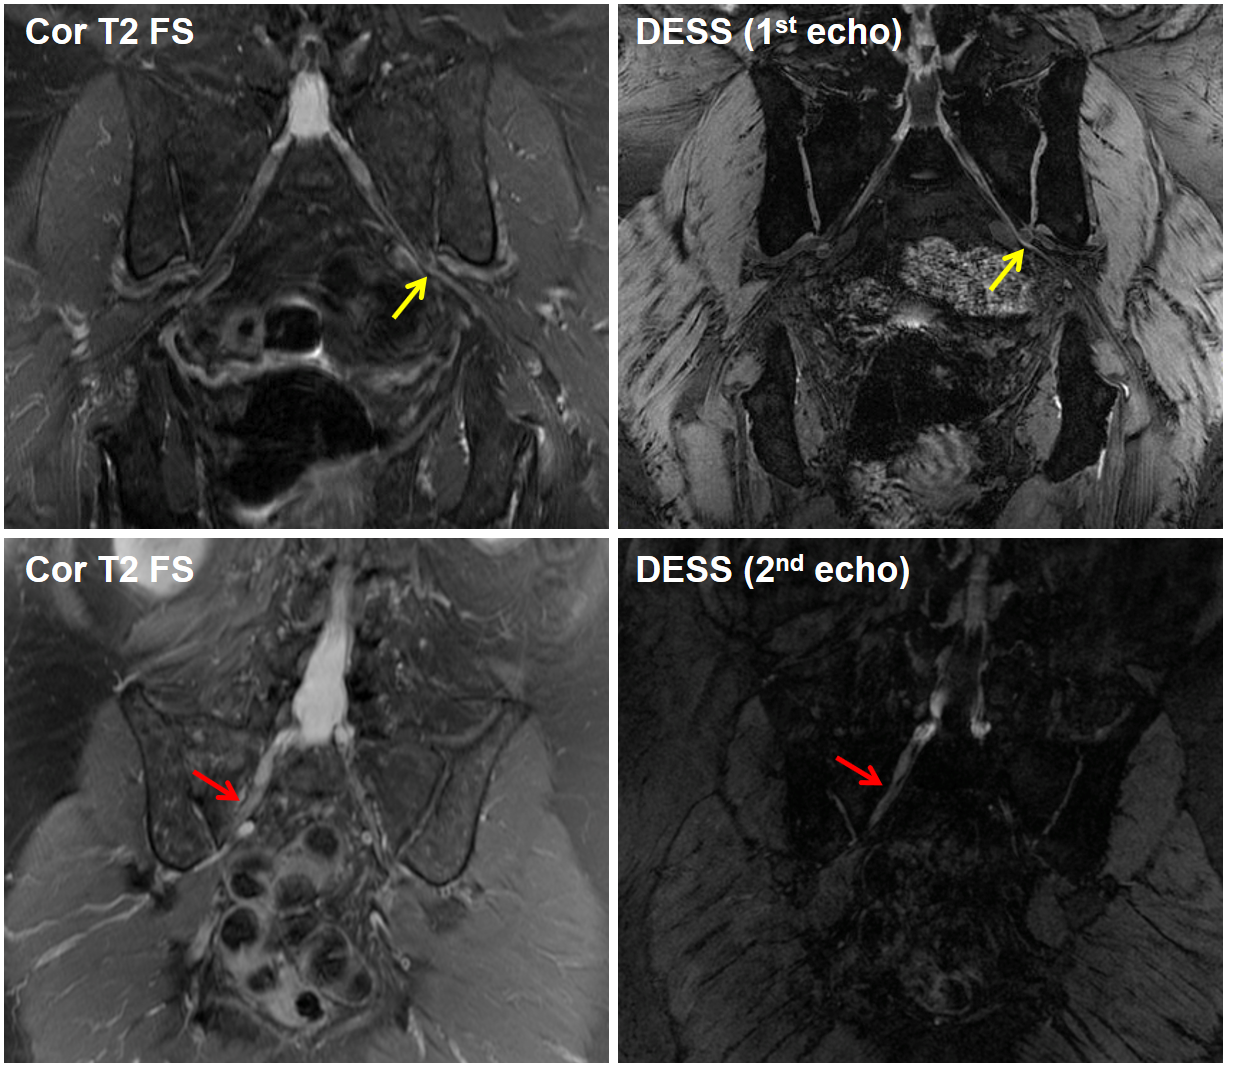
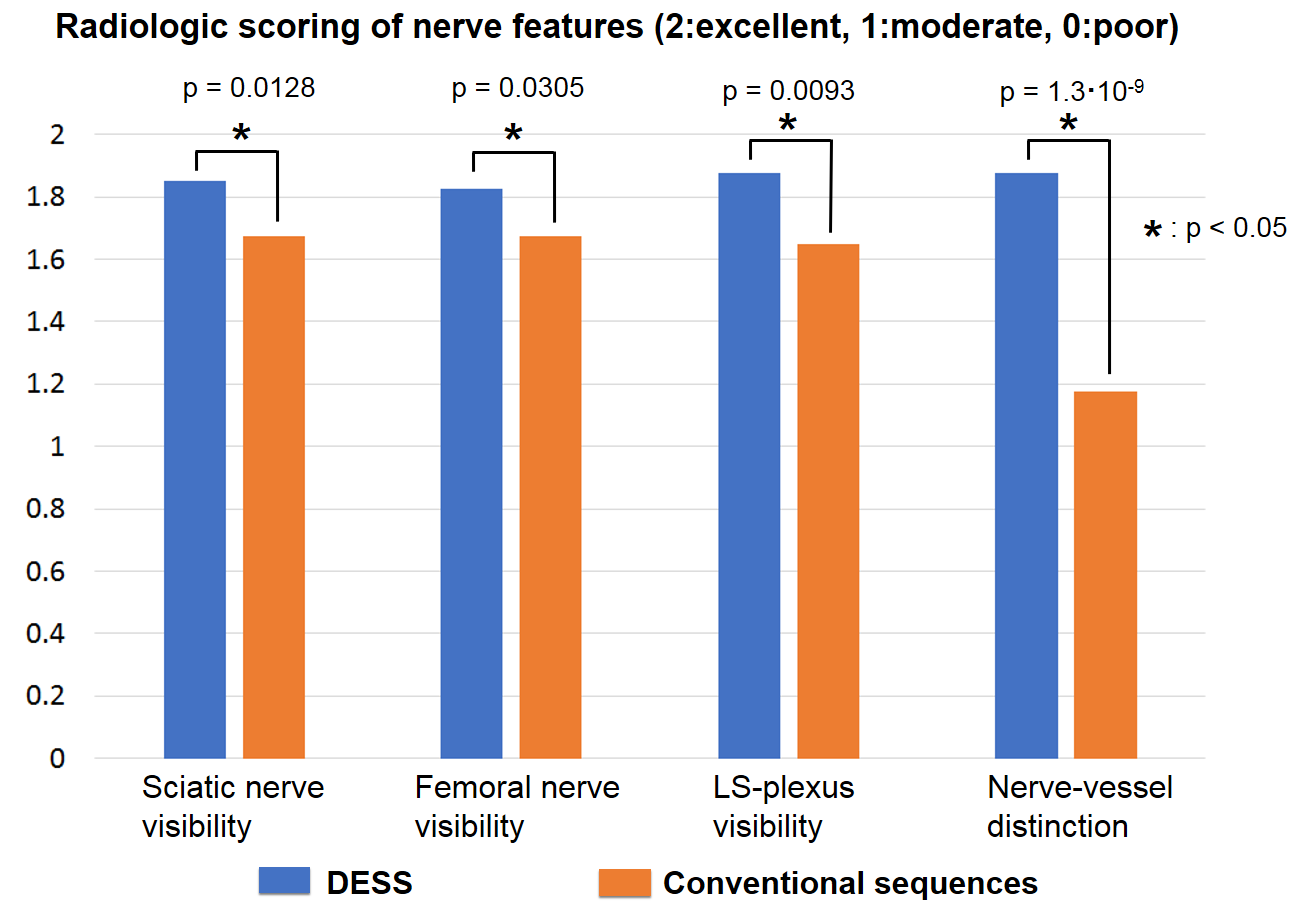
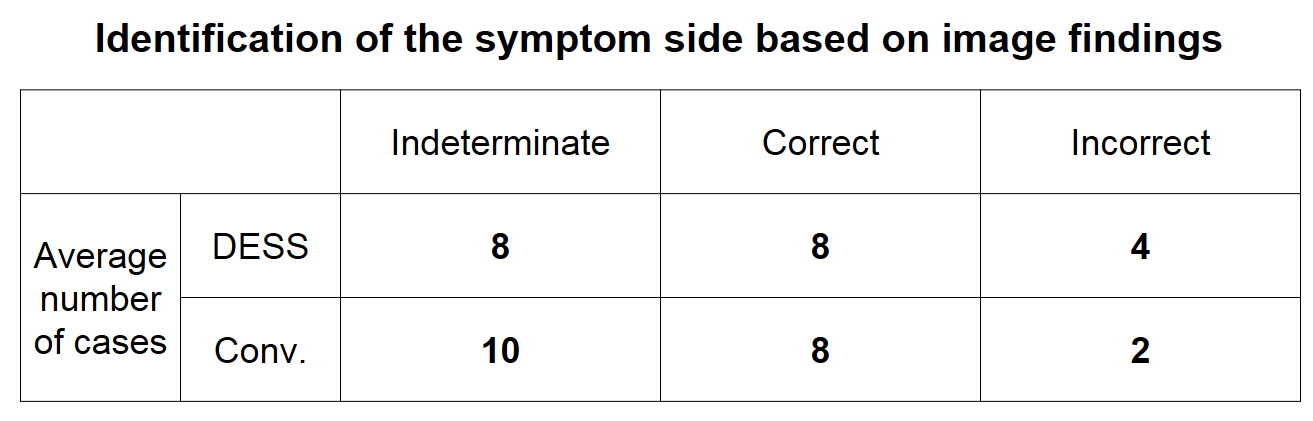
Figure 2 presents two cases where the DESS showed improved visualization of pathologic peripheral nerve conditions. The top-row images show a vasculogenic neuropathy case where the left S1 spinal nerve is compressed between the artery and vein. Focal, subtle signal increase in the distal S1 nerve is better visualized on the DESS image (right) than the coronal T2 FS image (left). The bottom-row images show a right S1 nerve neuropathy case where the increase of the right S1 nerve stands out better on the DESS image (right) than the coronal T2 FS image (left). Figure 3 summarizes the review scores of the DESS images and the conventional sequence images in each category: DESS was assigned higher scores in all categories. The score difference between the DESS and conventional sequences was statistically significant (p value < 0.05) in all categories. Table 2 demonstrates the pain side prediction results using DESS and conventional images. The average number of correct cases between the DESS and the conventional cases were the same (8 out of 20) while the conventional images had slightly fewer incorrect predictions (2 for conventional images vs 4 for DESS).Discussion
The steady-state acquisition in DESS offers signal consistency during sampling along phase/slice dimensions unlike conventional FSE sequences. This could avoid the image blurring that the conventional FSE sequences suffer from, and may result in sharper nerve visualization. The SNR improvement due to the 3D acquisition allowed for higher spatial resolution both in-plane and through-plane with DESS, which enabled the capturing of small nerve structures in the lumbosacral plexus. The T2- and diffusion-weighted contrast of the second echo image in DESS helped identification of edema on nerves and suppression of the blood vessel signal, respectively. The simultaneous acquisition of the high-SNR anatomical image (first echo) and the pathology-sensitive image (second echo) using DESS may be exploited to replace separate acquisitions of T1- and T2-weighted fast spin echo for nerve visualization. However, it is unclear from the symptom prediction result whether DESS performs better than the conventional sequence in pathology detection, and the number of indeterminate cases was high (8 out of 20). Therefore, further research for contrast optimization to improve sensitivity is required.Conclusion
In this abstract, we conducted a radiologic comparison of DESS and conventional sequences for imaging the lumbosacral plexus. Our results demonstrate improved nerve structure visualization by DESS with comparable symptom prediction accuracy.Acknowledgements
NIH R01 AR0063643, GE Healthcare.References
1. F.A. Howe, A.G. Filler, B.A. Bell, and J.R. Griffiths. Magnetic resonance neurography. Magn Reson in Med, 28:328-338, 1992.
2. Z.W. Zhang, L.J. Song, Q.F. Meng, Z.P. Li, B.N. Luo, Y.H. Yang, and Z. Pei. High-resolution diffusion-weighted MR imaging of the human lumbosacral plexus and its branches based on a steady-state free precession imaging technique at 3T. AJNR Am J. Neuroradiol, 29:1092-1094, 2008.
3. M. Yoneyama, T. Takahara, T. C. Kwee, M. Nakamura, and T. Tabuchi. Rapid high resolution MR neurography with a diffusion-weighted pre-pulse. Magn Reson Med Sci, 12(2):111-9, 2013.
4. S. Webb, C. A. Munro, R. Midha, and G. J. Stanisz. Is Multicomponent T2 a Good Measure of Myelin Content in Peripheral Nerve? Mag Reson in Med, 49:638–645, 2003.
5. V. Taviani, M Mitsuharu, K. Wang, K. King, S. Banerjee, S. Biswal, S. Vasanawala, D. Yoon, and R. Peters (2017). A Flexible Technique for Flow-Sensitive Fat-Suppressed High-Resolution Peripheral Nerve Imaging. Proceedings of International Society of Magnetic Resonance in Medicine, p. 96.
6. A. S. Chaudhari, B. Sveinsson, J. P. Wood, D. S. Thakur, K. J. Stevens, C. F. Beaulieu, M. T. Alley, C. Abercrombie, G. E. Gold, and B. A. Hargreaves (2017). 5 Minute Comprehensive Knee MRI with 3D Double-Echo Steady-State (DESS). Proceedings of International Society of Magnetic Resonance in Medicine, p. 230.
Figures