5144
Muscle Activation using 3D Cones Sodium, T2-Weighted Imaging, and T2 Mapping: Comparison of Techniques1Electrical Engineering, Brigham Young University, Provo, UT, United States, 2Exercise Science, Brigham Young University, Provo, UT, United States
Synopsis
We present a comparison of muscle functional magnetic resonance imaging (mfMRI) techniques in order to determine the most accurate method of measuring muscle activation via MRI that is practical and easy-to-use in numerous research environments.
Introduction
The ability to noninvasively identify muscle activation has both potential clinical and research applications. Identifying muscle activation could be used to diagnose metabolic muscle disease, identify muscular dysfunction, observe muscle deterioration in aging individuals, and help researchers better understand the biological foundation of muscle chemistry 1. Currently, the dominant method of quantifying muscle activation is invasive electromyography (EMG) 1-3. A variety of muscle functional MRI (mfMRI) techniques have been demonstrated to non-invasively identify muscle activation 2. Current proven methods of mfMRI include analyzing pre- and post-exercise T2-weighted images, T2 maps, and sodium images of muscle. However, there is considerable uncertainty around the accuracy of each of these techniques 1-4.
In this work, we tested three imaging techniques (3D cones sodium MRI, T2-weighted imaging, and T2-mapping) to determine the method with the greatest post-exercise shift in signal intensity. We found that all three methods were effective at identifying muscle activation. Given the data, we conclude that simple T2-mapping is likely a good candidate for a standard muscle activation protocol, given its better performance over simple T2-weighted imaging and the complexity associated with sodium MRI.
Methods
Exercise Regimen
3 healthy male 23 year old subjects were recruited after informed consent and performed 3 sets of 25 calf raises followed by 3 sets of 15 squat jumps. They were given 30-60 seconds of rest between each set and were told to focus on full contraction of their calf muscles while completing the protocol. If they were not able to do the full 15 or 25 on the last set, they were told to go to failure.
Imaging Protocols and Analysis
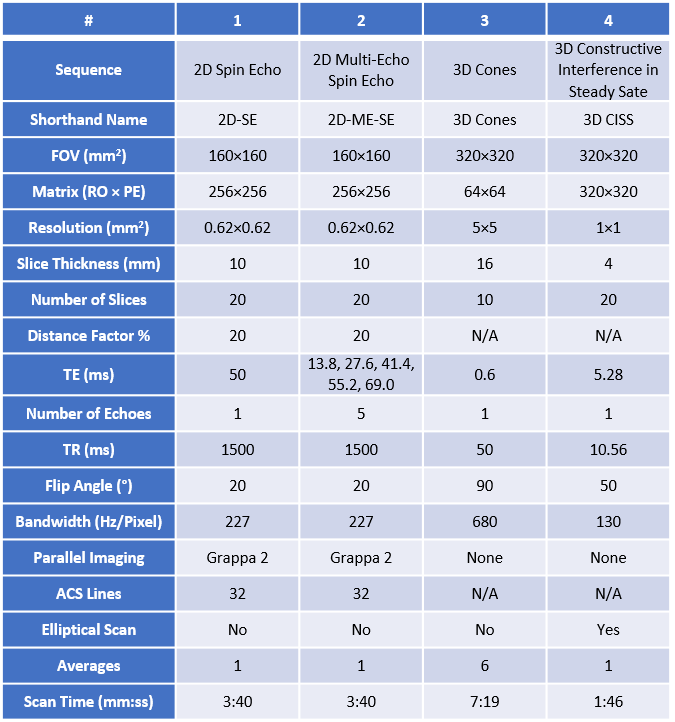
All data was collected on a Siemens MAGNETOM Tim Trio (Siemens Healthineers, Erlangen, Germany) magnet using a total of 4 different imaging protocols, as shown in Table 1. A 2D Spin Echo (2D-SE) sequence was used to acquire T2-weighted images, a 2D Multi-Echo Spin Echo (2D-MESE) sequence was used to construct T2 maps, and a custom 3D Cones sequence was used to acquire 23Na images. Finally, a 3D Constructive Interference in Steady State (3D-CISS) sequence was used as an anatomical reference for 23Na images. An 8 channel foot/ankle coil was used for the 2D-SE and 2D-ME-SE sequences, and a custom 6 inch 23Na surface loop coil and 4 channel flex coil were used for imaging 3D-Cones sodium and 3D-CISS respectively. Raw data for 3D cones sodium MRI was reconstructed offline using MATLAB.
Studies for T2, T2 mapping, and sodium imaging were completed separately with sufficient time in between to allow muscle to return to rest state. Only two subjects completed 23Na imaging. To ensure consistent image locations, subjects were marked around the thickest part of the calf with permanent marker for localization using the laser on the table. Segmentations were manually drawn for the gastrocnemius medialis, gastrocnemius lateralis, and soleus muscles on the T2-weighted image and T2 map datasets, and segmentations for the gastrocnemius medialis and gastrocnemius lateralis were drawn for the sodium datasets. Using the T2 weighted images, mean SNR values in each segmented muscle were calculated in pre- and post-exercise images, and the same segmentations applied to the T2 maps, and 23Na scans.
Results
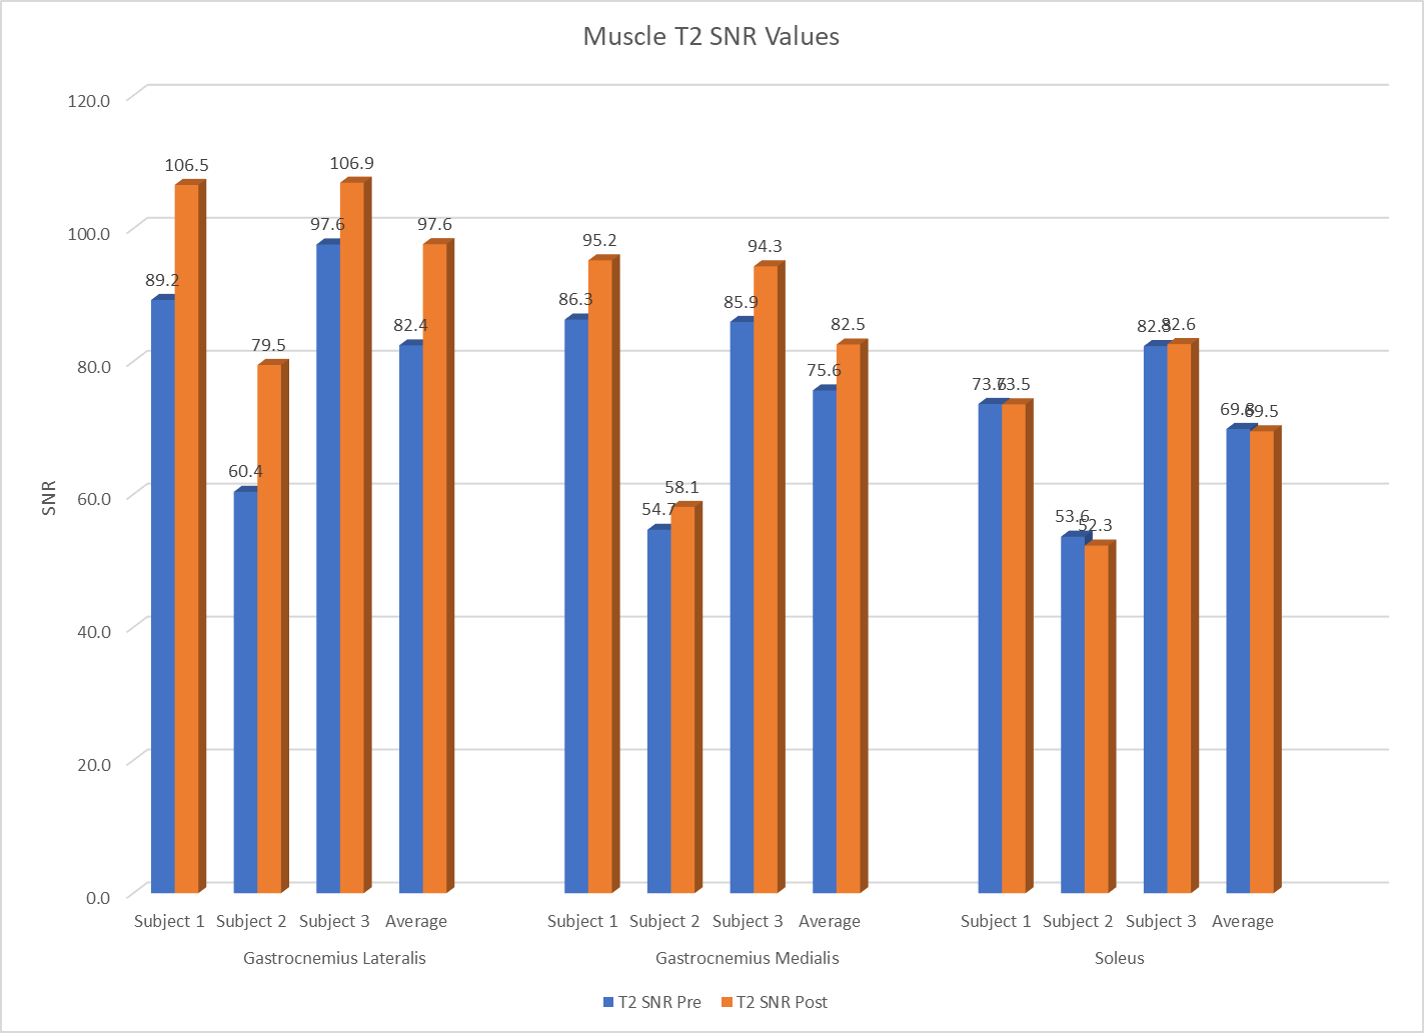
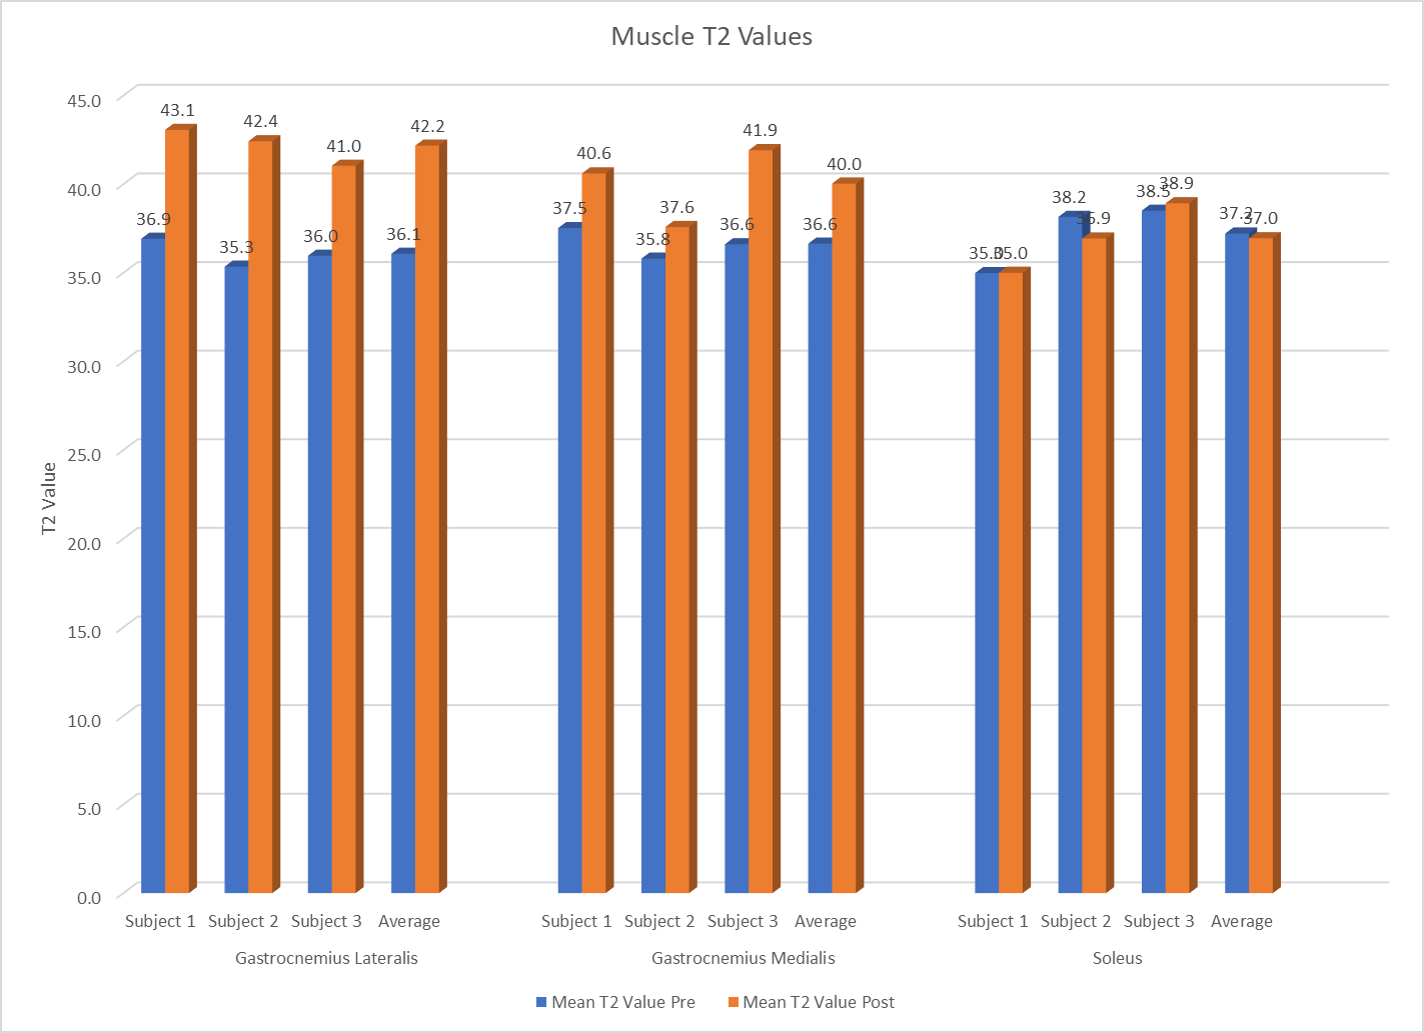
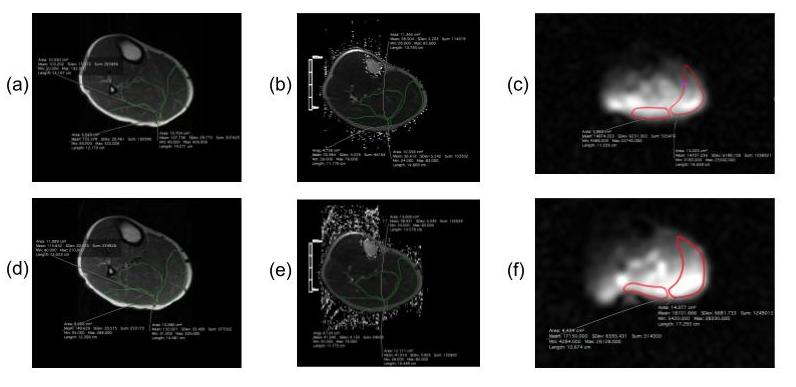
Results for the T2 SNR depicted in Figure 1 show an average elevation post exercise in the gastrocnemius lateralis of 18.5%, and in the gastrocnemius medialis of 9.1%. The soleus muscle did not show any appreciable activation post exercise. Result for T2 values depicted in Figure 2 show an average post exercise elevation of 16.9% and 9.3% across subjects in the gastrocnemius lateralis and gastrocnemius medialis respectively; soleus muscle showed no appreciable activation. Results from sodium images depicted in Figure 3 show an average increase in SNR post exercise across subjects of 5.1% and 10.2% in the gastrocnemius lateralis and gastrocnemius medialis respectively. Raw images are shown in Figure 4.Discussion
Each method of measuring muscle activation showed an increase post-exercise in some or all of the muscle groups analyzed. Comparing T2 SNR values may be simplest, and showed the greatest signal enhancement. Due to the simplicity of acquiring T2-weighted images or T2-maps compared to 23Na imaging and their higher performance, these two techniques are likely better candidates for simple studies. T2-mapping we believe will be slightly more robust, due to the difficulty of ensuring an accurate background noise estimate to measure SNR in T2-weighted images (for example, when motion or other artifact may be present in noise measurement locations). Future work will allow optimization of such a protocol to provide better contrast pre- and post-exercise.Acknowledgements
Funding from the National Institutes of Health 2 R01 EB002524-10References
1. Cagnie B, Elliott J, et al. Muscle Functional MRI as an ImagingTool to Evaluate Muscle Activity. Journal of Orthopaedic & Sports Physical Therapy 2011; 41(11): 896-901
2. Patten C, Meyer R, et al. T2 Mapping of Muscle. Semin Musculoskelet Radiol 2003; 7(4): 297-307
3. Gooding T, Feger A, et al. Intrinsic Foot Muscle Activation During Specific Exercises: A T2 Time Magnetic Resonance Imaging Study. Journal of Athletic Training 2016; 51(8): 644-650
4. Damon B, Wadington M, et al. Absolute and relative contributions of BOLD effects to the muscle functional MRI signal intensity time course: Effect of exercise intensity. Magnetic Resonance in Medicine 2007; 58(2): 335-345
Figures