5143
Variation of Strain Rate with Force Output in the Medial Gastrocnemius During Isometric Contractions in Young and Senior Subjects1Radiology, UC San Diego, San Diego, CA, United States, 2Physics, UC San Diego, La Jolla, CA, United States, 3Physics, San Diego State University, San Diego, CA, United States
Synopsis
Strain rate tensor mapping can be conveniently computed from velocity encoded phase contrast imaging. It provides a tool to explore local tissue deformations including the magnitude and directions of the principal axes of deformations. The study of the variation of strain rate indices with force output (% Maximum Voluntary Contraction (MVC) can provide additional information similar to stress-strain relationships measured at the whole muscle level. Here, we present the methodological developments to extract 2D Strain rate indices as a function of %MVC in 6 normal young (3) and senior (3) subjects. An approximately linear variation of SR indices with %MVC force was seen in the range of 20-50% MVC in young and senior subjects.
Purpose
The ability to image tissue deformations provides a non-invasive way to study muscle kinematics at the voxel level. Strain rate (SR) imaging based on velocity encoded phase contrast imaging has been recently established as a viable methodology to extract strain rate parameters that capture tissue deformations1. The variation of the SR indices with force output (% Maximum Voluntary Contraction, MVC) can provide information on stress-strain like relationships though %MVC is the total force output and not the stress in a specific muscle. The purpose is to study the variation of tissue deformation in the medial gastrocnemius (MG) quantified by SR indices extracted from velocity encoded phase contrast images as a function of % MVC during isometric contractions for young and senior subjects.Methods
Six subjects (3 young, 3 senior) were recruited after IRB approval and scanned on a 1.5T GE scanner. Imaging protocol included a set of gated VE-PC images obtained during isometric contraction (TE: 7.7ms, TR: 16.4ms, NEX: 2, FA: 20°, slice thickness 5mm, sagittal-oblique orientation, FOV: 30×22.5cm (partial-phase FOV: 0.75), matrix: 256×192, 4 views/segment, 22 phases, 3D velocity encoding, venc: 10cm/s. 72 repetitions, cycle length 2.9sec). Subject’s foot was fixed to the foot-pedal device2 with Velcro straps lower leg was placed inside cardiac RF coil. A combination of in-house built LabView program with a fiber-optic Fabry-Pérot interferometer strain sensor attached to the cast provided a real-time visual feedback to the subject and trigged the MR image acquisition. The visual feedback facilitated consistency of the force curves during image acqusition. Data sets were obtained for peak forces corresponding to 20, 30, 40 and 50% (50% was reached by all young and 1 senior subject) of MVC. Prior to the analysis phase-contrast images were corrected for phase shading artifacts and denoised using 2D anisotropic diffusion filter3. 2DSR tensor was calculated from the velocity images by taking spatial gradient and then symmetrized. Strain rate eigenvalues (SRfiber, SRin-plane) were obtained from SR tensor through eigenvalue decomposition1. SRthrough-plane was computed from SRfiber and SRin-plane based on the incompressibility of muscle tissue. SRshear was calculated from the two principal strain rates as:
$$ SR_{shear}=\frac{1}{2}\left( SR_{in-plane}-SR_{fiber}\right) \,\,\,\,\,\,\,\,\,\, (1)$$
Quantitative analysis was performed for 3 regions of interest placed in medial gastrocnemius muscle (7x7 in proximal and middle, 5x10 in distal). Position of each voxel inside ROI was tracked in plane across the contraction-relaxation cycle. Strain rate indices were extracted at the frame corresponding to max SRfiber during contraction part of the cycle.
Results
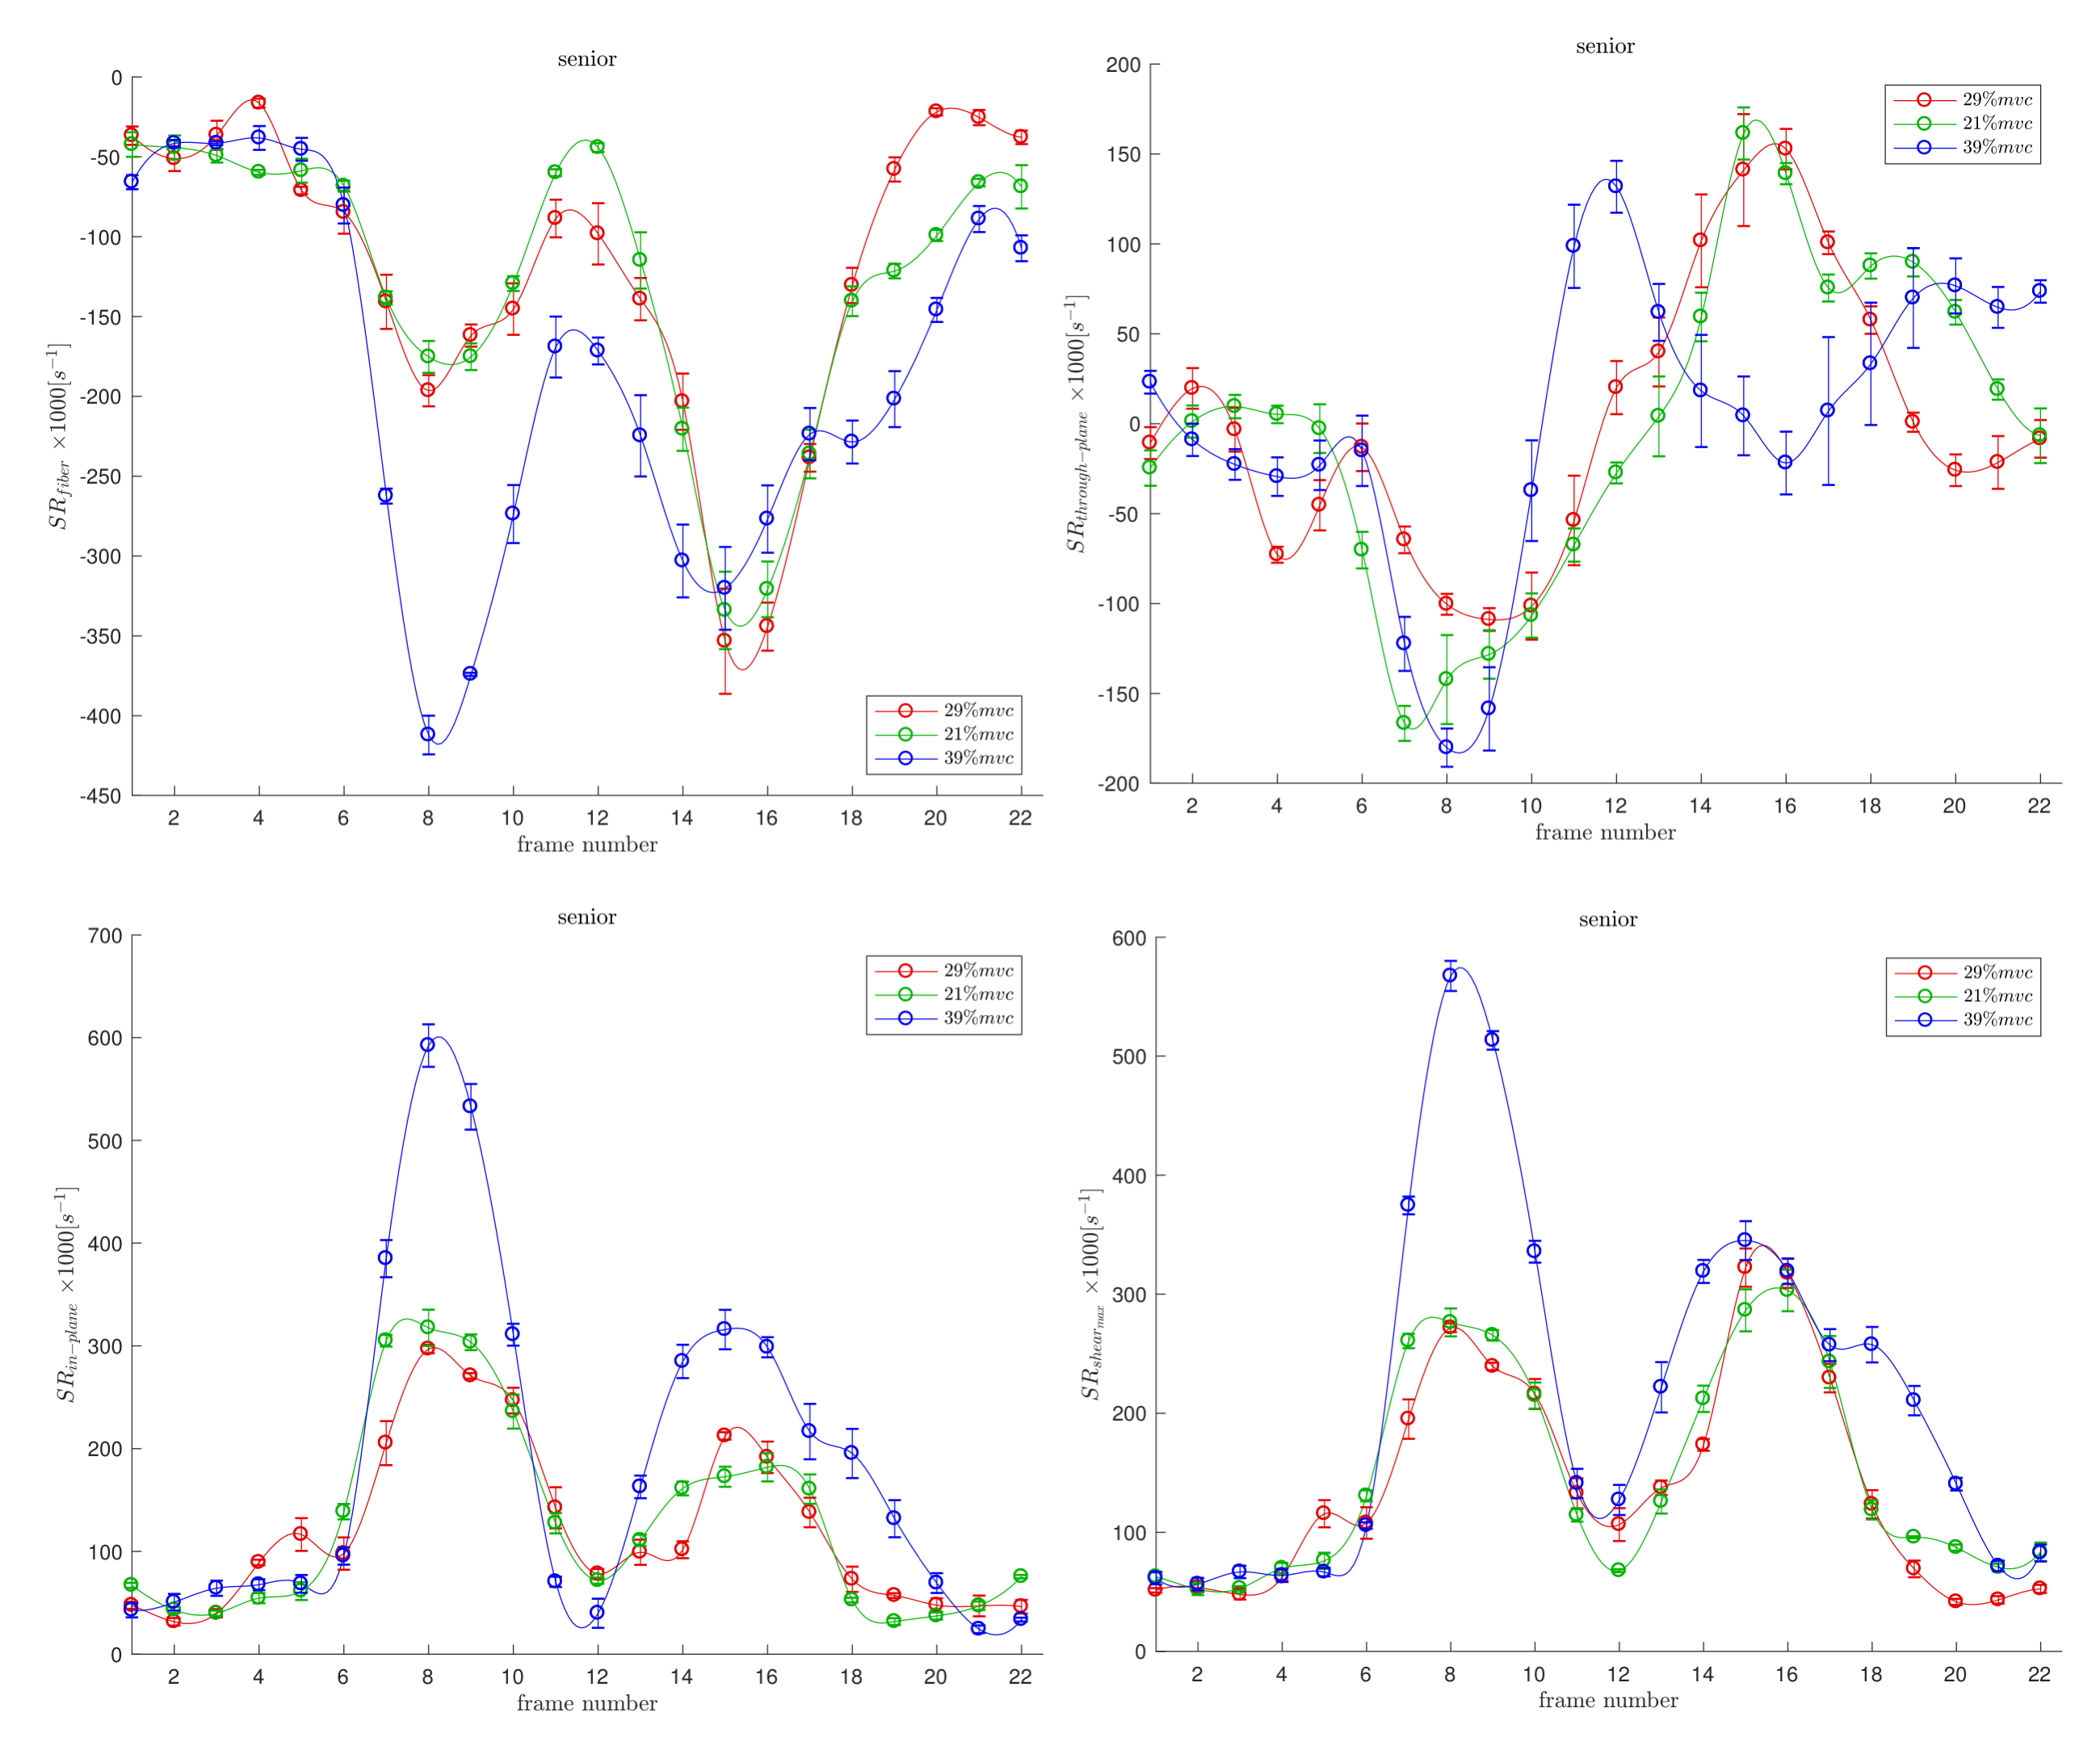
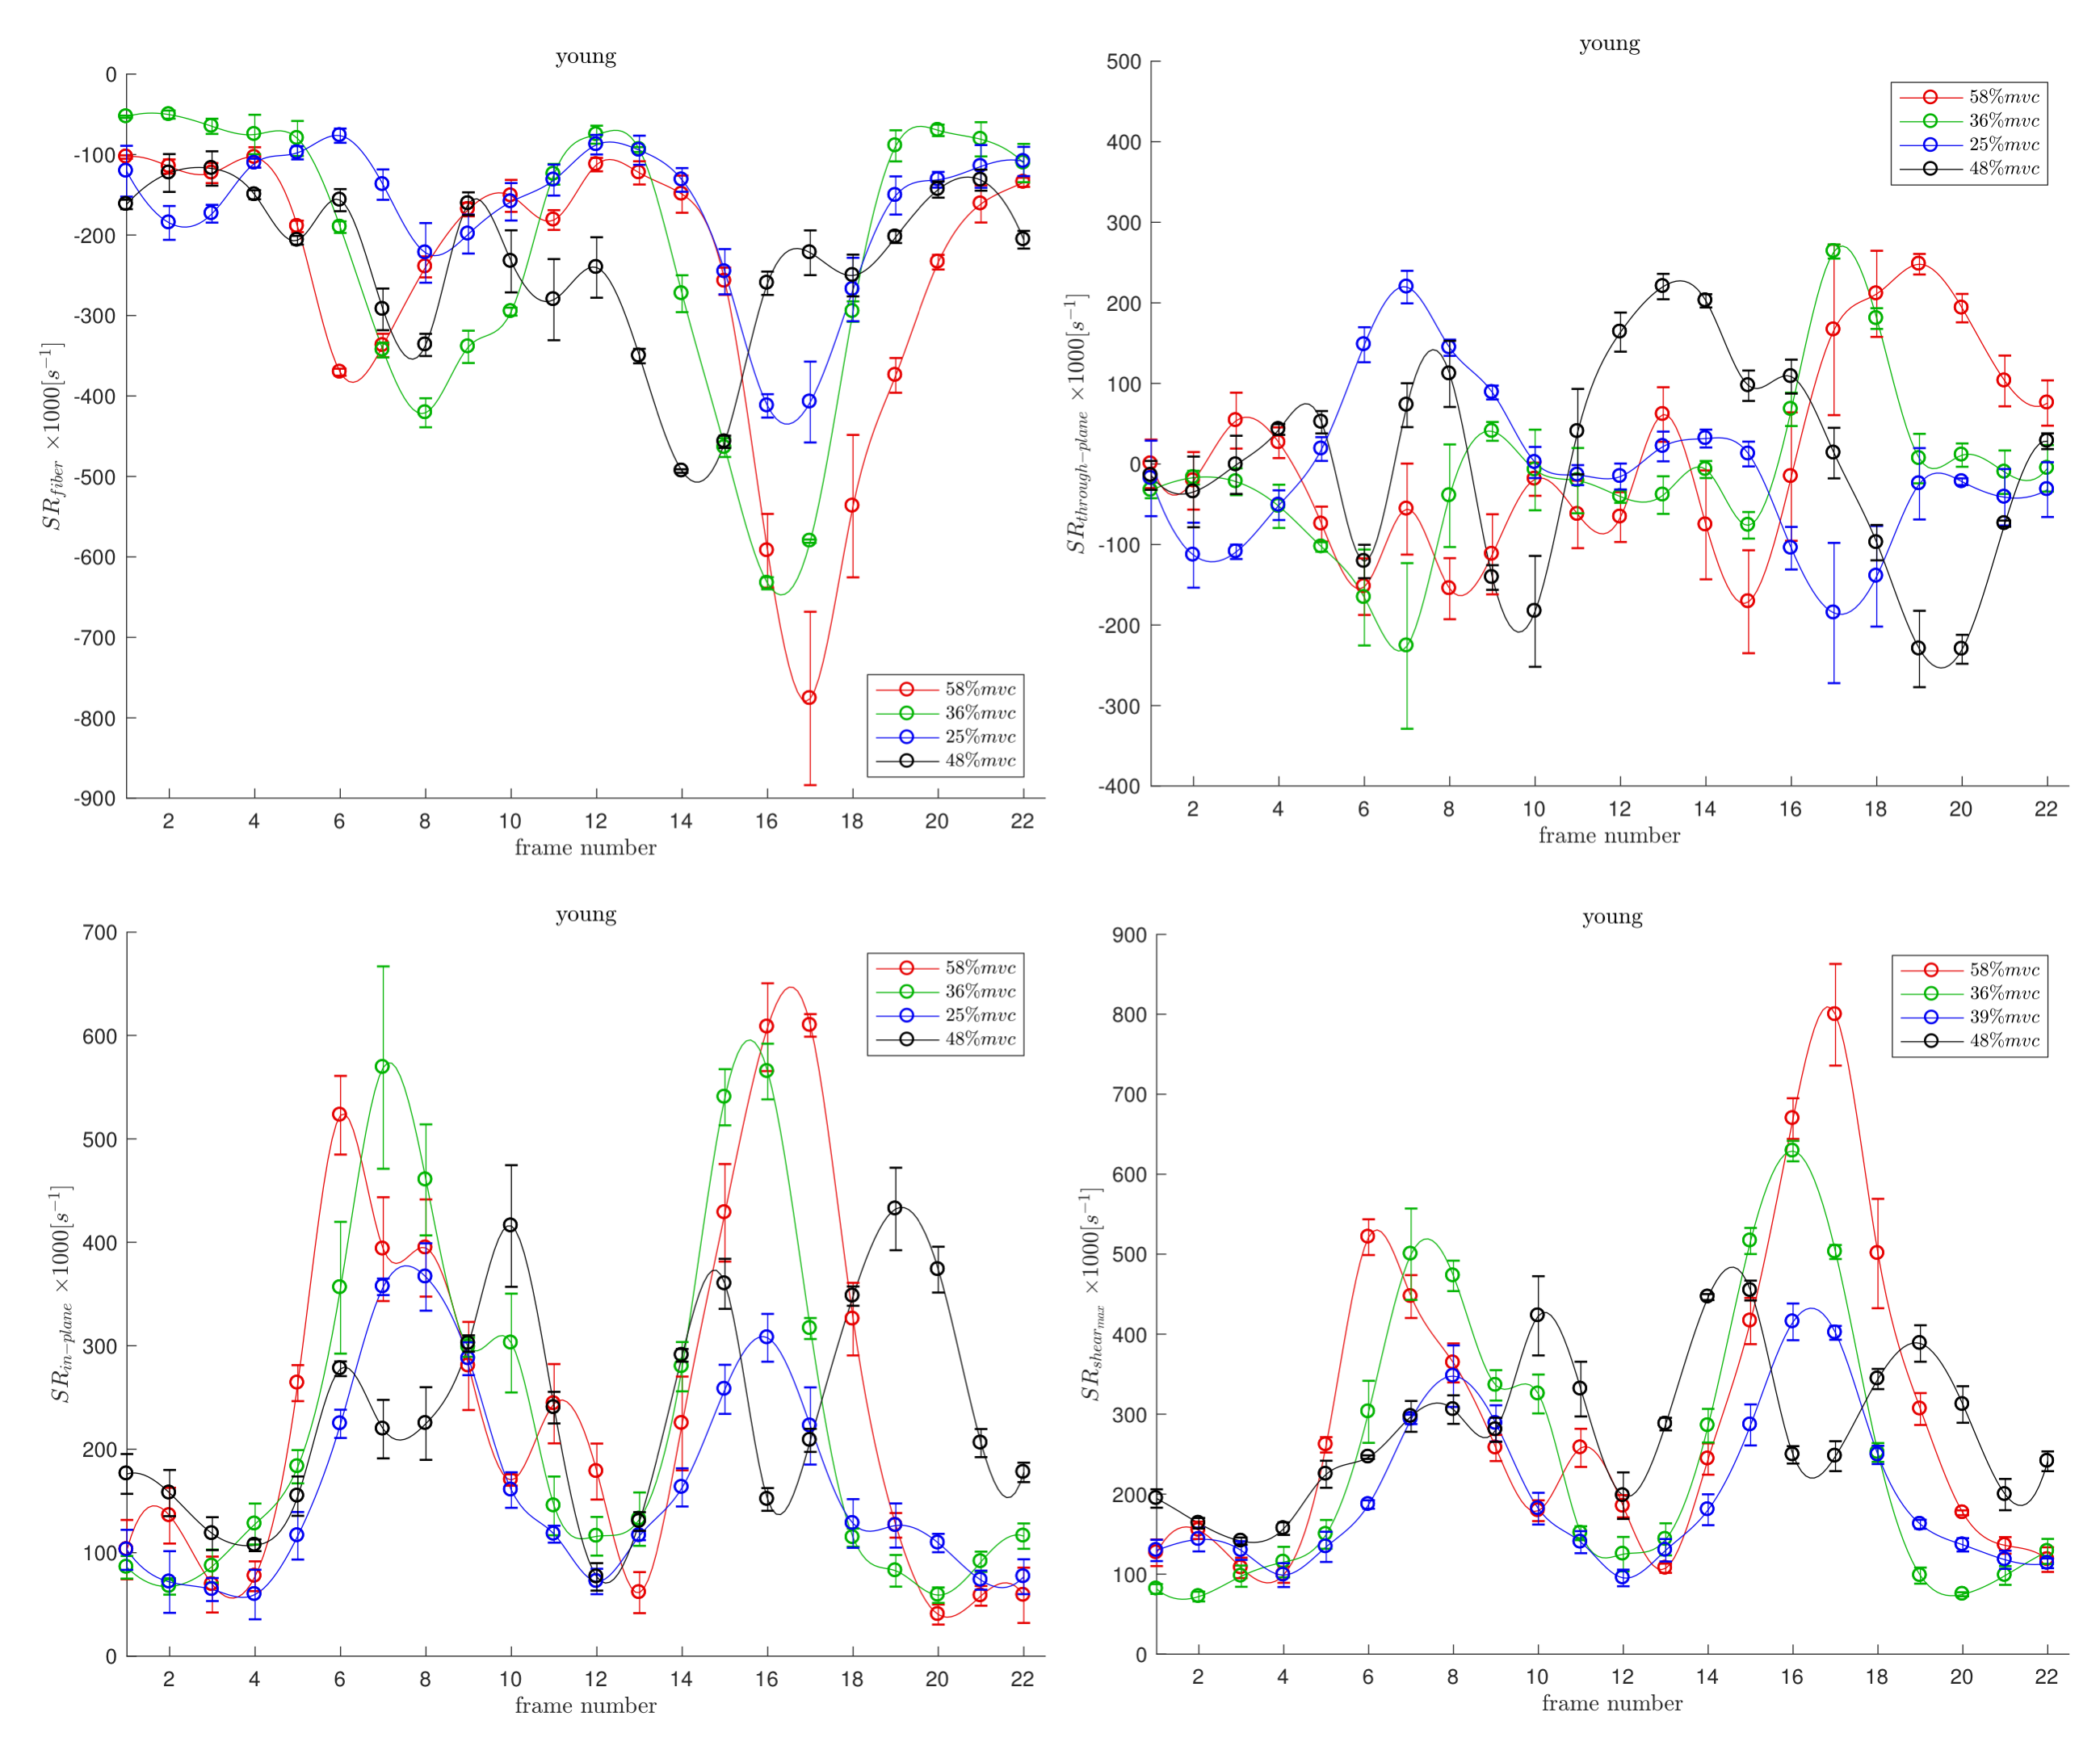
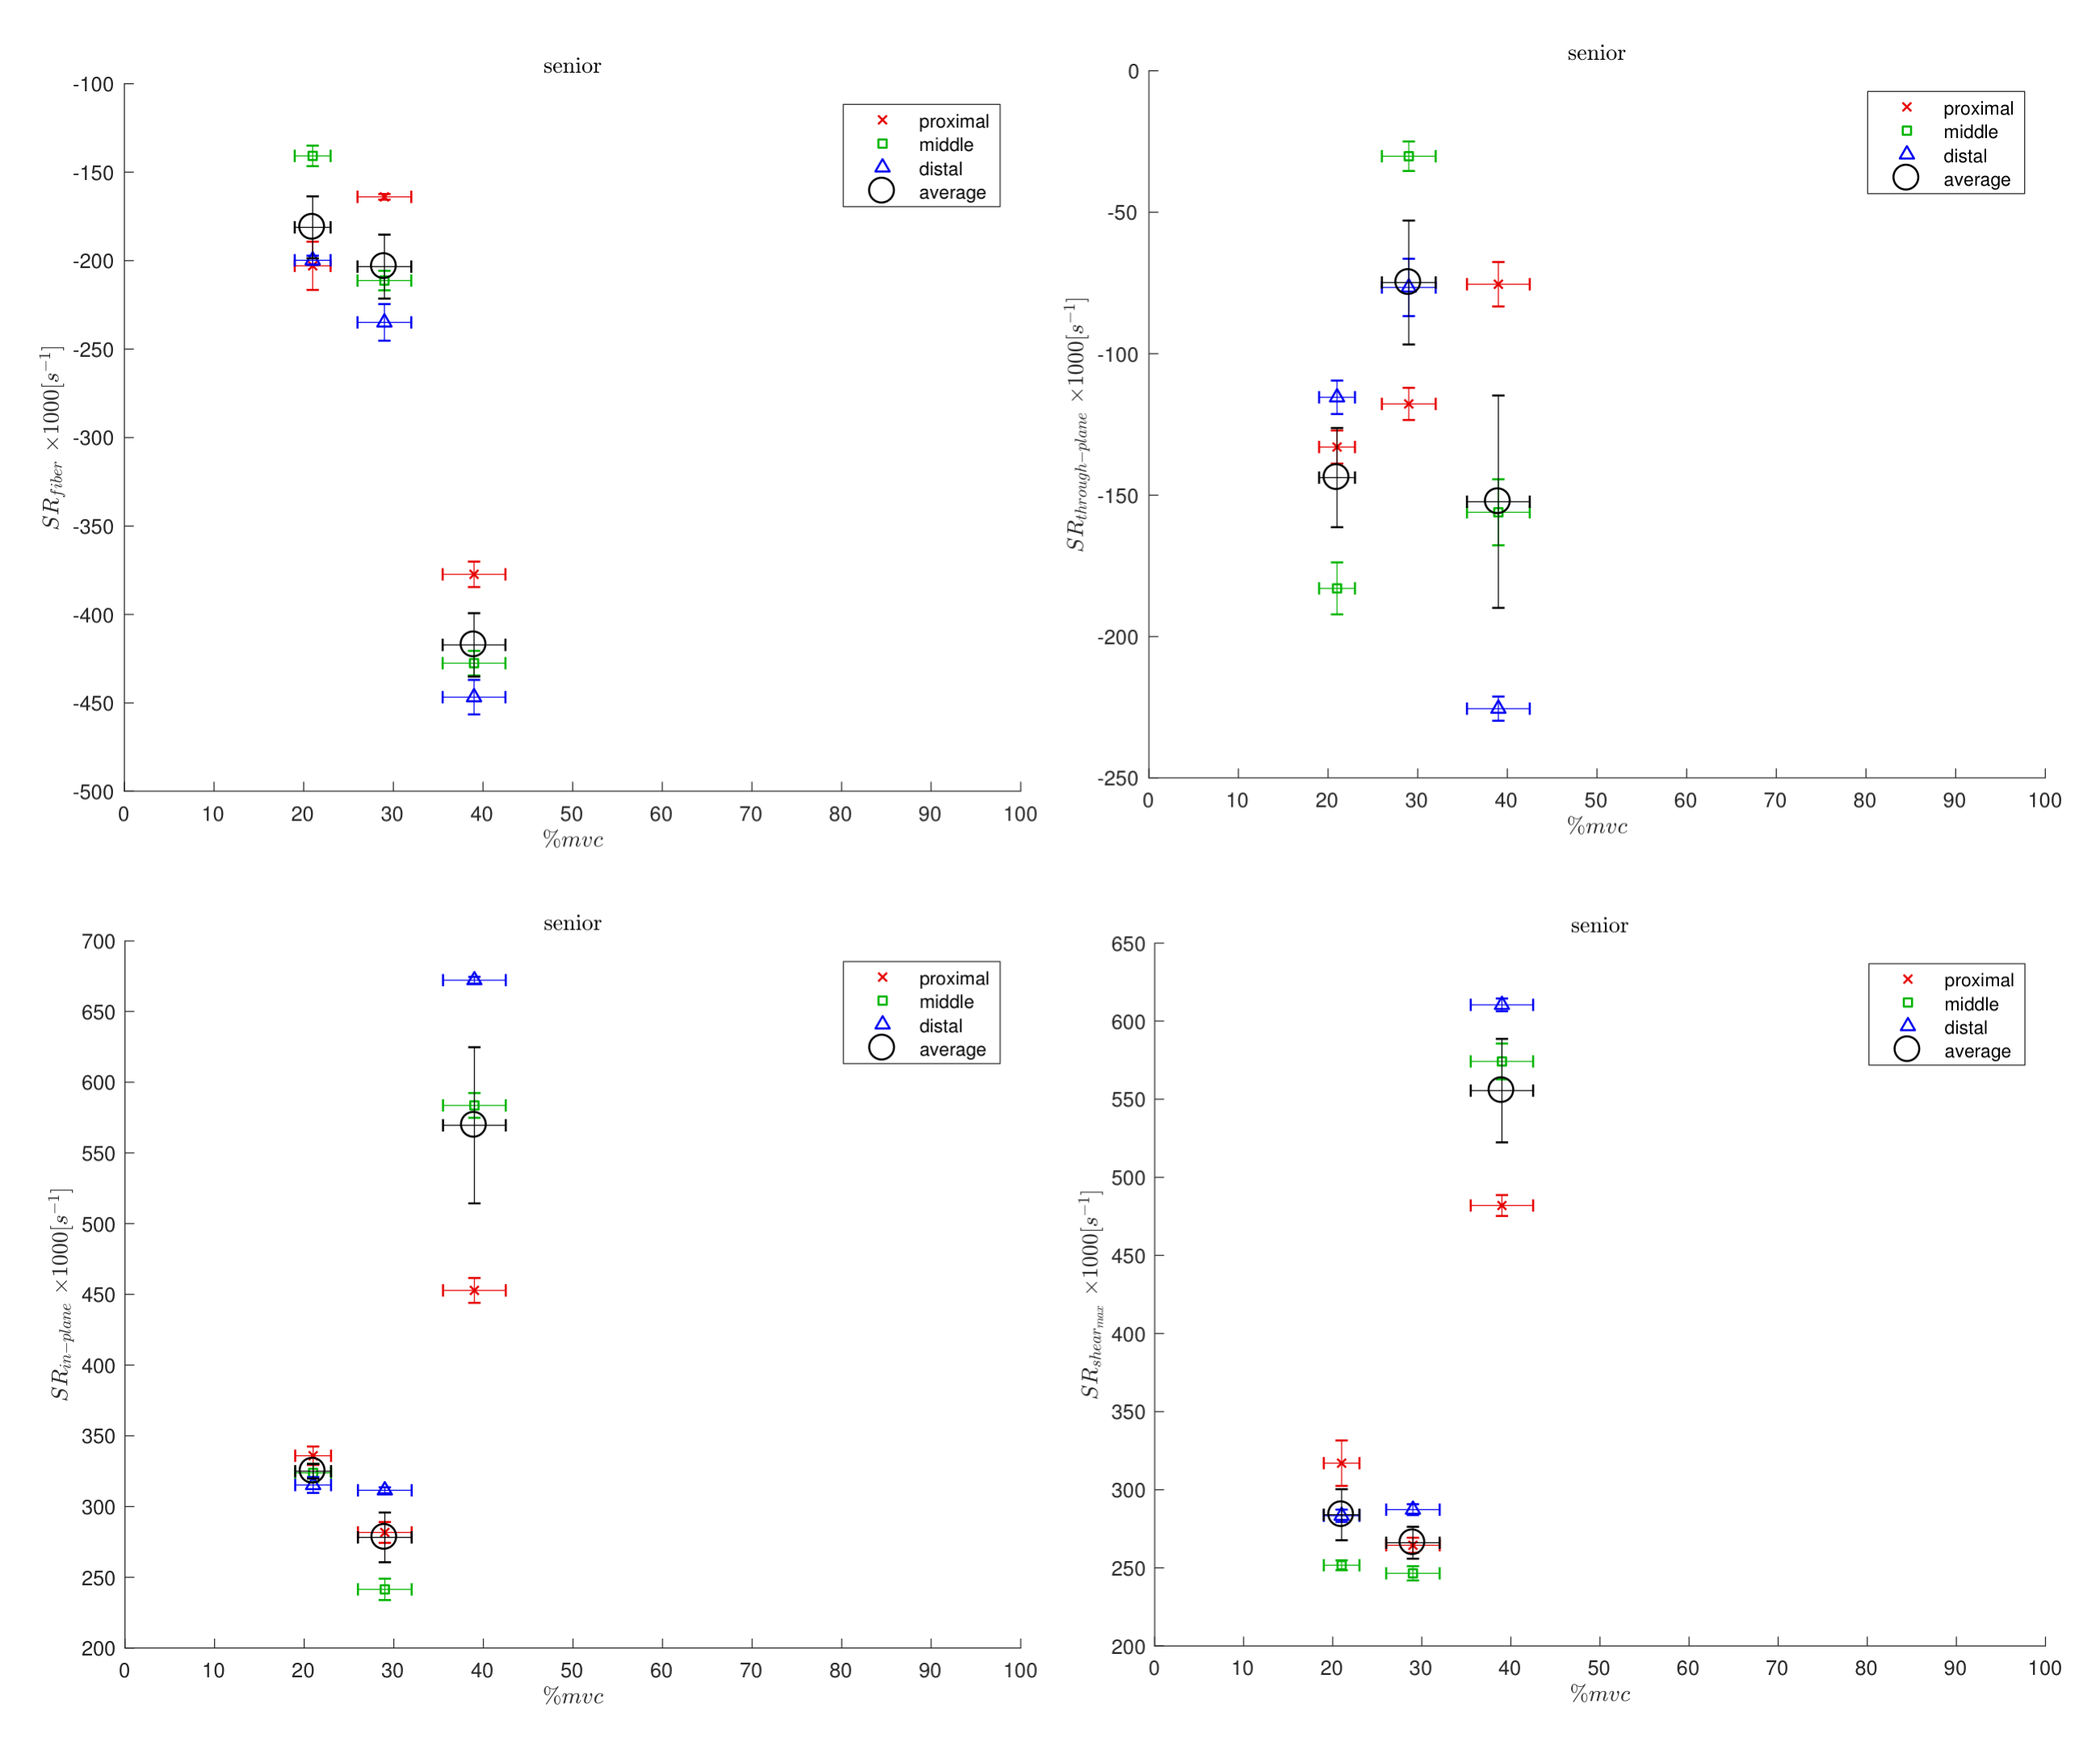
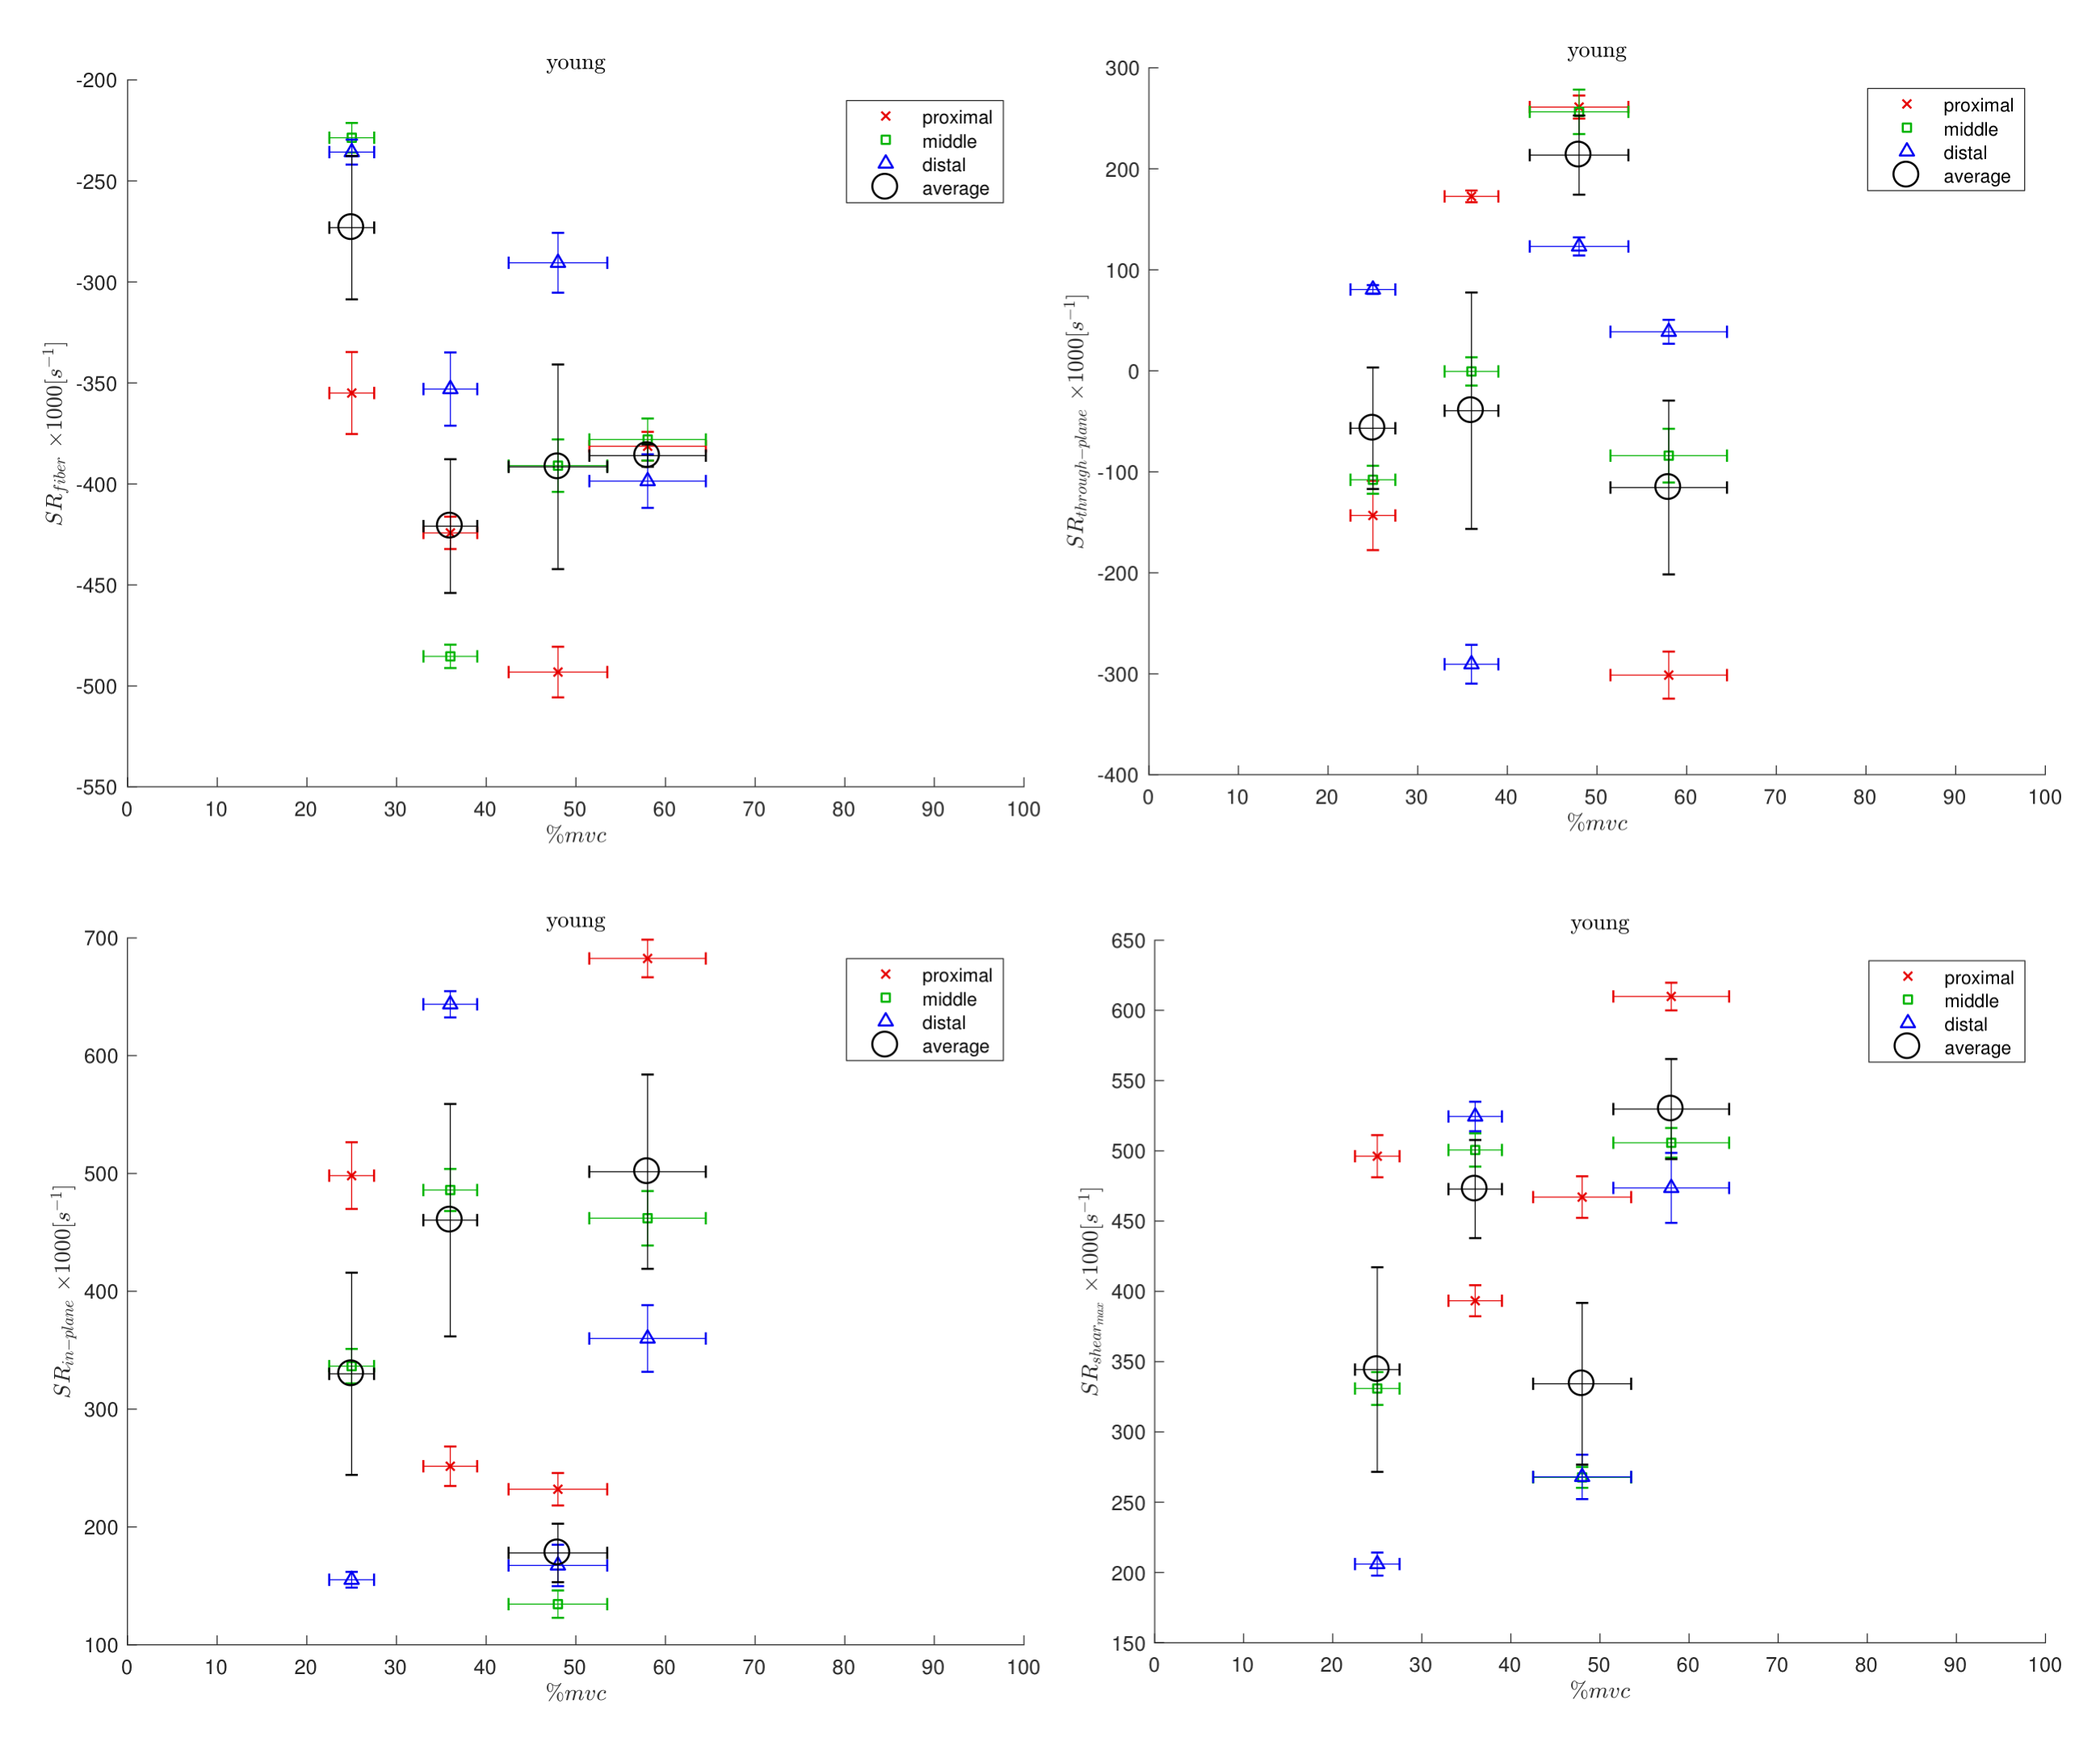
Figs. 1 and 2 shows the temporal maps of the SR indices (SRfiber, SRthrough-plane, SRin-plane and SRshear) at three locations (proximal, middle, distal) in the MG as a function of the isometric contraction cycle for one young and in senior subject respectively. The two peaks seen during the isometric contraction cycle correspond to the peaks in the contraction and relaxation phases of the cycle. The variation of the strain rate indices (evaluated at the frame corresponding to max SRfiber during contraction part of the cycle) with %MVC is shown in Figs. 3 and 4 for one young and one senior subject respectively. The plots include data from the individual ROIs as well as the average for all three locations. The increase in the magnitude of SR values with %MVC can be readily appreciated in both young and senior subjects.Discussion
Strain rate along the fiber direction increased with %MVC for both young and senior subjects (within the variability of the measurement) showing the increased contraction of the muscle fiber in order to produce more force. Since the contraction in the fiber direction is compensated by an expansion in the fiber cross-section, it stands to reason that an increased contraction along the muscle fiber (SRfiber) will be accompanied by an increase in the fiber cross-section(SRin-plane). This is seen as an increase in SRin-plane with % MVC in both young and senior subjects. SRthrough-plane is usually much smaller than SRin-plane revealing an asymmetry in deformation in the fiber cross-section. SRshear increased with %MVC as well in both young and senior subjects. SRshear has been attributed to shear in the endomysium and has been postulated as the likely origin of lateral transmission of force4; studies like the current one has the potential to explore changes in LTF with age.Conclusion
This the first report of the variation of SR indices with %MVC and the study confirms technical feasibility to 50% MVC. The magnitude of the SR indices increased with % MVC in both cohorts showing that the proposed technique can be used to explore age related changes in tissue deformations with % MVC.Acknowledgements
This work was supported by the National Institute of Arthritis and Musculoskeletal and Skin Diseases Grant 5RO1-AR-053343-08.References
[1] Malis V, Sinha U, Csapo R, Narici M, Sinha S. Magn Reson Med. 2017;doi: 10.1002/mrm.26759.
[2] Sinha, S., Shin, D. D., Hodgson, J. A., Kinugasa, R. & Edgerton, V. R. J. Magn. Reson. Imaging 2012, 36: 498–504.
[3] Perona, P. & Malik, J. Pattern Analysis and Machine Intelligence, IEEE Transactions on 1990: 12, 629–639.
[4] Zhong X, Epstein FH, Spottiswoode BS, Helm PA, Blemker SS. J Biomech. 2008;41(3):532-40.
Figures