5141
Quantitative and qualitative analysis of paraspinal back muscle with focus on fat content using CT and MRI in asymptomatic volunteers1Radiology, Hallym University Dongtan Sacred Heart Hospital, Hwaseong-si, Gyeonggi-do, Republic of Korea, 2Medical Imaging Unit, Faculty of Medicine, Universiti Teknologi MARA (UiTM), Sg. Buloh, Malaysia, 3Radiology, Soonchunhyang University Bucheon Hospitial, Bucheon-si Gyeonggi-do, Republic of Korea, 4Neurosurgery, Hallym University Dongtan Sacred Heart Hospital, Hwaseong-si, Gyeonggi-do, Republic of Korea
Synopsis
MRI and CT can be reliably used for qualitative and quantitative analysis of para-spinal back muscles in healthy volunteers, especially regarding fat content. Good correlation was found between the two methods. Female gender and older age were associated with higher fat content of para-spinal back muscles.
Introduction
As people age, degenerative changes occur in the para-spinal back muscles with fatty infiltrations1-5. Degenerative changes of para-spinal muscles have not been systematically analyzed with a standardized classified system unlike the degenerative changes of the muscles of the rotator cuff muscles of the shoulder, which have been evaluated using the Goutallier’s classification6-9. Therefore, in this study, we tried to analyze qualitatively and quantitatively the paraspinal back muscles of asymptomatic volunteers using both CT and MRI.Methods
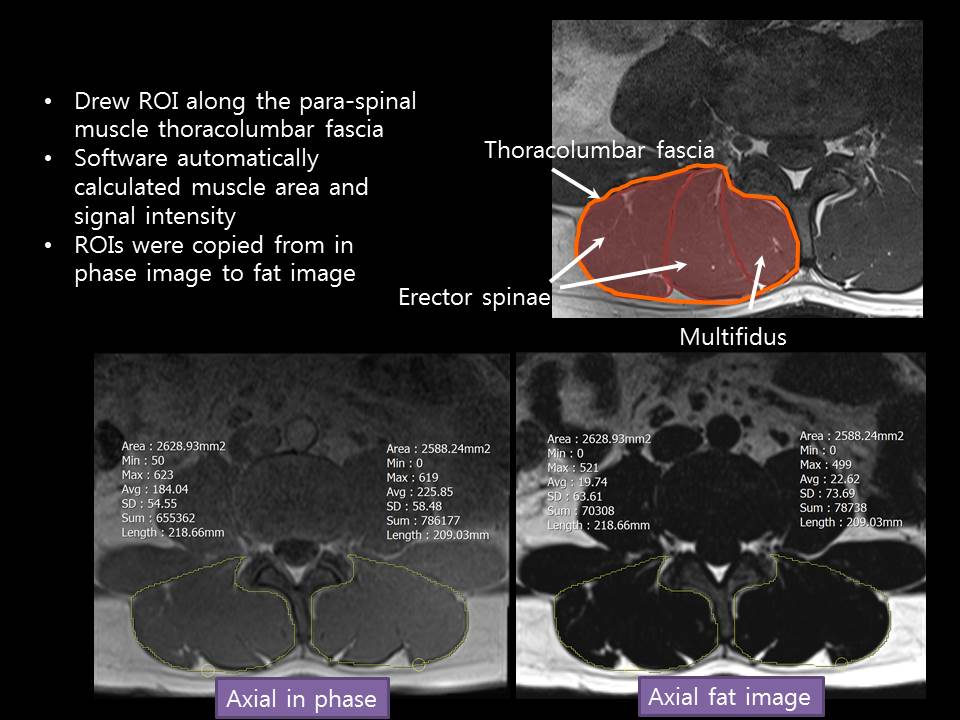
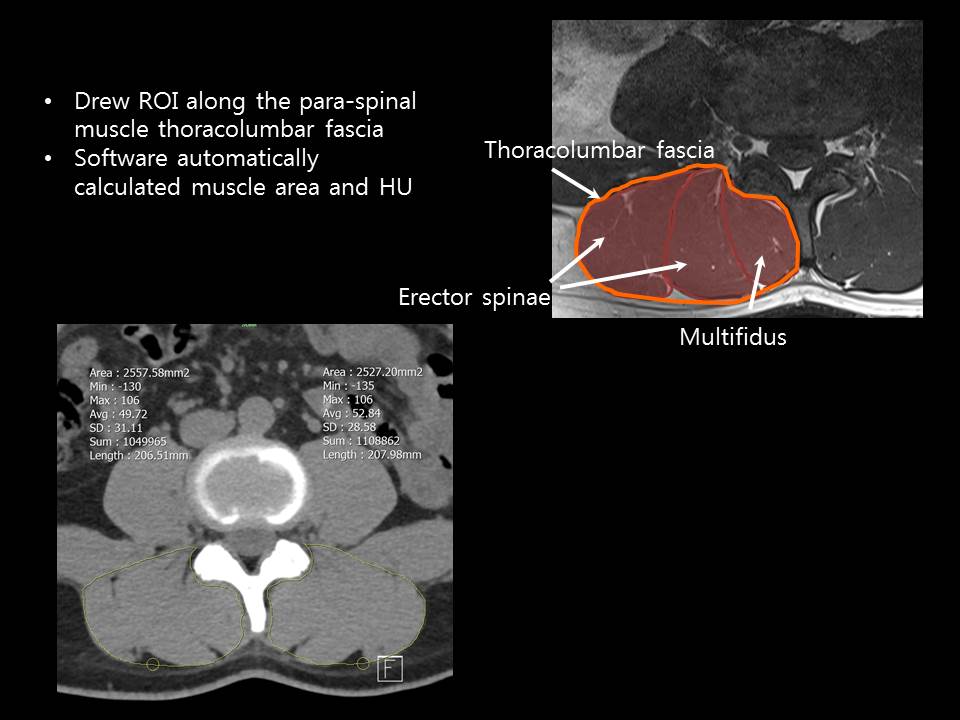
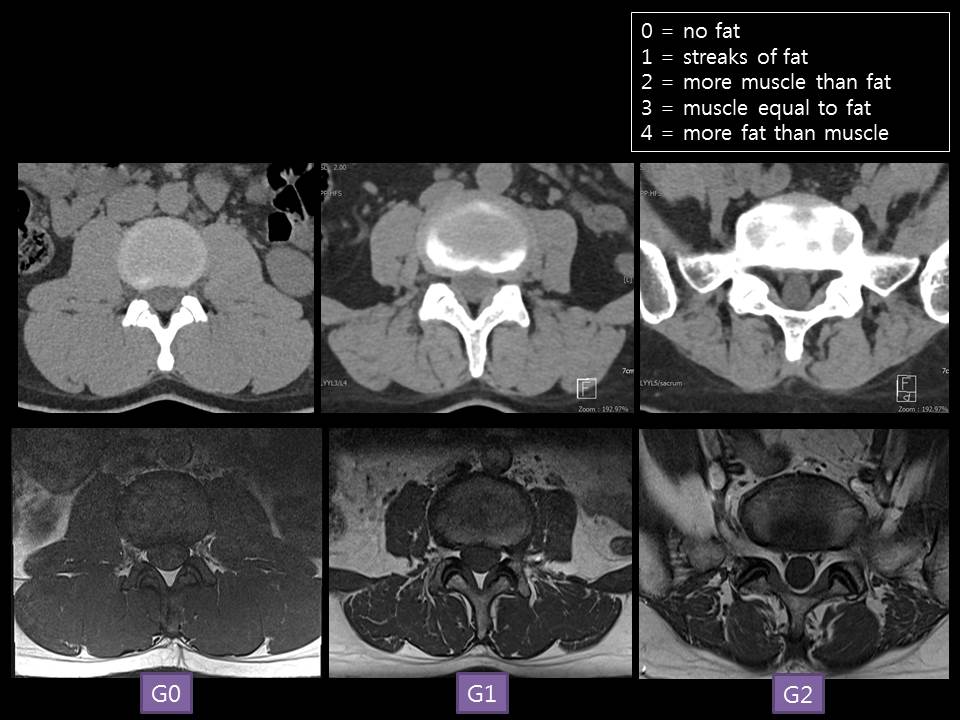
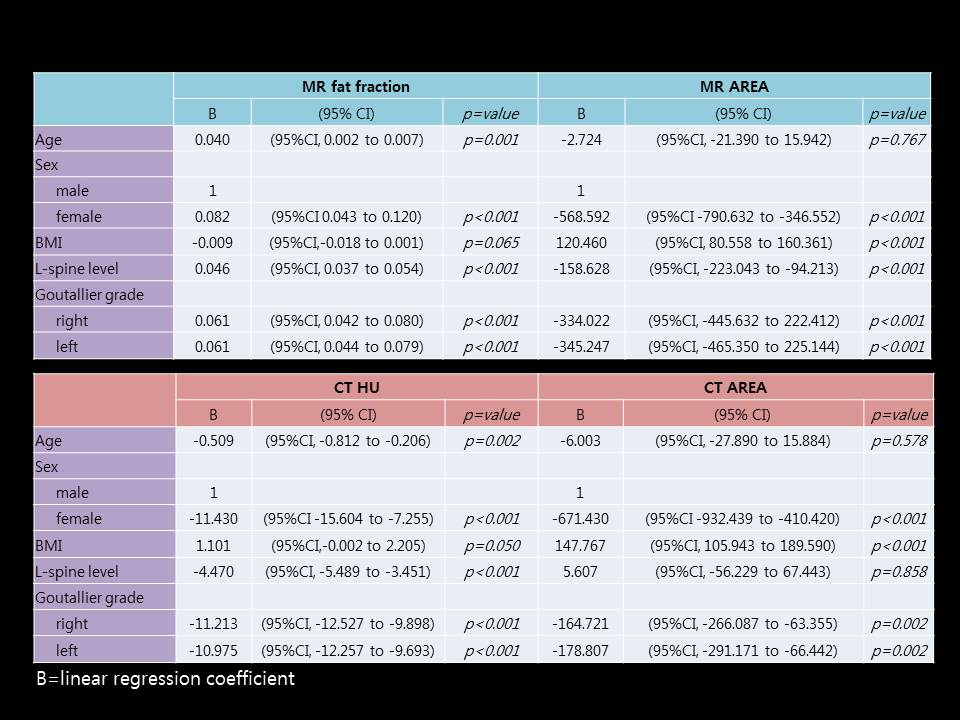
In this prospective study, we recruited asymptomatic adult volunteers from August 2016 to April 2017, who underwent CT and MRI. A total of 29 patients were enrolled (age range 23-50 years, mean age 34.31 years; 14 men, 15 women), with an average body mass index (BMI) of 22.97 kg/m2 (SD 2.64). Qualitative analysis on CT and MRI were done using grades (0-4) by Goutallier for each lumbar spine level. Quantitative analysis was performed using Hounsfield unit (HU) on CT and fat fraction using two point Dixon on 3T MRI10-14; spinal muscle areas were measured on CT and MRI. Three musculoskeletal radiologists analyzed the images. Inter- and intraobserver agreements were measured by Kappa statics, Kendall’s coefficient of concordance, and intraclass correlation coefficient. Spearman's correlation and simple linear regression were used for correlation. Multiple linear regression was used to measure the influence of these variables.Results
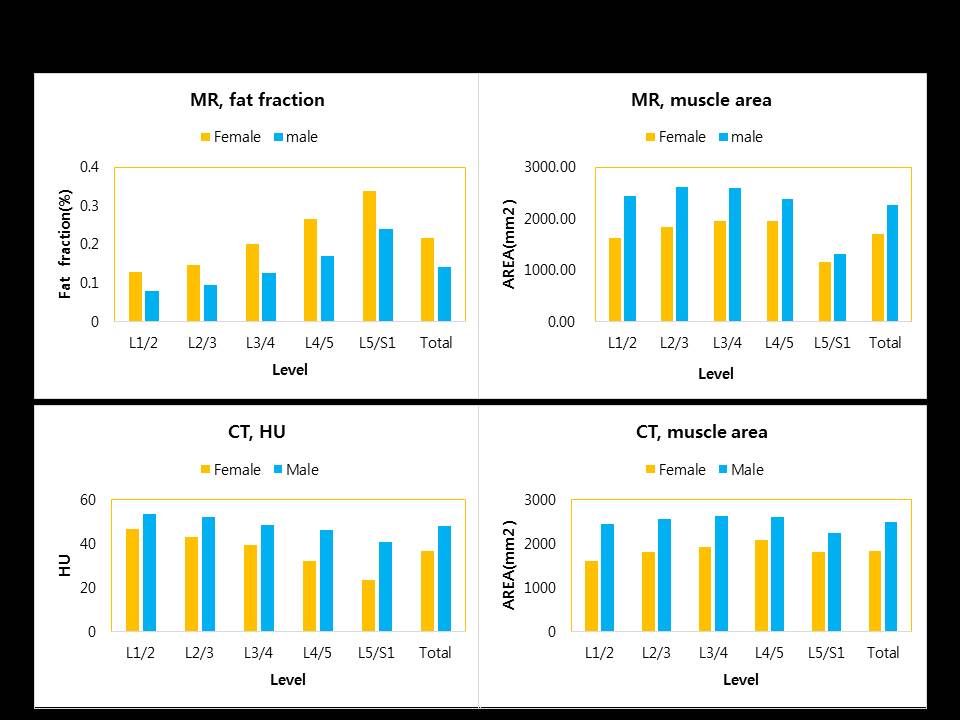
On MRI, fat fraction was higher in women (26.41% ± 0.54%) than in men (14.26% ± 1.06%) (p = 0.035) and muscle area on MRI was higher in males (2297.59mm2 ± 282.26mm2) than females (1728.99 mm2 ± 289.29 mm2) (p<0.001). On CT, HU was lower in women (36.66 ± 1.59) than in men (48.29 ± 1.23) (p<0.001). At each L-spine level, qualitative analysis showed excellent (> 0.8) agreement between MRI and CT. In quantitative analysis, muscle area of MRI and CT showed excellent agreement at 0.87-0.99 and 0.84-0.99, respectively. Reliability of MR fat fraction and HU was measured to be 0.9 or more, except for level L3/4 (0.55) on MR. In reviewer 1, intraobserver reliability was higher than 0.9 in fat fraction and HU, but was variable in both CT and MR qualitative analysis (-0.58 ~ 0.91, 0.63-1.0). In reviewers 2 and 3, there was a high agreement between qualitative and quantitative analysis, but qualitative analysis showed a slightly lower agreement than the quantitative analysis. MR fat fraction increased and HU decreased with increasing age, which was statistically significant. However, the area of muscle in MR and CT was not statistically significant with respect to age and gender, and was associated with BMI (p<0.001). Quantitative analysis of CT and MR showed correlation with gender, with higher fat fraction, smaller HU, and smaller muscle area in women (p<0.001 or p=0.002). Quantitative values of MR and CT showed a statistically significant correlation with Goutallier grade. Among the variables, gender was the most influential variable for MR fat fraction and HU. BMI was the most influential variable for muscle area on MRI and CT, which was statistically significant. Fat fraction at L3 and HU at L2 correlated best with total lumbar fat fraction(r>0.9, p<0.001), respectively.Discussion
The reliability of both MRI and CT were excellent regarding quantitative analysis but more variable among the observers in qualitative analysis. Quantitative analysis of back muscles showed higher fat content in women on both MRI and CT and good correlation with qualitative analysis. Areas of back muscles were greater in men on CT and MRI. There was excellent correlation between MRI and CT. Fat content increased significantly with increasing age. Area of back muscle both on MRI and CT was associated with increased BMI. Fat fraction at L3 on MRI and HU on CT at L2 correlated best with total lumbar fat content.Conclusion
MRI and CT can be reliably used for qualitative and quantitative analysis of para-spinal back muscles in healthy volunteers, especially regarding fat content. Good correlation was found between the two methods. Female gender and older age were associated with higher fat content of para-spinal back muscles. Further study with greater number of patients is warranted.Acknowledgements
No acknowledgement found.References
1. Kjaer P, Bendix T, Sorensen JS, et al. Are MRI-defined fat infiltrations in the multifidus muscles associated with low back pain? BMC Med 2007;5:2.
2. Kader DF, Wardlaw D, Smith FW. Correlation between the MRI changes in the lumbar multifidus muscles and leg pain. Clin Radiol 2000;55:145–149 3. Fischer MA, Nanz D, Shimakawa A, et al. Quantification of muscle fat in patients with low back pain: comparison of multi-echo MR imaging with singlevoxel MR spectroscopy. Radiology 2013;266:555–563.
4. Mengiardi B, Schmid MR, Boos N, et al. Fat content of lumbar paraspinal muscles in patients with chronic low back pain and in asymptomatic volunteers: quantification with MR spectroscopy. Radiology 2006;240:786-792.
5. Teichtahl AJ, Urquhart DM, Wang Y, et al. Fat infiltration of paraspinal muscles is associated with low back pain, disability, and structural abnormalities in community-based adults. Spine J 2015; 15: 1593-1601.
6. Camillo Theo Müller, Florian M. Buck, Nadja Mamisch-Saupe, et al. Good Correlation of Goutallier Rating of Supraspinatus Fatty Changes on Axial and Reformatted Parasagittal Computed Tomographic Image. J Comput Assist Tomogr. 38(2); 2014;340~343.
7. Battaglia PJ, Maeda Y, Welk A, et al. Reliability of the Goutallier classification in quantifying muscle fatty degeneration in the lumbar multifidus using magnetic resonance imaging. J Manipulative Physiol Ther 2014; 37: 190-197.
8. Lee E, Choi JA, Oh JH, at al. Fatty degeneration of the rotator cuff muscles on pre- and postoperative CT arthrography (CTA): is the Goutallier grading system reliable? Skeletal Radiol 2013; 42: 1259-1267.
9. Oh JH, Kim SH, Choi JA, et al. Reliability of the grading system for fatty degeneration of rotator cuff muscles. Clin Orthop Relat Res 2010; 468: 1558-1564.
10. Nozaki T, Tasaki A, Horiuchi S, et al. Predicting Retear after Repair of Full-Thickness Rotator Cuff Tear: Two-Point Dixon MR Imaging Quantification of Fatty Muscle Degeneration-Initial Experience with 1-year Follow-up. Radiology. 2016;280(2):500-509.
11. Crawford RJ, Filli L, Elliott JM, et al. Age- and Level-Dependence of Fatty Infiltration in Lumbar Paravertebral Muscles of Healthy Volunteers. AJNR Am J Neuroradiol. 2016;37(4):742-748.
12. Tingart MJ, Apreleva M, Lehtinen JT, et al. Magnetic resonance imaging in quantitative analysis of rotator cuff muscle volume. Clin Orthop 2003; 415: 104-110.
13. Goutallier D, Postel JM, Bernageau J et al. Fatty muscle degeneration in cuff ruptures: pre-and postoperative evaluation by CT scan. Clin Orthop. 1994; 304: 78-83.
14. van de Sande MAJ, Stoel BC, Obermann WR, et al. Quantitative assessment of fatty degeneration in rotator cuff muscles determined with computed tomography. Invest Radiol 2005; 40: 313-319.
Figures