5139
Rectus capitis posterior minor and nuchal ligament work as a mydural bridge complex-from 3D MR Imaging in vivo1radiology department, The first affiliated Hospital of Dalian Medical University, Dalian, China, 2GE Healthcare, MR Research China, Beijing, China, 3Department of Anatomy, Dalian Medical University, Dalian, China
Synopsis
Myodural bridges (MDB) are soft tissue connections crossing the cervical epidural space to link suboccipital muscles, ligament and cervical dura. It may transmit tensile force from its connection components to dura mater which correlates with spinal cord circulation and chronic headache. The MDB was first described as a dense connective tissue bridge located between the rectus capitis posterior minor (RCPmi) muscle and the spinal dura. RCPmi mass has been suggested as a biomechanical contributor to injury severity in mild traumatic injury and cervicogenic headache. The fibers from nuchal ligament (NL) have also been demonstrated to attach to the cervical dura mater and may affect the RCPmi muscle mass. However, the correlation between RCPmi and NL remains unclear and is investigated in this work.
Purpose
To assess the potential correlation of the rectus capitis posterior minor muscle and nuchal ligament, two components of myodural bridge via suboccipital zone using 3D MR imaging.Introduction
Previous literature revealed the existence of some fibrous fascial tissue bridges extending from the suboccipital structures to the cervical dura mater, which is named as myodural bridges. The RCPmi was the first reported component of MDB. Additionally, NL had been shown to attach to the cervical dura mater. Whether these two structures work collectively or independently is unknown. A previous study showed some muscular or fibrous tissues from RCPmi terminated into NL. In anatomical MR images, fibrous or muscular tissues were identified as low signal intensity band, and a potential correlation may exist connecting them. The current study aimed to identify whether the RCPmi and NL form a complex composition in the MDB in vivo.Materials and Methods
This retrospective study was approved by the institutional review board and the informed consent was waived. Three hundred and twenty subjects underwent 3D T2WI CUBE MR imaging of the suboccipital muscles and NL. Sagittal T2 CUBE MR imaging sequences (TR: 2500ms; TE: 70 ms; slice thickness: 0.6 mm) were obtained on a 1.5 T or 3.0 T MRI scanner (GE Signa HDxt, USA) with a spinal phase-array coil. The parasagittal reformatted images of the RCPmi and NL were analyzed using the Functool post-processing software equipped on the Advantage Workstation (GE, AW4.6, USA). Thereafter, the subjects were classified into positive and negative groups according to connection observed between RCPmi and NL. The positive group indicated hypo-intense band or strip from RCPmi to NL while the negative group demonstrated no connection between them (Figure 1). The major axis of cross-sectional area (maCSA) of left and right RCPmi was measured with a 30°deviation from the oblique plane that passed through the mid-posterior arch of atlas (Figure 2). The body mass index (BMI) and gender distributions in these two groups were compared with Spearman analysis. Two experienced radiologists measured all the maCSAs separately and the inter-examiner agreement was tested by means of the repeated measures ANOVA intraclass correlation coefficient (ICC). The differences of maCSAs between positive and negative groups were compared using the paired Student’s t-test. A P-value<0.05 was considered to be statistically significant.Results and discussion
A total of 624 RCPmis were observed in 316 subjects with 311 on the left side and 313 on the right side. Hypo-intense bands or strips from RCPmis to NLs were identified in positive group including 123 RCPmis with 61 on the left side and 62 on the right side. There were 501 RCPmis in negative group. Representative images of the positive and negative groups are shown in Fig.1. The BMI and gender showed no correlation between these two groups (r=0.053, 0.045). The inter-examiner repeatability of MRI measurements (ICC) for RCPmis’ maCSA were 0.891, suggesting a good agreement. The measurement method is shown in fig.2. The mean maCSAs of positive group was significantly smaller than that of negative group (55.95±26.76 mm2 vs. 64.78±30.07 mm2, P=0.003) .Conclusions
The current study indicated that RCPmi connected with NL by hypo-intense fibrous or muscular tissue correlating with smaller RCPmis. This may indicate that RCPmi and NL work together as a myodural bridge complex.Acknowledgements
The authors wish to acknowledge the department of radiology and Mrs. Xu Bin, Ms. Libao and Ms. Li Si-yao for their contribution to this work.References
[1] Yuan XY, Li C, Sui JY, et al. PLoS One, 2017,12(5): e0177120.
[2] Fakhran S, Qu C, Alhilali LM. AJNR Am J Neuroradiol, 2016, 37(8): 1556-60.
Figures
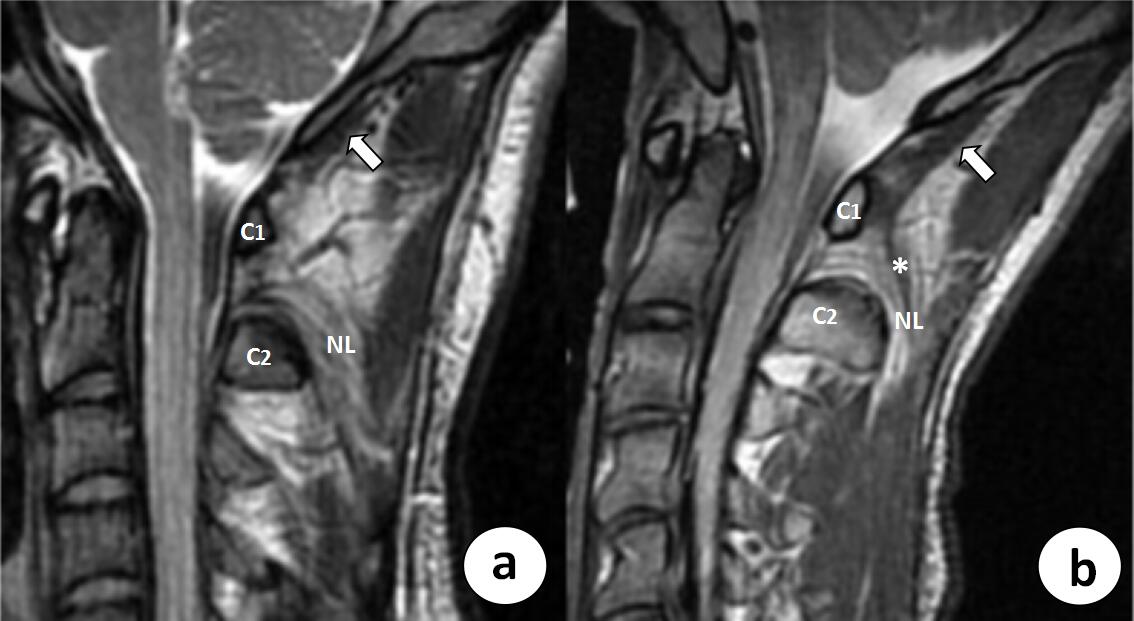
Negative and positive connection between RCPmi and NL. a. Sagittal T2-weighted image demonstrate no connection between NL and RCPmi (white arrow). b. Parasagittal T2-weighted image shows hypo-intense bands (white *) course directly from NL to the posterior and medial border of the RCPmi (white arrow).
Remarks: NL: nuchal ligament; RCPmi: rectus capitis posterior minor; C1: atlas; C2: axis
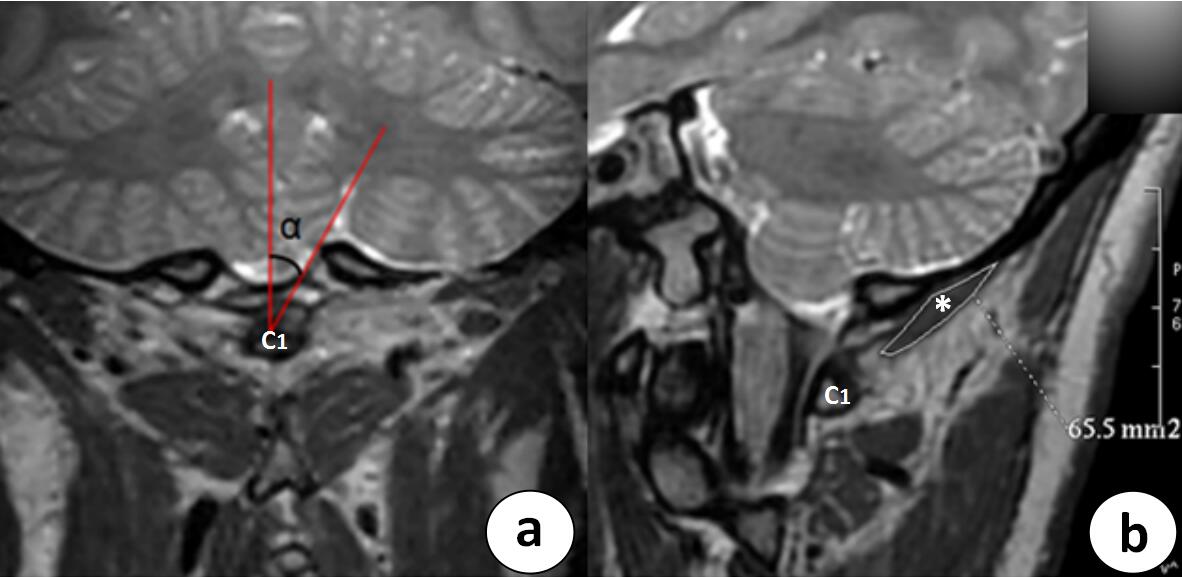
The measurement method for RCPmi’s maCSA. a. Coronal T2-weighted image cross posterior arch of atlas. The maCSA of RCPmi is measured with a 30°deviation from the oblique plane that passed through the mid-posterior arch of atlas. b. On the oblique T2-weighted image, the delineated area (white *) demonstrates the maCSA of left RCPmi of 65.5 mm2 .
Remarks: RCPmi: rectus capitis posterior minor; maCSA: major axis of cross-sectional area; C1: atlas