5136
Reproducibility of calf-muscle perfusion measurements from dynamic contrast-enhanced MRI1Department of Radiology and Imaging Sciences, University of Utah School of Medicine, Salt Lake City, UT, United States, 2Division of Geriatrics, University of Utah School of Medicine, Salt Lake City, UT, United States, 3Division of Biostatistics, University of Utah School of Medicine, Salt Lake City, UT, United States, 4Division of Vascular Surgery, University of Utah School of Medicine, Salt Lake City, UT, United States, 5Division of Cardiovascular Medicine, University of Utah School of Medicine, Salt Lake City, UT, United States
Synopsis
This study examined the reproducibility of calf-muscle perfusion measurements from DCE-MRI following plantar-flexion exercise, which is a promising technique for assessing calf-muscle function and viability. In a group of healthy subjects, the same post-exercise DCE-MRI protocol was repeated on two different days and calf-muscle perfusion measurements were compared between the two visits. High correlation and agreement of perfusion between visits was observed for the posterior calf muscles, demonstrating that a plantar-flexion exercise protocol followed by DCE-MRI is suitable for achieving precise measurements of calf-muscle perfusion.
Motivation
Lower-extremity peripheral arterial disease (PAD) impacts nearly 8 million people in the United States.1 With diminished blood supply to the calf, PAD patients often suffer from intermittent claudication.2 PAD is traditionally diagnosed from a low ankle-brachial blood-pressure index (ABI),2 followed by angiography to assess the location and extent of arterial stenosis. However, these tools provide no indication of the functional impact of PAD on the calf muscles, which is important for determining calf-muscle viability.
Perfusion is a major determinant of muscle function and viability and can be readily measured with dynamic contrast-enhanced (DCE) MRI.3,4 To measure exercise-stimulated perfusion, DCE-MRI is performed immediately after the subject exercises in the scanner. Similar to myocardial imaging, post-exercise perfusion mapping is promising for identifying diseased muscle tissue whose performance is limited by impaired blood flow.5 To utilize this method for precise diagnosis and therapeutic evaluation, it is important to assess the reproducibility of the exercise-stimulated perfusion measurement and to identify factors that could lower the reproducibility.
In this study with 9 healthy subjects, we repeated a post-exercise DCE-MRI protocol on two different days and compared the calf-muscle perfusion measurements between the two visits.
Methods
Following informed consent, nine healthy volunteers (4 male, 5 female; ages 22-43 years) were included in this IRB-approved study. While supine in a 3T MRI scanner (TimTrio; Siemens), with a 4-channel flex coil wrapped around the calf for image acquisition, each volunteer performed plantar-flexion exercise by pushing a pedal weighted by 8lbs of resistance at a rate of 1Hz for 3 minutes.6 At the end of exercise, 0.05 mmol/kg gadoteridol (Prohance; Bracco) was injected intravenously at a rate of 5 mL/s, and then dynamic imaging began and continued for 4 minutes. Dynamic images were acquired from an axial slice through the thickest part of the calf, using a 2D saturation-recovery turboFLASH sequence7 (delay-time: 300 ms, TR: 527 ms, TE: 1.42 ms, flip-angle: 15°, slice thickness: 10 mm, matrix: 128×128, FOV: 160×160 mm, temporal resolution: 1 s/frame). To quantify tracer concentration from the dynamic images, proton density was measured from the same slice using the same pulse sequence but with a long TR of 4000 ms. This protocol was then repeated for each subject on a different day (about 3-4 weeks later).
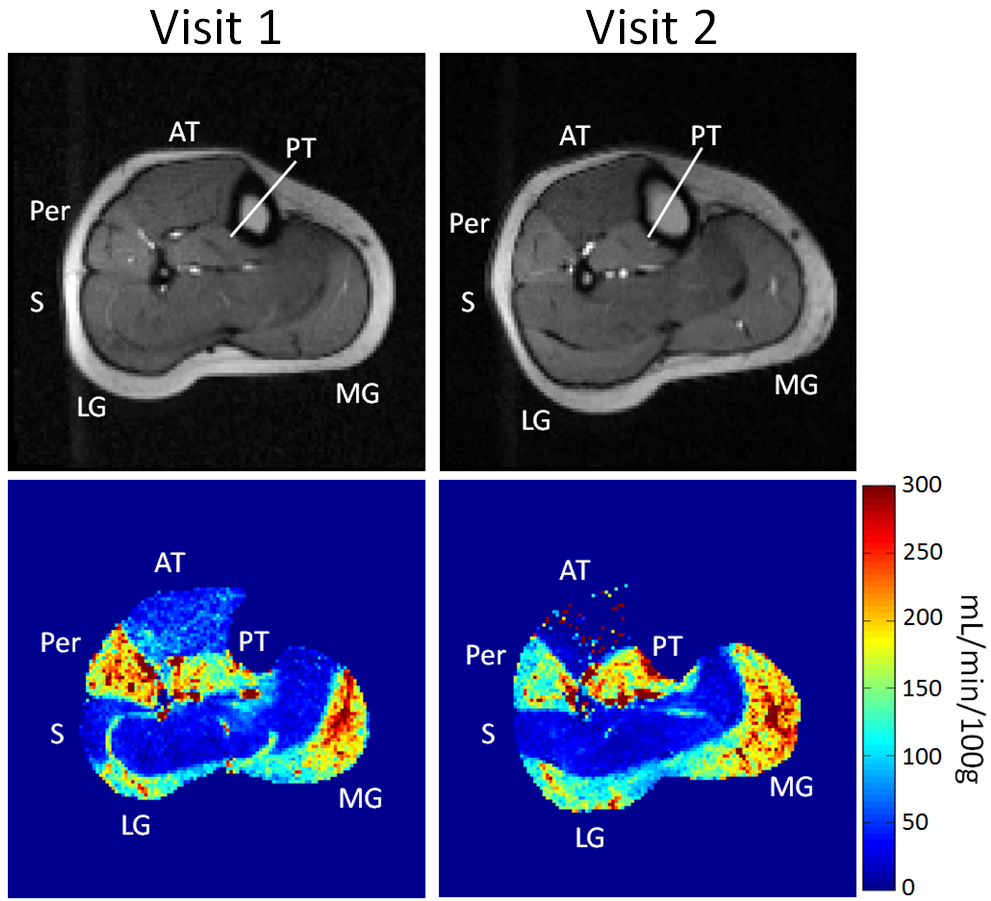
The MRI data was processed using custom MATLAB programs. Each dynamic image was converted to a map of tracer concentration.7 The arterial input function (AIF) was manually sampled from the tibial or peroneal artery visible in the imaged slice. Voxel-wise perfusion was then calculated by fitting the contrast enhancement curve of each voxel with a tracer-kinetic model that expresses the muscle tracer-concentration as a convolution of the AIF and the muscle’s impulse retention function.8-10 On each perfusion map, regions of interest (ROIs) were then manually defined to compute the average perfusion of the medial and lateral gastrocnemius (MG and LG), soleus (S), anterior and posterior tibialis (AT and PT), and peroneus longus (Per) muscle groups.
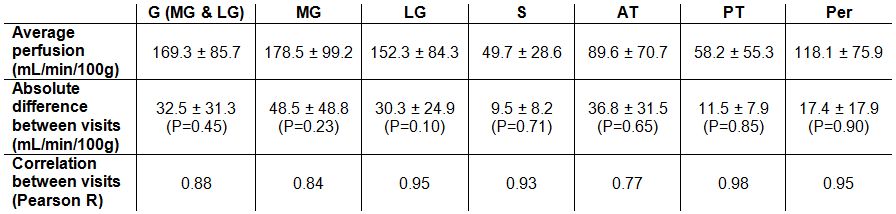
To evaluate reproducibility, agreement and correlation between perfusion measurements from the separate visits was computed. Agreement is reported as the absolute difference between the estimates from separate visits, and correlation as the Pearson correlation coefficient (R). Paired t-tests were used to determine if perfusion measurements from the two visits were significantly different (P-value < 0.05 regarded as significant).
Results
Representative calf-muscle perfusion maps are shown in Figure 1 for separate visits of a single volunteer. In this example, the overall pattern of muscle perfusion enhancement across the calf was similar between the two visits. Table 1 summarizes the agreement and correlation between perfusion measurements from separate visits. Perfusion was not significantly different between visits for any of the muscle groups (P>0.10). The difference in perfusion between visits ranged from 9.5±8.2 mL/min/100g in the soleus to 48.5±48.8 mL/min/100g in the MG.Discussion
High correlation and agreement of post-exercise perfusion between visits was observed for the plantar-flexion and stabilizing muscles (MG, LG, S, PT, Per). Lower correlation and larger absolute difference in AT perfusion between visits was likely due to variable dorsiflexion during exercise, which was not controlled for in our experiment. These results suggest that consistent exercise is important for obtaining reproducible calf-muscle perfusion measurements with post-exercise DCE-MRI. For the assessment of PAD, perfusion estimation precision is most important for the posterior calf muscles (G and S), since these are most often affected by upstream arterial stenosis.11,12 This study demonstrates that a plantar-flexion exercise protocol is suitable for achieving such precision and that post-exercise DCE-MRI is a promising technique for functional assessment of calf muscles.Acknowledgements
No acknowledgement found.References
1. Belch JJ, Topol EJ, Agnelli G, et al. Critical issues in peripheral arterial disease detection and management: a call to action. Arch Intern Med 2003;163(8):884-892.
2. Hiatt WR. Medical treatment of peripheral arterial disease and claudication. N Engl J Med 2001;344(21):1608-1621.
3. Ament W, Lubbers J, Rakhorst G, et al. Skeletal muscle perfusion measured by positron emission tomography during exercise. Pflugers Arch 1998;436(5):653-658.
4. Sourbron S, Ingrisch M, Siefert A, Reiser M, Herrmann K. Quantification of cerebral blood flow, cerebral blood volume, and blood-brain-barrier leakage with DCE-MRI. Magn Reson Med 2009;62(1):205-217.
5. Dilsizian V, Rocco TP, Freedman NM, Leon MB, Bonow RO. Enhanced detection of ischemic but viable myocardium by the reinjection of thallium after stress-redistribution imaging. N Engl J Med 1990;323(3):141-146.
6. Layec G, Haseler LJ, Richardson RS. The effect of higher ATP cost of contraction on the metabolic response to graded exercise in patients with chronic obstructive pulmonary disease. J Appl Physiol (1985) 2012;112(6):1041-1048.
7. Vivier PH, Storey P, Rusinek H, et al. Kidney function: glomerular filtration rate measurement with MR renography in patients with cirrhosis. Radiology 2011;259(2):462-470.
8. St Lawrence KS, Lee TY. An adiabatic approximation to the tissue homogeneity model for water exchange in the brain: II. Experimental validation. J Cereb Blood Flow Metab 1998;18(12):1378-1385.
9. Zhang JL, Rusinek H, Bokacheva L, et al. Functional assessment of the kidney from magnetic resonance and computed tomography renography: impulse retention approach to a multicompartment model. Magn Reson Med 2008;59(2):278-288.
10. Cheong LH, Markus Tan CK, Koh TS, Tchoyoson Lim CC, Bisdas S. Functional Imaging: Dynamic Contrast-Enhanced CT using a Distributed-Parameter Physiologic Model for Accessing Stroke and Intracranial Tumor. Conference proceedings: Annual International Conference of the IEEE Engineering in Medicine and Biology Society 2005;1:294-297.
11. Lenhart RL, Francis CA, Lenz AL, Thelen DG. Empirical evaluation of gastrocnemius and soleus function during walking. J Biomech 2014;47(12):2969-2974.
12. Duysens J, Tax AA, van der Doelen B, Trippel M, Dietz V. Selective activation of human soleus or gastrocnemius in reflex responses during walking and running. Exp Brain Res 1991;87(1):193-204.
Figures