5135
Signal-to-Noise Assessment for Diffusion Tensor Imaging of Muscles Using Single Data Set1University of Texas Southwestern Medical Center, Dallas, TX, United States, 2Children's Medical Center, Dallas, TX, United States, 3University Medical Center Hamburg-Eppendorf, Hamburg, Germany
Synopsis
The DTI metric are prone to bias if the SNR is too low, such as in muscular dystrophies where fat infiltration decreases the partial volume of the muscle. DTI is usually acquired using parallel imaging so the noise level from the background air space is unreliable for SNR assessment. SNR can be measured using a difference image method from 2 image sets acquired repeatedly, but in many studies only one data set is acquired. Here high-pass k-space filtering method for measuring SNR of muscle DTI from single data set was optimized using a difference image method as reference.
Introduction
Diffusion
tensor imaging metrics (FA and MD) are able to reveal pathologic conditions of
muscle fibers in muscle degeneration diseases. However, the measurement results
are prone to bias if the SNR is too low1. This is often a problem in
muscular dystrophies because fat infiltration decreases the partial volume of
the muscle in image voxels leading to decrease of SNR. In patient studies, it
is very important to assess the SNR level for each ROI under investigation. In
most cases, DTI is acquired using parallel imaging so the noise level from the
background air space is different from that on the ROI. SNR can
be measured using a difference image method from 2 image sets acquired
repeatedly. However, in many studies only one data set is acquired and there is
only one b=0 image volume. Here high-pass k-space filtering
method for measuring SNR of muscle DTI from single data set was optimized using a difference image method as reference following a similar approach for SNR
assessment for the DTI of brain2.Materials and Methods
DTI Acquisition: DTI of the thigh were acquired from 11 healthy subjects (male: female = 6:5, age 31.5 ± 4.0 years) using a 3-Tesla scanner (Philips Ingenia, software release 5.7.1.2) and a 28-channel SENSE torso array coil. Axial fat-suppressed spin-echo single-shot echo planar imaging (SE-EPI) DTI sequence was used (TR 2433-4565 ms, TE 66 ms, FOV 224×224 mm, acquisition matrix size 112×112, water-fat-shift 32 mm, b=0 and 500 sec/mm2, 15 diffusion encoding directions, 20 to 33 slices with a thickness of 6 mm and slice gap 0 mm, SENSE factor=2). DTI protocols were repeated multiple time (four times for NSA = 4 and 8).
Data Analysis: For each subjects the DTI from multiple acquisitions were registered using the PRIDE tool3. Software for data analysis was written in IDL 8.4. One pair of DTI acquisitions each were selected for NSA=4 and 8 based on minimum residual signal on the difference image to ensure reliable noise level measurement. Using the difference image method, the SNR of one DTI acquisition is given as:
$$ SNRdiff=sqrt(2)·S0/sqrt(Vnoise_diff). $$ [1]
Here signal S0 was averaged over the ROI on the b=0 image, and noise variance Vnoise_diff was evaluated from diffusion weighted images (b=500 and all 15 diffusion encoding directions). The muscle ROI combines manually traced areas in 6 adjacent slices. In the single data set method, each image slice was first transformed into k-space. We assume the signals are mostly at the center of k-space, and noise could be assessed at the periphery of k-space. A high-pass Butterworth filter was applied:
$$ F(kx,ky)=F0/sqrt(1+(kc2/(kx2+ky2))n). $$ [2]
Here, kx and ky are k-space coordinates, kc and n are the cut-off value and order of the Butterworth filter, and F0 is a normalization factor compensating the loss of noise due to filtering. After applying the filter Eq. [2], an inverse Fourier transform was performed to obtain an amplitude noise image. The SNR over the ROI was calculated as:
$$ SNRsingle_set = 0.655·S0/sqrt(Vnoise_single). $$ [3]
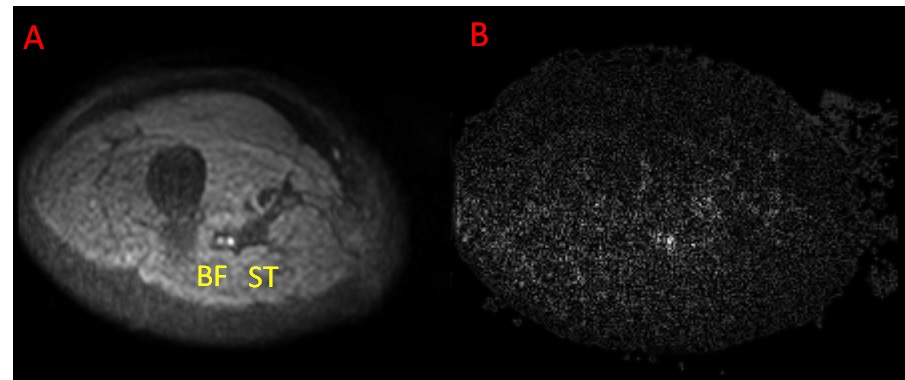
The factor 0.655 accounts for the Rician characteristics after processing. The filter parameters F0, n and kc were optimized over biceps femoris (BF) and semitendinosus (ST) muscles.
Results
Figure 1
shows a diffusion weighted image and the corresponding noise amplitude image
obtained by high-pass filtering.
The ROI volumes were 14.5±4.3 and 18.3±3.7cm3
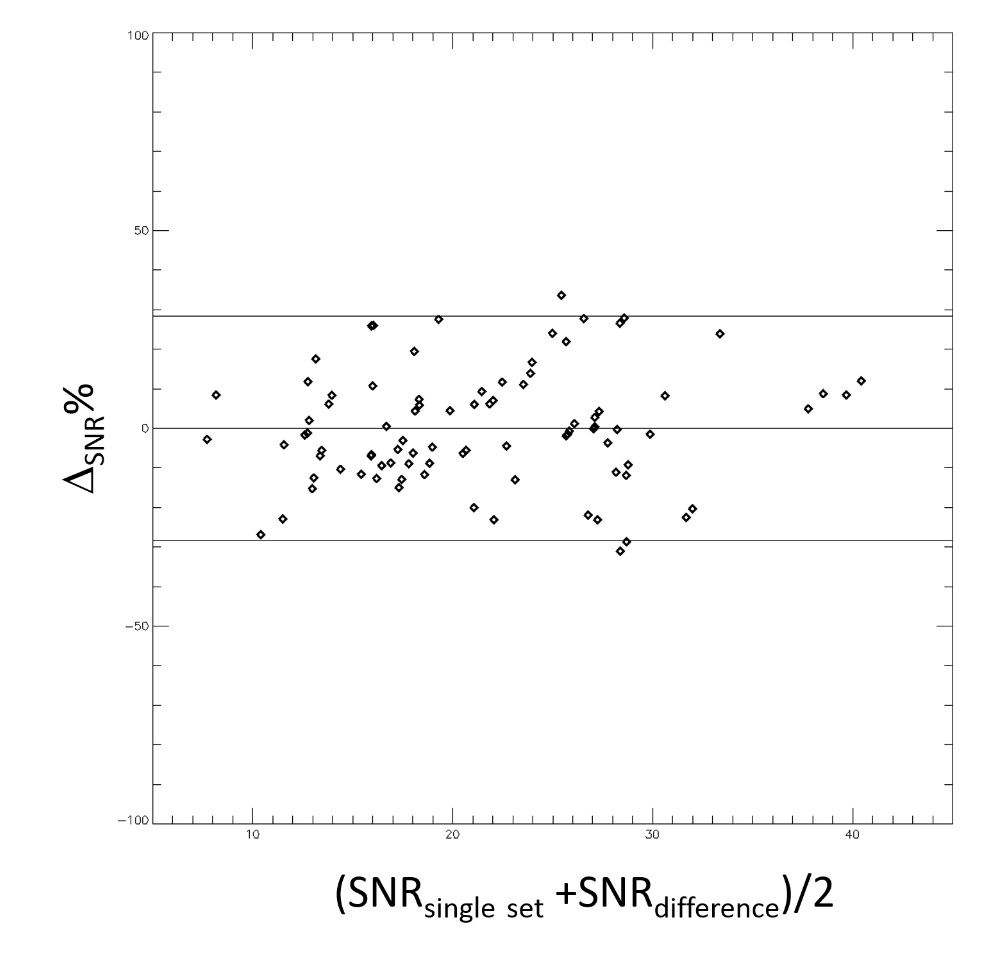
for BF and ST muscles. A wide range of parameters for Eq. [2] were found to yield
reasonable results. For example, F0=8.67, n=3 and kc=105∙(2π/fov)
yielded mean bias=0 and 95% limits of agreement of -28% to 28%. The
Bland-Altman plot comparing SNR from the high-pass filtering and difference
method is shown in Figure 2.Discussion
The high-pass filtering approach has advantages and
disadvantages compared with the difference image method. The difference image
method assumes perfect cancellation of the signal, but this condition may be
compromised due to motion and other instabilities. The high-pass filtering
method may be less prone to motion, but the filter may not completely remove
signals from muscles. We found in this study that optimal parameters for
muscles ROI are different from that reported for the brain2. This is
likely to be caused by the different signal distributions in k-space for the
brain and thigh, as well as different image acquisition matrix size.Conclusion
When multiple DTI acquisitions or multiple b=0 images are not
available, SNR may be estimated from one image set using high-pass k-space
filtering.Acknowledgements
No acknowledgement found.References
1. Hooijmans MT, Damon BM, Froeling M et al (2015) Evaluation of skeletal muscle DTI in patients with duchenne muscular dystrophy. NMR Biomed. 10.1002/nbm.3427
2. Wang ZJ, Chia JM, Ahmed S, Rollins NK (2014) Signal-to-noise assessment for diffusion tensor imaging with single data set and validation using a difference image method with data from a multicenter study. Med Phys 41:092302
3. Netsch T, van Muiswinkel A (2004) Quantitative evaluation of image-based distortion correction in diffusion tensor imaging. IEEE Trans Med Imaging 23:789-798
Figures